
 Login Sign Up


| |||||
 |  | ||||

| 12Stocks.com Market Intelligence |
Best Healthcare Stocks
 | "Discover best trending healthcare stocks with 12Stocks.com." |
| - Subu Vdaygiri, Founder, 12Stocks.com |
| In a hurry? Healthcare Stocks Lists: Performance Trends Table, Stock Charts
Sort Healthcare stocks: Daily, Weekly, Year-to-Date, Market Cap & Trends. Filter Healthcare stocks list by size:All Healthcare Large Mid-Range Small |
| 12Stocks.com Healthcare Stocks Performances & Trends Daily | |||||||||
|
|  The overall Smart Investing & Trading Score is 18 (0-bearish to 100-bullish) which puts Healthcare sector in short term bearish trend. The Smart Investing & Trading Score from previous trading session is 10 and an improvement of trend continues.
| ||||||||
Here are the Smart Investing & Trading Scores of the most requested Healthcare stocks at 12Stocks.com (click stock name for detailed review):
|


| 12Stocks.com: Investing in Healthcare sector with Stocks | |
|
The following table helps investors and traders sort through current performance and trends (as measured by Smart Investing & Trading Score) of various
stocks in the Healthcare sector. Quick View: Move mouse or cursor over stock symbol (ticker) to view short-term Technical chart and over stock name to view long term chart. Click on  to add stock symbol to your watchlist and to add stock symbol to your watchlist and  to view watchlist. Click on any ticker or stock name for detailed market intelligence report for that stock. to view watchlist. Click on any ticker or stock name for detailed market intelligence report for that stock. |
12Stocks.com Performance of Stocks in Healthcare Sector
| Ticker | Stock Name | Watchlist | Category | Recent Price | Smart Investing & Trading Score | Change % | Weekly Change% |
| CELC | Celcuity |   | Laboratories | 16.70 | 36 | -1.79% | -8.77% |
| EDIT | Editas Medicine | | Biotechnology | 5.67 | 10 | 0.98% | -8.78% |
| DNLI | Denali | | Biotechnology | 16.65 | 46 | -1.01% | -8.82% |
| RVNC | Revance | | Biotechnology | 3.77 | 20 | 0.13% | -8.84% |
| VIGL | Vigil Neuroscience | | Biotechnology | 2.94 | 43 | 0.86% | -8.85% |
| KZR | Kezar Life | | Biotechnology | 0.79 | 35 | -3.73% | -8.88% |
| VALN | Valneva SE | | Biotechnology | 7.75 | 15 | -3.12% | -8.93% |
| ARWR | Arrowhead | | Biotechnology | 22.51 | 0 | -3.45% | -8.94% |
| SGHT | Sight Sciences | | Medical Devices | 5.29 | 36 | -1.49% | -8.95% |
| QDEL | Quidel | | Diagnostic | 38.39 | 10 | -0.83% | -8.96% |
| HLTH | Nobilis Health | | Hospitals | 0.15 | 35 | 2.35% | -8.98% |
| APLS | Apellis | | Biotechnology | 47.08 | 10 | -1.98% | -9.09% |
| BRKR | Bruker | | Laboratories | 79.59 | 26 | -4.04% | -9.12% |
| OMGA | Omega | | Biotechnology | 2.43 | 10 | -5.26% | -9.16% |
| RGEN | Repligen | | Biotechnology | 155.79 | 0 | -3.23% | -9.18% |
| MCRB | Seres | | Biotechnology | 0.59 | 10 | -5.23% | -9.20% |
| AXGN | AxoGen | | Equipment | 6.54 | 0 | -5.69% | -9.22% |
| THC | Tenet | | Hospitals | 91.14 | 26 | -5.06% | -9.25% |
| VYGR | Voyager | | Biotechnology | 7.65 | 36 | -1.16% | -9.25% |
| MIST | Milestone | | Biotechnology | 1.57 | 51 | -10.29% | -9.25% |
| DNA | Ginkgo Bioworks | | Biotechnology | 0.92 | 15 | 5.13% | -9.28% |
| RGNX | REGENXBIO | | Biotechnology | 16.41 | 36 | -3.64% | -9.29% |
| BMRA | Biomerica | | Instruments | 0.75 | 20 | 0.00% | -9.30% |
| LEGN | Legend Biotech | | Biotechnology | 48.00 | 0 | -1.70% | -9.30% |
| TARA | ArTara | | Biotechnology | 2.72 | 36 | -0.37% | -9.33% |
| For chart view version of above stock list: Chart View ➞ 0 - 25 , 25 - 50 , 50 - 75 , 75 - 100 , 100 - 125 , 125 - 150 , 150 - 175 , 175 - 200 , 200 - 225 , 225 - 250 , 250 - 275 , 275 - 300 , 300 - 325 , 325 - 350 , 350 - 375 , 375 - 400 , 400 - 425 , 425 - 450 , 450 - 475 , 475 - 500 , 500 - 525 , 525 - 550 , 550 - 575 , 575 - 600 , 600 - 625 , 625 - 650 , 650 - 675 , 675 - 700 , 700 - 725 | ||
 | Click To Change The Sort Order: By Market Cap or Company Size Performance: Year-to-date, Week and Day |  |
|
Get the most comprehensive stock market coverage daily at 12Stocks.com ➞ Best Stocks Today ➞ Best Stocks Weekly ➞ Best Stocks Year-to-Date ➞ Best Stocks Trends ➞  Best Stocks Today 12Stocks.com Best Nasdaq Stocks ➞ Best S&P 500 Stocks ➞ Best Tech Stocks ➞ Best Biotech Stocks ➞ |
| Detailed Overview of Healthcare Stocks |
| Healthcare Technical Overview, Leaders & Laggards, Top Healthcare ETF Funds & Detailed Healthcare Stocks List, Charts, Trends & More |
| Healthcare Sector: Technical Analysis, Trends & YTD Performance | |
| Healthcare sector is composed of stocks
from pharmaceutical, biotech, diagnostics labs, insurance providers
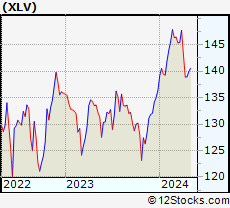
and healthcare services. Healthcare sector, as represented by XLV, an exchange-traded fund [ETF] that holds basket of Healthcare stocks (e.g, Merck, Amgen) is up by 1.58% and is currently underperforming the overall market by -2.45% year-to-date. Below is a quick view of Technical charts and trends: |
|
 XLV Weekly Chart |
|
| Long Term Trend: Not Good | |
| Medium Term Trend: Not Good | |
 XLV Daily Chart |
|
| Short Term Trend: Very Good | |
| Overall Trend Score: 18 | |
| YTD Performance: 1.58% | |
| **Trend Scores & Views Are Only For Educational Purposes And Not For Investing | |
| 12Stocks.com: Top Performing Healthcare Sector Stocks | ||||||||||||||||||||||||||||||||||||||||||||||||
 The top performing Healthcare sector stocks year to date are
Now, more recently, over last week, the top performing Healthcare sector stocks on the move are


|
||||||||||||||||||||||||||||||||||||||||||||||||
| 12Stocks.com: Investing in Healthcare Sector using Exchange Traded Funds | |
|
The following table shows list of key exchange traded funds (ETF) that
help investors track Healthcare Index. For detailed view, check out our ETF Funds section of our website. Quick View: Move mouse or cursor over ETF symbol (ticker) to view short-term Technical chart and over ETF name to view long term chart. Click on ticker or stock name for detailed view. Click on to add stock symbol to your watchlist and to view watchlist. |
12Stocks.com List of ETFs that track Healthcare Index
| Ticker | ETF Name | Watchlist | Recent Price | Smart Investing & Trading Score | Change % | Week % | Year-to-date % |
| XLV | Health Care | | 138.54 | 18 | 0.07 | -0.27 | 1.58% |
| XBI | Biotech | | 83.88 | 10 | -0.91 | -4.84 | -6.06% |
| IBB | Biotechnology | | 124.91 | 10 | -0.78 | -3.6 | -8.05% |
| BBH | Biotech | | 152.32 | 10 | -0.45 | -3.34 | -7.86% |
| VHT | Health Care | | 252.54 | 18 | -0.23 | -0.88 | 0.73% |
| IYH | Healthcare | | 58.05 | 10 | -0.02 | -0.6 | 1.4% |
| IHF | Healthcare Providers | | 51.71 | 45 | 1.25 | 2.31 | -1.52% |
| IHI | Medical Devices | | 54.43 | 5 | -0.64 | -2.98 | 0.85% |
| BIB | Biotechnology | | 48.23 | 0 | -1.44 | -6.16 | -15.47% |
| BIS | Short Biotech | | 20.57 | 95 | 0.24 | 4.95 | 13.84% |
| XHE | Health Care Equipment | | 81.28 | 20 | -0.93 | -3.11 | -3.54% |
| CURE | Healthcare Bull 3X | | 102.24 | 10 | -0.42 | -1.12 | 0.49% |
| LABU | Biotech Bull 3X | | 89.48 | 10 | -2.76 | -14.25 | -26.64% |
| LABD | Biotech Bear 3X | | 10.42 | 82 | 3.37 | 16.04 | 7.53% |
| PSCH | SmallCap Health Care | | 40.42 | 28 | -0.03 | -2.44 | -5.56% |
| XHS | Health Care Services | | 86.32 | 23 | -0.01 | -1.92 | -2.96% |
| PTH | DWA Healthcare Momentum | | 40.51 | 46 | 0.15 | -3.16 | 3.5% |
| BTEC | Principal Healthcare Innovators | | 34.41 | 10 | -0.58 | -4.39 | -5.28% |
| RXL | Health Care | | 92.44 | 10 | -0.61 | -0.88 | 1.13% |
| RXD | Short Health Care | | 11.54 | 73 | -1.20 | -0.52 | -3.23% |
| 12Stocks.com: Charts, Trends, Fundamental Data and Performances of Healthcare Stocks | |
|
We now take in-depth look at all Healthcare stocks including charts, multi-period performances and overall trends (as measured by Smart Investing & Trading Score). One can sort Healthcare stocks (click link to choose) by Daily, Weekly and by Year-to-Date performances. Also, one can sort by size of the company or by market capitalization. |
| Select Your Default Chart Type: | |||||
| |||||
| Click on stock symbol or name for detailed view. Click on to add stock symbol to your watchlist and to view watchlist. Quick View: Move mouse or cursor over "Daily" to quickly view daily Technical stock chart and over "Weekly" to view weekly Technical stock chart. | |||||

 | CELC Celcuity Inc. |
| Sector: Health Care | |
| SubSector: Medical Laboratories & Research | |
| MarketCap: 70.53 Millions | |
| Recent Price: 16.70 Smart Investing & Trading Score: 36 | |
| Day Percent Change: -1.79% Day Change: -0.31 | |
| Week Change: -8.77% Year-to-date Change: 14.0% | |
| CELC Links: Profile News Message Board | |
| Charts:- Daily , Weekly | |
| Add CELC to Watchlist: View: Get Complete CELC Trend Analysis ➞ | |
 | EDIT Editas Medicine, Inc. |
| Sector: Health Care | |
| SubSector: Biotechnology | |
| MarketCap: 1194.95 Millions | |
| Recent Price: 5.67 Smart Investing & Trading Score: 10 | |
| Day Percent Change: 0.98% Day Change: 0.05 | |
| Week Change: -8.78% Year-to-date Change: -44.1% | |
| EDIT Links: Profile News Message Board | |
| Charts:- Daily , Weekly | |
| Add EDIT to Watchlist: View: Get Complete EDIT Trend Analysis ➞ | |
 | DNLI Denali Therapeutics Inc. |
| Sector: Health Care | |
| SubSector: Biotechnology | |
| MarketCap: 2020.05 Millions | |
| Recent Price: 16.65 Smart Investing & Trading Score: 46 | |
| Day Percent Change: -1.01% Day Change: -0.17 | |
| Week Change: -8.82% Year-to-date Change: -22.4% | |
| DNLI Links: Profile News Message Board | |
| Charts:- Daily , Weekly | |
| Add DNLI to Watchlist: View: Get Complete DNLI Trend Analysis ➞ | |
 | RVNC Revance Therapeutics, Inc. |
| Sector: Health Care | |
| SubSector: Biotechnology | |
| MarketCap: 854.185 Millions | |
| Recent Price: 3.77 Smart Investing & Trading Score: 20 | |
| Day Percent Change: 0.13% Day Change: 0.01 | |
| Week Change: -8.84% Year-to-date Change: -57.2% | |
| RVNC Links: Profile News Message Board | |
| Charts:- Daily , Weekly | |
| Add RVNC to Watchlist: View: Get Complete RVNC Trend Analysis ➞ | |
 | VIGL Vigil Neuroscience, Inc. |
| Sector: Health Care | |
| SubSector: Biotechnology | |
| MarketCap: 339 Millions | |
| Recent Price: 2.94 Smart Investing & Trading Score: 43 | |
| Day Percent Change: 0.86% Day Change: 0.02 | |
| Week Change: -8.85% Year-to-date Change: -14.4% | |
| VIGL Links: Profile News Message Board | |
| Charts:- Daily , Weekly | |
| Add VIGL to Watchlist: View: Get Complete VIGL Trend Analysis ➞ | |
 | KZR Kezar Life Sciences, Inc. |
| Sector: Health Care | |
| SubSector: Biotechnology | |
| MarketCap: 174.885 Millions | |
| Recent Price: 0.79 Smart Investing & Trading Score: 35 | |
| Day Percent Change: -3.73% Day Change: -0.03 | |
| Week Change: -8.88% Year-to-date Change: -17.0% | |
| KZR Links: Profile News Message Board | |
| Charts:- Daily , Weekly | |
| Add KZR to Watchlist: View: Get Complete KZR Trend Analysis ➞ | |
 | VALN Valneva SE |
| Sector: Health Care | |
| SubSector: Biotechnology | |
| MarketCap: 1010 Millions | |
| Recent Price: 7.75 Smart Investing & Trading Score: 15 | |
| Day Percent Change: -3.12% Day Change: -0.25 | |
| Week Change: -8.93% Year-to-date Change: -25.3% | |
| VALN Links: Profile News Message Board | |
| Charts:- Daily , Weekly | |
| Add VALN to Watchlist: View: Get Complete VALN Trend Analysis ➞ | |
 | ARWR Arrowhead Pharmaceuticals, Inc. |
| Sector: Health Care | |
| SubSector: Biotechnology | |
| MarketCap: 3226.15 Millions | |
| Recent Price: 22.51 Smart Investing & Trading Score: 0 | |
| Day Percent Change: -3.45% Day Change: -0.80 | |
| Week Change: -8.94% Year-to-date Change: -26.4% | |
| ARWR Links: Profile News Message Board | |
| Charts:- Daily , Weekly | |
| Add ARWR to Watchlist: View: Get Complete ARWR Trend Analysis ➞ | |
 | SGHT Sight Sciences, Inc. |
| Sector: Health Care | |
| SubSector: Medical Devices | |
| MarketCap: 381 Millions | |
| Recent Price: 5.29 Smart Investing & Trading Score: 36 | |
| Day Percent Change: -1.49% Day Change: -0.08 | |
| Week Change: -8.95% Year-to-date Change: 2.4% | |
| SGHT Links: Profile News Message Board | |
| Charts:- Daily , Weekly | |
| Add SGHT to Watchlist: View: Get Complete SGHT Trend Analysis ➞ | |
 | QDEL Quidel Corporation |
| Sector: Health Care | |
| SubSector: Diagnostic Substances | |
| MarketCap: 4104.91 Millions | |
| Recent Price: 38.39 Smart Investing & Trading Score: 10 | |
| Day Percent Change: -0.83% Day Change: -0.32 | |
| Week Change: -8.96% Year-to-date Change: -47.9% | |
| QDEL Links: Profile News Message Board | |
| Charts:- Daily , Weekly | |
| Add QDEL to Watchlist: View: Get Complete QDEL Trend Analysis ➞ | |
 | HLTH Nobilis Health Corp. |
| Sector: Health Care | |
| SubSector: Hospitals | |
| MarketCap: 124.22 Millions | |
| Recent Price: 0.15 Smart Investing & Trading Score: 35 | |
| Day Percent Change: 2.35% Day Change: 0.00 | |
| Week Change: -8.98% Year-to-date Change: -8.9% | |
| HLTH Links: Profile News Message Board | |
| Charts:- Daily , Weekly | |
| Add HLTH to Watchlist: View: Get Complete HLTH Trend Analysis ➞ | |
 | APLS Apellis Pharmaceuticals, Inc. |
| Sector: Health Care | |
| SubSector: Biotechnology | |
| MarketCap: 2030.95 Millions | |
| Recent Price: 47.08 Smart Investing & Trading Score: 10 | |
| Day Percent Change: -1.98% Day Change: -0.95 | |
| Week Change: -9.09% Year-to-date Change: -21.4% | |
| APLS Links: Profile News Message Board | |
| Charts:- Daily , Weekly | |
| Add APLS to Watchlist: View: Get Complete APLS Trend Analysis ➞ | |
 | BRKR Bruker Corporation |
| Sector: Health Care | |
| SubSector: Medical Laboratories & Research | |
| MarketCap: 5932 Millions | |
| Recent Price: 79.59 Smart Investing & Trading Score: 26 | |
| Day Percent Change: -4.04% Day Change: -3.35 | |
| Week Change: -9.12% Year-to-date Change: 8.3% | |
| BRKR Links: Profile News Message Board | |
| Charts:- Daily , Weekly | |
| Add BRKR to Watchlist: View: Get Complete BRKR Trend Analysis ➞ | |
 | OMGA Omega Therapeutics, Inc. |
| Sector: Health Care | |
| SubSector: Biotechnology | |
| MarketCap: 304 Millions | |
| Recent Price: 2.43 Smart Investing & Trading Score: 10 | |
| Day Percent Change: -5.26% Day Change: -0.13 | |
| Week Change: -9.16% Year-to-date Change: -19.3% | |
| OMGA Links: Profile News Message Board | |
| Charts:- Daily , Weekly | |
| Add OMGA to Watchlist: View: Get Complete OMGA Trend Analysis ➞ | |
 | RGEN Repligen Corporation |
| Sector: Health Care | |
| SubSector: Biotechnology | |
| MarketCap: 4711.75 Millions | |
| Recent Price: 155.79 Smart Investing & Trading Score: 0 | |
| Day Percent Change: -3.23% Day Change: -5.19 | |
| Week Change: -9.18% Year-to-date Change: -13.4% | |
| RGEN Links: Profile News Message Board | |
| Charts:- Daily , Weekly | |
| Add RGEN to Watchlist: View: Get Complete RGEN Trend Analysis ➞ | |
 | MCRB Seres Therapeutics, Inc. |
| Sector: Health Care | |
| SubSector: Biotechnology | |
| MarketCap: 217.585 Millions | |
| Recent Price: 0.59 Smart Investing & Trading Score: 10 | |
| Day Percent Change: -5.23% Day Change: -0.03 | |
| Week Change: -9.2% Year-to-date Change: -57.5% | |
| MCRB Links: Profile News Message Board | |
| Charts:- Daily , Weekly | |
| Add MCRB to Watchlist: View: Get Complete MCRB Trend Analysis ➞ | |
 | AXGN AxoGen, Inc. |
| Sector: Health Care | |
| SubSector: Medical Appliances & Equipment | |
| MarketCap: 349.28 Millions | |
| Recent Price: 6.54 Smart Investing & Trading Score: 0 | |
| Day Percent Change: -5.69% Day Change: -0.40 | |
| Week Change: -9.22% Year-to-date Change: -4.2% | |
| AXGN Links: Profile News Message Board | |
| Charts:- Daily , Weekly | |
| Add AXGN to Watchlist: View: Get Complete AXGN Trend Analysis ➞ | |
 | THC Tenet Healthcare Corporation |
| Sector: Health Care | |
| SubSector: Hospitals | |
| MarketCap: 1544.46 Millions | |
| Recent Price: 91.14 Smart Investing & Trading Score: 26 | |
| Day Percent Change: -5.06% Day Change: -4.86 | |
| Week Change: -9.25% Year-to-date Change: 20.6% | |
| THC Links: Profile News Message Board | |
| Charts:- Daily , Weekly | |
| Add THC to Watchlist: View: Get Complete THC Trend Analysis ➞ | |
 | VYGR Voyager Therapeutics, Inc. |
| Sector: Health Care | |
| SubSector: Biotechnology | |
| MarketCap: 321.085 Millions | |
| Recent Price: 7.65 Smart Investing & Trading Score: 36 | |
| Day Percent Change: -1.16% Day Change: -0.09 | |
| Week Change: -9.25% Year-to-date Change: -9.4% | |
| VYGR Links: Profile News Message Board | |
| Charts:- Daily , Weekly | |
| Add VYGR to Watchlist: View: Get Complete VYGR Trend Analysis ➞ | |
 | MIST Milestone Pharmaceuticals Inc. |
| Sector: Health Care | |
| SubSector: Biotechnology | |
| MarketCap: 342.685 Millions | |
| Recent Price: 1.57 Smart Investing & Trading Score: 51 | |
| Day Percent Change: -10.29% Day Change: -0.18 | |
| Week Change: -9.25% Year-to-date Change: -6.0% | |
| MIST Links: Profile News Message Board | |
| Charts:- Daily , Weekly | |
| Add MIST to Watchlist: View: Get Complete MIST Trend Analysis ➞ | |
 | DNA Ginkgo Bioworks Holdings, Inc. |
| Sector: Health Care | |
| SubSector: Biotechnology | |
| MarketCap: 3680 Millions | |
| Recent Price: 0.92 Smart Investing & Trading Score: 15 | |
| Day Percent Change: 5.13% Day Change: 0.04 | |
| Week Change: -9.28% Year-to-date Change: -45.5% | |
| DNA Links: Profile News Message Board | |
| Charts:- Daily , Weekly | |
| Add DNA to Watchlist: View: Get Complete DNA Trend Analysis ➞ | |
 | RGNX REGENXBIO Inc. |
| Sector: Health Care | |
| SubSector: Biotechnology | |
| MarketCap: 1232.85 Millions | |
| Recent Price: 16.41 Smart Investing & Trading Score: 36 | |
| Day Percent Change: -3.64% Day Change: -0.62 | |
| Week Change: -9.29% Year-to-date Change: -8.6% | |
| RGNX Links: Profile News Message Board | |
| Charts:- Daily , Weekly | |
| Add RGNX to Watchlist: View: Get Complete RGNX Trend Analysis ➞ | |
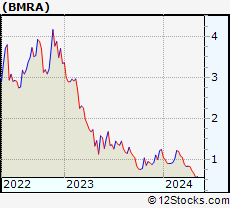 | BMRA Biomerica, Inc. |
| Sector: Health Care | |
| SubSector: Medical Instruments & Supplies | |
| MarketCap: 80.286 Millions | |
| Recent Price: 0.75 Smart Investing & Trading Score: 20 | |
| Day Percent Change: 0.00% Day Change: 0.00 | |
| Week Change: -9.3% Year-to-date Change: -39.9% | |
| BMRA Links: Profile News Message Board | |
| Charts:- Daily , Weekly | |
| Add BMRA to Watchlist: View: Get Complete BMRA Trend Analysis ➞ | |
 | LEGN Legend Biotech Corporation |
| Sector: Health Care | |
| SubSector: Biotechnology | |
| MarketCap: 37387 Millions | |
| Recent Price: 48.00 Smart Investing & Trading Score: 0 | |
| Day Percent Change: -1.70% Day Change: -0.83 | |
| Week Change: -9.3% Year-to-date Change: -20.4% | |
| LEGN Links: Profile News Message Board | |
| Charts:- Daily , Weekly | |
| Add LEGN to Watchlist: View: Get Complete LEGN Trend Analysis ➞ | |
 | TARA ArTara Therapeutics, Inc. |
| Sector: Health Care | |
| SubSector: Biotechnology | |
| MarketCap: 140.685 Millions | |
| Recent Price: 2.72 Smart Investing & Trading Score: 36 | |
| Day Percent Change: -0.37% Day Change: -0.01 | |
| Week Change: -9.33% Year-to-date Change: 45.1% | |
| TARA Links: Profile News Message Board | |
| Charts:- Daily , Weekly | |
| Add TARA to Watchlist: View: Get Complete TARA Trend Analysis ➞ | |
| For tabular summary view of above stock list: Summary View ➞ 0 - 25 , 25 - 50 , 50 - 75 , 75 - 100 , 100 - 125 , 125 - 150 , 150 - 175 , 175 - 200 , 200 - 225 , 225 - 250 , 250 - 275 , 275 - 300 , 300 - 325 , 325 - 350 , 350 - 375 , 375 - 400 , 400 - 425 , 425 - 450 , 450 - 475 , 475 - 500 , 500 - 525 , 525 - 550 , 550 - 575 , 575 - 600 , 600 - 625 , 625 - 650 , 650 - 675 , 675 - 700 , 700 - 725 | ||
| Click To Change The Sort Order: By Market Cap or Company Size Performance: Year-to-date, Week and Day | |
| Select Chart Type: | ||
|
Best Stocks Today 12Stocks.com |
© 2024 12Stocks.com Terms & Conditions Privacy Contact Us
All Information Provided Only For Education And Not To Be Used For Investing or Trading. See Terms & Conditions


One More Thing ... Get Best Stocks Delivered Daily!
Never Ever Miss A Move With Our Top Ten Stocks Lists
Find Best Stocks In Any Market - Bull or Bear Market
Take A Peek At Our Top Ten Stocks Lists: Daily, Weekly, Year-to-Date & Top Trends
Find Best Stocks In Any Market - Bull or Bear Market
Take A Peek At Our Top Ten Stocks Lists: Daily, Weekly, Year-to-Date & Top Trends
Healthcare Stocks With Best Up Trends [0-bearish to 100-bullish]: Cullinan Oncology[100], Oscar Health[100], Geron [100], Lantheus [100], ALX Oncology[100], Avadel [100], Zura Bio[93], PROCEPT BioRobotics[93], NuCana [93], United [93], Vanda [93]
Best Healthcare Stocks Year-to-Date:
Precision BioSciences[3023.29%], Inovio [1911.76%], Assembly Biosciences[1479.08%], Adverum Biotechnologies[1361.21%], Aurora Cannabis[1279.67%], NuCana [1269.17%], Affimed N.V[733.6%], Agenus [511.18%], Corbus [497.76%], CareMax [417.53%], Mesoblast [368.18%] Best Healthcare Stocks This Week:
NuCana [1708.84%], Agile [65.44%], 23andMe Holding[33.3%], ProKidney [32%], Rani [28.8%], Regencell Bioscience[24.34%], ALX Oncology[22.79%], Vanda [20.63%], Venus Concept[15.35%], Cullinan Oncology[13.89%], DURECT [13.55%] Best Healthcare Stocks Daily:
23andMe Holding[65.91%], Agile [64.76%], Canopy Growth[25.04%], Veru [16.81%], Acutus [15.17%], Aurora Cannabis[13.47%], Bicycle [11.69%], Zura Bio[10.99%], DURECT [10.48%], Vaxxinity [10.05%], Cullinan Oncology[6.42%]