
 Login Sign Up


| |||||
 |  | ||||

| 12Stocks.com Market Intelligence |
Best Healthcare Stocks
 | "Discover best trending healthcare stocks with 12Stocks.com." |
| - Subu Vdaygiri, Founder, 12Stocks.com |
| In a hurry? Healthcare Stocks Lists: Performance Trends Table, Stock Charts
Sort Healthcare stocks: Daily, Weekly, Year-to-Date, Market Cap & Trends. Filter Healthcare stocks list by size:All Healthcare Large Mid-Range Small |
| 12Stocks.com Healthcare Stocks Performances & Trends Daily | |||||||||
|
|  The overall Smart Investing & Trading Score is 52 (0-bearish to 100-bullish) which puts Healthcare sector in short term neutral trend. The Smart Investing & Trading Score from previous trading session is 38 and an improvement of trend continues.
| ||||||||
Here are the Smart Investing & Trading Scores of the most requested Healthcare stocks at 12Stocks.com (click stock name for detailed review):
|


| 12Stocks.com: Investing in Healthcare sector with Stocks | |
|
The following table helps investors and traders sort through current performance and trends (as measured by Smart Investing & Trading Score) of various
stocks in the Healthcare sector. Quick View: Move mouse or cursor over stock symbol (ticker) to view short-term Technical chart and over stock name to view long term chart. Click on  to add stock symbol to your watchlist and to add stock symbol to your watchlist and  to view watchlist. Click on any ticker or stock name for detailed market intelligence report for that stock. to view watchlist. Click on any ticker or stock name for detailed market intelligence report for that stock. |
12Stocks.com Performance of Stocks in Healthcare Sector
| Ticker | Stock Name | Watchlist | Category | Recent Price | Smart Investing & Trading Score | Change % | Weekly Change% |
| MTEM | Molecular Templates |   | Biotechnology | 1.64 | 27 | 5.81% | 12.71% |
| GH | Guardant Health | | Laboratories | 18.10 | 30 | 4.38% | 12.56% |
| SYRS | Syros | | Biotechnology | 5.07 | 57 | -1.36% | 11.67% |
| HCM | Hutchison China | | Pharmaceutical | 18.41 | 85 | 0.88% | 11.64% |
| AMRX | Amneal | | Pharmaceutical | 6.05 | 37 | 12.04% | 11.62% |
| OM | Outset | | Medical Devices | 2.55 | 74 | 3.66% | 11.60% |
| ACB | Aurora Cannabis | | Pharmaceutical | 7.20 | 73 | -2.96% | 11.46% |
| BLTE | Belite Bio | | Biotechnology | 37.23 | 35 | -0.19% | 11.37% |
| NKTR | Nektar | | Biotechnology | 1.38 | 85 | -2.82% | 11.29% |
| NAMS | NewAmsterdam Pharma | | Biotechnology | 22.18 | 85 | 3.16% | 11.29% |
| BGNE | BeiGene | | Biotechnology | 144.12 | 49 | 3.69% | 11.27% |
| ZLAB | Zai Lab | | Biotechnology | 15.66 | 29 | 3.57% | 11.22% |
| PEPG | PepGen | | Biotechnology | 11.70 | 68 | -0.43% | 11.06% |
| ADAP | Adaptimmune | | Biotechnology | 1.08 | 63 | -5.26% | 10.58% |
| IGMS | IGM Biosciences | | Biotechnology | 7.96 | 22 | 3.38% | 10.56% |
| PRTC | PureTech Health | | Biotechnology | 28.91 | 100 | 0.00% | 10.55% |
| IBIO | iBio | | Biotechnology | 1.90 | 68 | 0.00% | 10.47% |
| EQ | Equillium | | Biotechnology | 1.80 | 58 | 4.65% | 10.43% |
| LYEL | Lyell Immunopharma | | Biotechnology | 2.46 | 76 | 0.41% | 10.31% |
| TWST | Twist Bioscience | | Laboratories | 30.75 | 27 | -2.38% | 10.14% |
| PHVS | Pharvaris N.V | | Biotechnology | 21.10 | 35 | -2.76% | 10.13% |
| SGHT | Sight Sciences | | Medical Devices | 5.64 | 81 | 0.00% | 9.94% |
| GRTS | Gritstone Oncology | | Biotechnology | 0.81 | 25 | 10.06% | 9.64% |
| PRLD | Prelude | | Biotechnology | 3.91 | 63 | 1.03% | 9.52% |
| RNA | Avidity Biosciences | | Biotechnology | 25.11 | 90 | -0.14% | 9.49% |
| For chart view version of above stock list: Chart View ➞ 0 - 25 , 25 - 50 , 50 - 75 , 75 - 100 , 100 - 125 , 125 - 150 , 150 - 175 , 175 - 200 , 200 - 225 , 225 - 250 , 250 - 275 , 275 - 300 , 300 - 325 , 325 - 350 , 350 - 375 , 375 - 400 , 400 - 425 , 425 - 450 , 450 - 475 , 475 - 500 , 500 - 525 , 525 - 550 , 550 - 575 , 575 - 600 , 600 - 625 , 625 - 650 , 650 - 675 , 675 - 700 , 700 - 725 | ||
 | Click To Change The Sort Order: By Market Cap or Company Size Performance: Year-to-date, Week and Day |  |
|
Get the most comprehensive stock market coverage daily at 12Stocks.com ➞ Best Stocks Today ➞ Best Stocks Weekly ➞ Best Stocks Year-to-Date ➞ Best Stocks Trends ➞  Best Stocks Today 12Stocks.com Best Nasdaq Stocks ➞ Best S&P 500 Stocks ➞ Best Tech Stocks ➞ Best Biotech Stocks ➞ |
| Detailed Overview of Healthcare Stocks |
| Healthcare Technical Overview, Leaders & Laggards, Top Healthcare ETF Funds & Detailed Healthcare Stocks List, Charts, Trends & More |
| Healthcare Sector: Technical Analysis, Trends & YTD Performance | |
| Healthcare sector is composed of stocks
from pharmaceutical, biotech, diagnostics labs, insurance providers
and healthcare services. Healthcare sector, as represented by XLV, an exchange-traded fund [ETF] that holds basket of Healthcare stocks (e.g, Merck, Amgen) is up by 3.28% and is currently underperforming the overall market by -2.38% year-to-date. Below is a quick view of Technical charts and trends: |
|
 XLV Weekly Chart |
|
| Long Term Trend: Good | |
| Medium Term Trend: Not Good | |
 XLV Daily Chart |
|
| Short Term Trend: Very Good | |
| Overall Trend Score: 52 | |
| YTD Performance: 3.28% | |
| **Trend Scores & Views Are Only For Educational Purposes And Not For Investing | |
| 12Stocks.com: Top Performing Healthcare Sector Stocks | ||||||||||||||||||||||||||||||||||||||||||||||||
 The top performing Healthcare sector stocks year to date are
Now, more recently, over last week, the top performing Healthcare sector stocks on the move are


|
||||||||||||||||||||||||||||||||||||||||||||||||
| 12Stocks.com: Investing in Healthcare Sector using Exchange Traded Funds | |
|
The following table shows list of key exchange traded funds (ETF) that
help investors track Healthcare Index. For detailed view, check out our ETF Funds section of our website. Quick View: Move mouse or cursor over ETF symbol (ticker) to view short-term Technical chart and over ETF name to view long term chart. Click on ticker or stock name for detailed view. Click on to add stock symbol to your watchlist and to view watchlist. |
12Stocks.com List of ETFs that track Healthcare Index
| Ticker | ETF Name | Watchlist | Recent Price | Smart Investing & Trading Score | Change % | Week % | Year-to-date % |
| XLV | Health Care | | 140.86 | 52 | -0.31 | 1.37 | 3.28% |
| XBI | Biotech | | 83.94 | 25 | -0.89 | 1.34 | -5.99% |
| IBB | Biotechnology | | 127.76 | 32 | -0.20 | 2.44 | -5.96% |
| BBH | Biotech | | 157.33 | 49 | 0.03 | 3.26 | -4.83% |
| VHT | Health Care | | 257.26 | 45 | -0.22 | 1.55 | 2.62% |
| IYH | Healthcare | | 59.09 | 45 | -0.20 | 1.6 | 3.22% |
| IHF | Healthcare Providers | | 52.26 | 55 | -0.11 | 0.1 | -0.48% |
| IHI | Medical Devices | | 55.64 | 50 | 0.23 | 2.35 | 3.09% |
| BIB | Biotechnology | | 50.18 | 32 | -0.30 | 4.11 | -12.04% |
| BIS | Short Biotech | | 20.09 | 61 | 0.75 | -3.85 | 11.18% |
| XHE | Health Care Equipment | | 83.21 | 35 | 0.24 | 2.39 | -1.25% |
| CURE | Healthcare Bull 3X | | 107.85 | 32 | -0.25 | 4.37 | 6.01% |
| LABU | Biotech Bull 3X | | 89.40 | 25 | -2.80 | 3.89 | -26.7% |
| LABD | Biotech Bear 3X | | 10.37 | 75 | 2.98 | -3.98 | 7.02% |
| PSCH | SmallCap Health Care | | 41.12 | 41 | -0.23 | 2.35 | -3.92% |
| XHS | Health Care Services | | 88.70 | 53 | -0.06 | 1.85 | -0.28% |
| PTH | DWA Healthcare Momentum | | 39.63 | 46 | -1.34 | 0.25 | 1.25% |
| BTEC | Principal Healthcare Innovators | | 34.20 | 18 | -1.73 | 1.02 | -5.85% |
| RXL | Health Care | | 96.00 | 45 | -0.15 | 2.99 | 5.03% |
| RXD | Short Health Care | | 11.34 | 45 | 0.88 | -2.54 | -4.87% |
| 12Stocks.com: Charts, Trends, Fundamental Data and Performances of Healthcare Stocks | |
|
We now take in-depth look at all Healthcare stocks including charts, multi-period performances and overall trends (as measured by Smart Investing & Trading Score). One can sort Healthcare stocks (click link to choose) by Daily, Weekly and by Year-to-Date performances. Also, one can sort by size of the company or by market capitalization. |
| Select Your Default Chart Type: | |||||
| |||||
| Click on stock symbol or name for detailed view. Click on to add stock symbol to your watchlist and to view watchlist. Quick View: Move mouse or cursor over "Daily" to quickly view daily Technical stock chart and over "Weekly" to view weekly Technical stock chart. | |||||

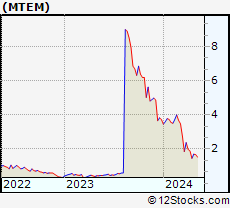 | MTEM Molecular Templates, Inc. |
| Sector: Health Care | |
| SubSector: Biotechnology | |
| MarketCap: 662.785 Millions | |
| Recent Price: 1.64 Smart Investing & Trading Score: 27 | |
| Day Percent Change: 5.81% Day Change: 0.09 | |
| Week Change: 12.71% Year-to-date Change: -56.0% | |
| MTEM Links: Profile News Message Board | |
| Charts:- Daily , Weekly | |
| Add MTEM to Watchlist: View: Get Complete MTEM Trend Analysis ➞ | |
 | GH Guardant Health, Inc. |
| Sector: Health Care | |
| SubSector: Medical Laboratories & Research | |
| MarketCap: 5678.7 Millions | |
| Recent Price: 18.10 Smart Investing & Trading Score: 30 | |
| Day Percent Change: 4.38% Day Change: 0.76 | |
| Week Change: 12.56% Year-to-date Change: -33.1% | |
| GH Links: Profile News Message Board | |
| Charts:- Daily , Weekly | |
| Add GH to Watchlist: View: Get Complete GH Trend Analysis ➞ | |
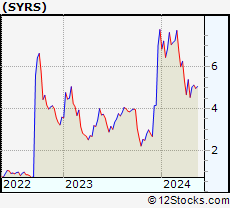 | SYRS Syros Pharmaceuticals, Inc. |
| Sector: Health Care | |
| SubSector: Biotechnology | |
| MarketCap: 275.485 Millions | |
| Recent Price: 5.07 Smart Investing & Trading Score: 57 | |
| Day Percent Change: -1.36% Day Change: -0.07 | |
| Week Change: 11.67% Year-to-date Change: -34.9% | |
| SYRS Links: Profile News Message Board | |
| Charts:- Daily , Weekly | |
| Add SYRS to Watchlist: View: Get Complete SYRS Trend Analysis ➞ | |
 | HCM Hutchison China MediTech Limited |
| Sector: Health Care | |
| SubSector: Drug Manufacturers - Major | |
| MarketCap: 2324.43 Millions | |
| Recent Price: 18.41 Smart Investing & Trading Score: 85 | |
| Day Percent Change: 0.88% Day Change: 0.16 | |
| Week Change: 11.64% Year-to-date Change: 1.7% | |
| HCM Links: Profile News Message Board | |
| Charts:- Daily , Weekly | |
| Add HCM to Watchlist: View: Get Complete HCM Trend Analysis ➞ | |
 | AMRX Amneal Pharmaceuticals, Inc. |
| Sector: Health Care | |
| SubSector: Drug Related Products | |
| MarketCap: 1218.13 Millions | |
| Recent Price: 6.05 Smart Investing & Trading Score: 37 | |
| Day Percent Change: 12.04% Day Change: 0.65 | |
| Week Change: 11.62% Year-to-date Change: -0.3% | |
| AMRX Links: Profile News Message Board | |
| Charts:- Daily , Weekly | |
| Add AMRX to Watchlist: View: Get Complete AMRX Trend Analysis ➞ | |
 | OM Outset Medical, Inc. |
| Sector: Health Care | |
| SubSector: Medical Devices | |
| MarketCap: 21787 Millions | |
| Recent Price: 2.55 Smart Investing & Trading Score: 74 | |
| Day Percent Change: 3.66% Day Change: 0.09 | |
| Week Change: 11.6% Year-to-date Change: -52.9% | |
| OM Links: Profile News Message Board | |
| Charts:- Daily , Weekly | |
| Add OM to Watchlist: View: Get Complete OM Trend Analysis ➞ | |
 | ACB Aurora Cannabis Inc. |
| Sector: Health Care | |
| SubSector: Drug Manufacturers - Other | |
| MarketCap: 853.333 Millions | |
| Recent Price: 7.20 Smart Investing & Trading Score: 73 | |
| Day Percent Change: -2.96% Day Change: -0.22 | |
| Week Change: 11.46% Year-to-date Change: 1,412.0% | |
| ACB Links: Profile News Message Board | |
| Charts:- Daily , Weekly | |
| Add ACB to Watchlist: View: Get Complete ACB Trend Analysis ➞ | |
 | BLTE Belite Bio, Inc |
| Sector: Health Care | |
| SubSector: Biotechnology | |
| MarketCap: 404 Millions | |
| Recent Price: 37.23 Smart Investing & Trading Score: 35 | |
| Day Percent Change: -0.19% Day Change: -0.07 | |
| Week Change: 11.37% Year-to-date Change: -18.3% | |
| BLTE Links: Profile News Message Board | |
| Charts:- Daily , Weekly | |
| Add BLTE to Watchlist: View: Get Complete BLTE Trend Analysis ➞ | |
 | NKTR Nektar Therapeutics |
| Sector: Health Care | |
| SubSector: Biotechnology | |
| MarketCap: 2953.45 Millions | |
| Recent Price: 1.38 Smart Investing & Trading Score: 85 | |
| Day Percent Change: -2.82% Day Change: -0.04 | |
| Week Change: 11.29% Year-to-date Change: 144.3% | |
| NKTR Links: Profile News Message Board | |
| Charts:- Daily , Weekly | |
| Add NKTR to Watchlist: View: Get Complete NKTR Trend Analysis ➞ | |
 | NAMS NewAmsterdam Pharma Company N.V. |
| Sector: Health Care | |
| SubSector: Biotechnology | |
| MarketCap: 979 Millions | |
| Recent Price: 22.18 Smart Investing & Trading Score: 85 | |
| Day Percent Change: 3.16% Day Change: 0.68 | |
| Week Change: 11.29% Year-to-date Change: 97.3% | |
| NAMS Links: Profile News Message Board | |
| Charts:- Daily , Weekly | |
| Add NAMS to Watchlist: View: Get Complete NAMS Trend Analysis ➞ | |
 | BGNE BeiGene, Ltd. |
| Sector: Health Care | |
| SubSector: Biotechnology | |
| MarketCap: 10838.5 Millions | |
| Recent Price: 144.12 Smart Investing & Trading Score: 49 | |
| Day Percent Change: 3.69% Day Change: 5.13 | |
| Week Change: 11.27% Year-to-date Change: -20.1% | |
| BGNE Links: Profile News Message Board | |
| Charts:- Daily , Weekly | |
| Add BGNE to Watchlist: View: Get Complete BGNE Trend Analysis ➞ | |
 | ZLAB Zai Lab Limited |
| Sector: Health Care | |
| SubSector: Biotechnology | |
| MarketCap: 3970.35 Millions | |
| Recent Price: 15.66 Smart Investing & Trading Score: 29 | |
| Day Percent Change: 3.57% Day Change: 0.54 | |
| Week Change: 11.22% Year-to-date Change: -42.7% | |
| ZLAB Links: Profile News Message Board | |
| Charts:- Daily , Weekly | |
| Add ZLAB to Watchlist: View: Get Complete ZLAB Trend Analysis ➞ | |
 | PEPG PepGen Inc. |
| Sector: Health Care | |
| SubSector: Biotechnology | |
| MarketCap: 216 Millions | |
| Recent Price: 11.70 Smart Investing & Trading Score: 68 | |
| Day Percent Change: -0.43% Day Change: -0.05 | |
| Week Change: 11.06% Year-to-date Change: 71.1% | |
| PEPG Links: Profile News Message Board | |
| Charts:- Daily , Weekly | |
| Add PEPG to Watchlist: View: Get Complete PEPG Trend Analysis ➞ | |
 | ADAP Adaptimmune Therapeutics plc |
| Sector: Health Care | |
| SubSector: Biotechnology | |
| MarketCap: 380.985 Millions | |
| Recent Price: 1.08 Smart Investing & Trading Score: 63 | |
| Day Percent Change: -5.26% Day Change: -0.06 | |
| Week Change: 10.58% Year-to-date Change: 36.2% | |
| ADAP Links: Profile News Message Board | |
| Charts:- Daily , Weekly | |
| Add ADAP to Watchlist: View: Get Complete ADAP Trend Analysis ➞ | |
 | IGMS IGM Biosciences, Inc. |
| Sector: Health Care | |
| SubSector: Biotechnology | |
| MarketCap: 2000.05 Millions | |
| Recent Price: 7.96 Smart Investing & Trading Score: 22 | |
| Day Percent Change: 3.38% Day Change: 0.26 | |
| Week Change: 10.56% Year-to-date Change: -4.2% | |
| IGMS Links: Profile News Message Board | |
| Charts:- Daily , Weekly | |
| Add IGMS to Watchlist: View: Get Complete IGMS Trend Analysis ➞ | |
 | PRTC PureTech Health plc |
| Sector: Health Care | |
| SubSector: Biotechnology | |
| MarketCap: 819 Millions | |
| Recent Price: 28.91 Smart Investing & Trading Score: 100 | |
| Day Percent Change: 0.00% Day Change: 0.00 | |
| Week Change: 10.55% Year-to-date Change: 20.9% | |
| PRTC Links: Profile News Message Board | |
| Charts:- Daily , Weekly | |
| Add PRTC to Watchlist: View: Get Complete PRTC Trend Analysis ➞ | |
 | IBIO iBio, Inc. |
| Sector: Health Care | |
| SubSector: Biotechnology | |
| MarketCap: 110.885 Millions | |
| Recent Price: 1.90 Smart Investing & Trading Score: 68 | |
| Day Percent Change: 0.00% Day Change: 0.00 | |
| Week Change: 10.47% Year-to-date Change: 38.7% | |
| IBIO Links: Profile News Message Board | |
| Charts:- Daily , Weekly | |
| Add IBIO to Watchlist: View: Get Complete IBIO Trend Analysis ➞ | |
 | EQ Equillium, Inc. |
| Sector: Health Care | |
| SubSector: Biotechnology | |
| MarketCap: 56.4785 Millions | |
| Recent Price: 1.80 Smart Investing & Trading Score: 58 | |
| Day Percent Change: 4.65% Day Change: 0.08 | |
| Week Change: 10.43% Year-to-date Change: 146.6% | |
| EQ Links: Profile News Message Board | |
| Charts:- Daily , Weekly | |
| Add EQ to Watchlist: View: Get Complete EQ Trend Analysis ➞ | |
 | LYEL Lyell Immunopharma, Inc. |
| Sector: Health Care | |
| SubSector: Biotechnology | |
| MarketCap: 809 Millions | |
| Recent Price: 2.46 Smart Investing & Trading Score: 76 | |
| Day Percent Change: 0.41% Day Change: 0.01 | |
| Week Change: 10.31% Year-to-date Change: 25.2% | |
| LYEL Links: Profile News Message Board | |
| Charts:- Daily , Weekly | |
| Add LYEL to Watchlist: View: Get Complete LYEL Trend Analysis ➞ | |
 | TWST Twist Bioscience Corporation |
| Sector: Health Care | |
| SubSector: Medical Laboratories & Research | |
| MarketCap: 1065 Millions | |
| Recent Price: 30.75 Smart Investing & Trading Score: 27 | |
| Day Percent Change: -2.38% Day Change: -0.75 | |
| Week Change: 10.14% Year-to-date Change: -16.6% | |
| TWST Links: Profile News Message Board | |
| Charts:- Daily , Weekly | |
| Add TWST to Watchlist: View: Get Complete TWST Trend Analysis ➞ | |
 | PHVS Pharvaris N.V. |
| Sector: Health Care | |
| SubSector: Biotechnology | |
| MarketCap: 475 Millions | |
| Recent Price: 21.10 Smart Investing & Trading Score: 35 | |
| Day Percent Change: -2.76% Day Change: -0.60 | |
| Week Change: 10.13% Year-to-date Change: -25.5% | |
| PHVS Links: Profile News Message Board | |
| Charts:- Daily , Weekly | |
| Add PHVS to Watchlist: View: Get Complete PHVS Trend Analysis ➞ | |
 | SGHT Sight Sciences, Inc. |
| Sector: Health Care | |
| SubSector: Medical Devices | |
| MarketCap: 381 Millions | |
| Recent Price: 5.64 Smart Investing & Trading Score: 81 | |
| Day Percent Change: 0.00% Day Change: 0.00 | |
| Week Change: 9.94% Year-to-date Change: 9.2% | |
| SGHT Links: Profile News Message Board | |
| Charts:- Daily , Weekly | |
| Add SGHT to Watchlist: View: Get Complete SGHT Trend Analysis ➞ | |
 | GRTS Gritstone Oncology, Inc. |
| Sector: Health Care | |
| SubSector: Biotechnology | |
| MarketCap: 240.085 Millions | |
| Recent Price: 0.81 Smart Investing & Trading Score: 25 | |
| Day Percent Change: 10.06% Day Change: 0.07 | |
| Week Change: 9.64% Year-to-date Change: -60.2% | |
| GRTS Links: Profile News Message Board | |
| Charts:- Daily , Weekly | |
| Add GRTS to Watchlist: View: Get Complete GRTS Trend Analysis ➞ | |
 | PRLD Prelude Therapeutics Incorporated |
| Sector: Health Care | |
| SubSector: Biotechnology | |
| MarketCap: 26087 Millions | |
| Recent Price: 3.91 Smart Investing & Trading Score: 63 | |
| Day Percent Change: 1.03% Day Change: 0.04 | |
| Week Change: 9.52% Year-to-date Change: -10.1% | |
| PRLD Links: Profile News Message Board | |
| Charts:- Daily , Weekly | |
| Add PRLD to Watchlist: View: Get Complete PRLD Trend Analysis ➞ | |
 | RNA Avidity Biosciences, Inc. |
| Sector: Health Care | |
| SubSector: Biotechnology | |
| MarketCap: 12287 Millions | |
| Recent Price: 25.11 Smart Investing & Trading Score: 90 | |
| Day Percent Change: -0.14% Day Change: -0.04 | |
| Week Change: 9.49% Year-to-date Change: 177.7% | |
| RNA Links: Profile News Message Board | |
| Charts:- Daily , Weekly | |
| Add RNA to Watchlist: View: Get Complete RNA Trend Analysis ➞ | |
| For tabular summary view of above stock list: Summary View ➞ 0 - 25 , 25 - 50 , 50 - 75 , 75 - 100 , 100 - 125 , 125 - 150 , 150 - 175 , 175 - 200 , 200 - 225 , 225 - 250 , 250 - 275 , 275 - 300 , 300 - 325 , 325 - 350 , 350 - 375 , 375 - 400 , 400 - 425 , 425 - 450 , 450 - 475 , 475 - 500 , 500 - 525 , 525 - 550 , 550 - 575 , 575 - 600 , 600 - 625 , 625 - 650 , 650 - 675 , 675 - 700 , 700 - 725 | ||
| Click To Change The Sort Order: By Market Cap or Company Size Performance: Year-to-date, Week and Day | |
| Select Chart Type: | ||
|
Best Stocks Today 12Stocks.com |
© 2024 12Stocks.com Terms & Conditions Privacy Contact Us
All Information Provided Only For Education And Not To Be Used For Investing or Trading. See Terms & Conditions


One More Thing ... Get Best Stocks Delivered Daily!
Never Ever Miss A Move With Our Top Ten Stocks Lists
Find Best Stocks In Any Market - Bull or Bear Market
Take A Peek At Our Top Ten Stocks Lists: Daily, Weekly, Year-to-Date & Top Trends
Find Best Stocks In Any Market - Bull or Bear Market
Take A Peek At Our Top Ten Stocks Lists: Daily, Weekly, Year-to-Date & Top Trends
Healthcare Stocks With Best Up Trends [0-bearish to 100-bullish]: Annovis Bio[100], Boston Scientific[100], Integer [100], Haemonetics [100], Quest Diagnostics[100], AstraZeneca [100], Oscar Health[100], PureTech Health[100], Glaukos [100], Agios [100], Pieris [100]
Best Healthcare Stocks Year-to-Date:
Pieris [6427.47%], Precision BioSciences[2590.41%], Inovio [1892.16%], Assembly Biosciences[1543.7%], Aurora Cannabis[1411.97%], Adverum Biotechnologies[1253.61%], NuCana [1198.17%], Agenus [796.24%], Affimed N.V[680.8%], CareMax [574.23%], Corbus [488.41%] Best Healthcare Stocks This Week:
Pieris [8093.1%], Aesthetic [53.58%], Agenus [39.74%], BeyondSpring [35%], Seres [30.29%], VolitionRx [29.87%], Annovis Bio[27.4%], CareMax [27.24%], ProKidney [23.28%], GeneDx [22.61%], Cullinan Oncology[20.69%] Best Healthcare Stocks Daily:
Aesthetic [44.75%], Agenus [14.86%], Apyx [13.64%], Cullinan Oncology[13.55%], Amneal [12.04%], HOOKIPA Pharma[11.11%], Gritstone Oncology[10.06%], DURECT [9.75%], Sage [8.11%], Relay [7.46%], Annovis Bio[7.24%]