
 Login Sign Up


| |||||
 |  | ||||

| 12Stocks.com Market Intelligence |
Best Healthcare Stocks
 | "Discover best trending healthcare stocks with 12Stocks.com." |
| - Subu Vdaygiri, Founder, 12Stocks.com |
| In a hurry? Healthcare Stocks Lists: Performance Trends Table, Stock Charts
Sort Healthcare stocks: Daily, Weekly, Year-to-Date, Market Cap & Trends. Filter Healthcare stocks list by size:All Healthcare Large Mid-Range Small |
| 12Stocks.com Healthcare Stocks Performances & Trends Daily | |||||||||
|
|  The overall Smart Investing & Trading Score is 64 (0-bearish to 100-bullish) which puts Healthcare sector in short term neutral to bullish trend. The Smart Investing & Trading Score from previous trading session is 57 and hence an improvement of trend.
| ||||||||
Here are the Smart Investing & Trading Scores of the most requested Healthcare stocks at 12Stocks.com (click stock name for detailed review):
|


| 12Stocks.com: Investing in Healthcare sector with Stocks | |
|
The following table helps investors and traders sort through current performance and trends (as measured by Smart Investing & Trading Score) of various
stocks in the Healthcare sector. Quick View: Move mouse or cursor over stock symbol (ticker) to view short-term Technical chart and over stock name to view long term chart. Click on  to add stock symbol to your watchlist and to add stock symbol to your watchlist and  to view watchlist. Click on any ticker or stock name for detailed market intelligence report for that stock. to view watchlist. Click on any ticker or stock name for detailed market intelligence report for that stock. |
12Stocks.com Performance of Stocks in Healthcare Sector
| Ticker | Stock Name | Watchlist | Category | Recent Price | Smart Investing & Trading Score | Change % | Weekly Change% |
| VERA | Vera |   | Biotechnology | 45.00 | 62 | -1.17% | 0.42% |
| CIVI | Civitas | | Long-Term | 75.81 | 29 | 0.60% | 0.41% |
| YMAB | Y-mAbs | | Biotechnology | 17.22 | 83 | -0.12% | 0.41% |
| RGEN | Repligen | | Biotechnology | 167.72 | 57 | -0.19% | 0.40% |
| SYRS | Syros | | Biotechnology | 5.15 | 39 | 1.38% | 0.39% |
| AUPH | Aurinia | | Biotechnology | 5.12 | 57 | -0.78% | 0.39% |
| ZIMV | ZimVie | | Medical Devices | 16.05 | 57 | 1.45% | 0.38% |
| USPH | U.S. Physical | | Specialized | 105.59 | 75 | -0.59% | 0.37% |
| FDMT | 4D Molecular | | Biotechnology | 26.80 | 59 | 0.15% | 0.37% |
| HLN | Haleon | | Drug Manufacturers - Specialty & Generic | 8.33 | 25 | 1.09% | 0.36% |
| CCM | Concord | | Hospitals | 0.63 | 61 | 8.98% | 0.33% |
| NATR | Nature s | | Pharmaceutical | 19.12 | 26 | 0.10% | 0.31% |
| AMED | Amedisys | | Home Care | 92.36 | 70 | 0.02% | 0.30% |
| GALT | Galectin | | Biotechnology | 3.35 | 46 | -3.46% | 0.30% |
| KRYS | Krystal Biotech | | Biotechnology | 161.59 | 78 | 2.96% | 0.30% |
| SDGR | Schrodinger | | Health Information | 23.75 | 42 | -1.25% | 0.30% |
| MOR | MorphoSys AG | | Biotechnology | 17.94 | 63 | -0.22% | 0.28% |
| CERT | Certara | | Biotechnology | 17.66 | 86 | 1.96% | 0.28% |
| MIRM | Mirum | | Biotechnology | 25.91 | 47 | -1.89% | 0.27% |
| MDT | Medtronic | | Equipment | 81.90 | 64 | 0.17% | 0.26% |
| ABT | Abbott | | Equipment | 106.17 | 35 | 0.50% | 0.25% |
| ALDX | Aldeyra | | Biotechnology | 4.17 | 74 | 1.21% | 0.24% |
| TECH | Bio-Techne | | Biotechnology | 77.46 | 88 | 1.84% | 0.22% |
| SPRY | ARS | | Biotechnology | 9.47 | 76 | 0.00% | 0.21% |
| CELC | Celcuity | | Laboratories | 17.70 | 73 | -0.51% | 0.20% |
| For chart view version of above stock list: Chart View ➞ 0 - 25 , 25 - 50 , 50 - 75 , 75 - 100 , 100 - 125 , 125 - 150 , 150 - 175 , 175 - 200 , 200 - 225 , 225 - 250 , 250 - 275 , 275 - 300 , 300 - 325 , 325 - 350 , 350 - 375 , 375 - 400 , 400 - 425 , 425 - 450 , 450 - 475 , 475 - 500 , 500 - 525 , 525 - 550 , 550 - 575 , 575 - 600 , 600 - 625 , 625 - 650 , 650 - 675 , 675 - 700 , 700 - 725 | ||
 | Click To Change The Sort Order: By Market Cap or Company Size Performance: Year-to-date, Week and Day |  |
|
Get the most comprehensive stock market coverage daily at 12Stocks.com ➞ Best Stocks Today ➞ Best Stocks Weekly ➞ Best Stocks Year-to-Date ➞ Best Stocks Trends ➞  Best Stocks Today 12Stocks.com Best Nasdaq Stocks ➞ Best S&P 500 Stocks ➞ Best Tech Stocks ➞ Best Biotech Stocks ➞ |
| Detailed Overview of Healthcare Stocks |
| Healthcare Technical Overview, Leaders & Laggards, Top Healthcare ETF Funds & Detailed Healthcare Stocks List, Charts, Trends & More |
| Healthcare Sector: Technical Analysis, Trends & YTD Performance | |
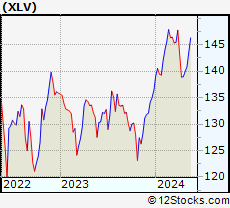
| Healthcare sector is composed of stocks
from pharmaceutical, biotech, diagnostics labs, insurance providers
and healthcare services. Healthcare sector, as represented by XLV, an exchange-traded fund [ETF] that holds basket of Healthcare stocks (e.g, Merck, Amgen) is up by 4.54% and is currently underperforming the overall market by -3.58% year-to-date. Below is a quick view of Technical charts and trends: |
|
 XLV Weekly Chart |
|
| Long Term Trend: Not Good | |
| Medium Term Trend: Very Good | |
 XLV Daily Chart |
|
| Short Term Trend: Very Good | |
| Overall Trend Score: 64 | |
| YTD Performance: 4.54% | |
| **Trend Scores & Views Are Only For Educational Purposes And Not For Investing | |
| 12Stocks.com: Top Performing Healthcare Sector Stocks | ||||||||||||||||||||||||||||||||||||||||||||||||
 The top performing Healthcare sector stocks year to date are
Now, more recently, over last week, the top performing Healthcare sector stocks on the move are


|
||||||||||||||||||||||||||||||||||||||||||||||||
| 12Stocks.com: Investing in Healthcare Sector using Exchange Traded Funds | |
|
The following table shows list of key exchange traded funds (ETF) that
help investors track Healthcare Index. For detailed view, check out our ETF Funds section of our website. Quick View: Move mouse or cursor over ETF symbol (ticker) to view short-term Technical chart and over ETF name to view long term chart. Click on ticker or stock name for detailed view. Click on to add stock symbol to your watchlist and to view watchlist. |
12Stocks.com List of ETFs that track Healthcare Index
| Ticker | ETF Name | Watchlist | Recent Price | Smart Investing & Trading Score | Change % | Week % | Year-to-date % |
| XLV | Health Care | | 142.57 | 64 | 0.83 | 1.24 | 4.54% |
| XBI | Biotech | | 90.43 | 57 | -0.17 | 0.5 | 1.28% |
| IBB | Biotechnology | | 133.28 | 62 | 0.20 | 0.24 | -1.89% |
| BBH | Biotech | | 163.85 | 75 | 0.04 | -0.18 | -0.88% |
| VHT | Health Care | | 261.06 | 64 | 0.73 | 1.18 | 4.13% |
| IYH | Healthcare | | 60.00 | 64 | 0.79 | 1.25 | 4.81% |
| IHF | Healthcare Providers | | 52.51 | 67 | 1.04 | 1.59 | 0% |
| IHI | Medical Devices | | 55.93 | 64 | 0.90 | 0.79 | 3.63% |
| BIB | Biotechnology | | 55.60 | 55 | 0.42 | -0.05 | -2.54% |
| BIS | Short Biotech | | 18.00 | 53 | -1.21 | 0.06 | -0.39% |
| XHE | Health Care Equipment | | 86.84 | 100 | 0.82 | 0.99 | 3.06% |
| CURE | Healthcare Bull 3X | | 110.75 | 64 | 2.54 | 3.61 | 8.86% |
| LABU | Biotech Bull 3X | | 110.25 | 52 | -0.33 | 1.16 | -9.61% |
| LABD | Biotech Bear 3X | | 8.16 | 46 | 0.25 | -1.45 | -15.79% |
| PSCH | SmallCap Health Care | | 42.63 | 82 | 0.13 | 0.47 | -0.4% |
| XHS | Health Care Services | | 90.13 | 87 | 0.91 | 1.81 | 1.33% |
| PTH | DWA Healthcare Momentum | | 42.12 | 62 | 0.48 | 0.17 | 7.61% |
| BTEC | Principal Healthcare Innovators | | 37.07 | 74 | 0.03 | 0.27 | 2.04% |
| RXL | Health Care | | 97.43 | 64 | 1.52 | 1.86 | 6.59% |
| RXD | Short Health Care | | 11.12 | 26 | -1.68 | -1.46 | -6.75% |
| 12Stocks.com: Charts, Trends, Fundamental Data and Performances of Healthcare Stocks | |
|
We now take in-depth look at all Healthcare stocks including charts, multi-period performances and overall trends (as measured by Smart Investing & Trading Score). One can sort Healthcare stocks (click link to choose) by Daily, Weekly and by Year-to-Date performances. Also, one can sort by size of the company or by market capitalization. |
| Select Your Default Chart Type: | |||||
| |||||
| Click on stock symbol or name for detailed view. Click on to add stock symbol to your watchlist and to view watchlist. Quick View: Move mouse or cursor over "Daily" to quickly view daily Technical stock chart and over "Weekly" to view weekly Technical stock chart. | |||||

 | VERA Vera Therapeutics, Inc. |
| Sector: Health Care | |
| SubSector: Biotechnology | |
| MarketCap: 746 Millions | |
| Recent Price: 45.00 Smart Investing & Trading Score: 62 | |
| Day Percent Change: -1.17% Day Change: -0.53 | |
| Week Change: 0.42% Year-to-date Change: 190.7% | |
| VERA Links: Profile News Message Board | |
| Charts:- Daily , Weekly | |
| Add VERA to Watchlist: View: Get Complete VERA Trend Analysis ➞ | |
 | CIVI Civitas Solutions, Inc. |
| Sector: Health Care | |
| SubSector: Long-Term Care Facilities | |
| MarketCap: 625.74 Millions | |
| Recent Price: 75.81 Smart Investing & Trading Score: 29 | |
| Day Percent Change: 0.60% Day Change: 0.45 | |
| Week Change: 0.41% Year-to-date Change: 10.9% | |
| CIVI Links: Profile News Message Board | |
| Charts:- Daily , Weekly | |
| Add CIVI to Watchlist: View: Get Complete CIVI Trend Analysis ➞ | |
 | YMAB Y-mAbs Therapeutics, Inc. |
| Sector: Health Care | |
| SubSector: Biotechnology | |
| MarketCap: 899.585 Millions | |
| Recent Price: 17.22 Smart Investing & Trading Score: 83 | |
| Day Percent Change: -0.12% Day Change: -0.02 | |
| Week Change: 0.41% Year-to-date Change: 152.5% | |
| YMAB Links: Profile News Message Board | |
| Charts:- Daily , Weekly | |
| Add YMAB to Watchlist: View: Get Complete YMAB Trend Analysis ➞ | |
 | RGEN Repligen Corporation |
| Sector: Health Care | |
| SubSector: Biotechnology | |
| MarketCap: 4711.75 Millions | |
| Recent Price: 167.72 Smart Investing & Trading Score: 57 | |
| Day Percent Change: -0.19% Day Change: -0.32 | |
| Week Change: 0.4% Year-to-date Change: -6.7% | |
| RGEN Links: Profile News Message Board | |
| Charts:- Daily , Weekly | |
| Add RGEN to Watchlist: View: Get Complete RGEN Trend Analysis ➞ | |
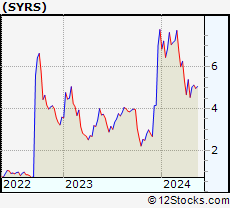 | SYRS Syros Pharmaceuticals, Inc. |
| Sector: Health Care | |
| SubSector: Biotechnology | |
| MarketCap: 275.485 Millions | |
| Recent Price: 5.15 Smart Investing & Trading Score: 39 | |
| Day Percent Change: 1.38% Day Change: 0.07 | |
| Week Change: 0.39% Year-to-date Change: -33.9% | |
| SYRS Links: Profile News Message Board | |
| Charts:- Daily , Weekly | |
| Add SYRS to Watchlist: View: Get Complete SYRS Trend Analysis ➞ | |
 | AUPH Aurinia Pharmaceuticals Inc. |
| Sector: Health Care | |
| SubSector: Biotechnology | |
| MarketCap: 1319.75 Millions | |
| Recent Price: 5.12 Smart Investing & Trading Score: 57 | |
| Day Percent Change: -0.78% Day Change: -0.04 | |
| Week Change: 0.39% Year-to-date Change: -43.1% | |
| AUPH Links: Profile News Message Board | |
| Charts:- Daily , Weekly | |
| Add AUPH to Watchlist: View: Get Complete AUPH Trend Analysis ➞ | |
 | ZIMV ZimVie Inc. |
| Sector: Health Care | |
| SubSector: Medical Devices | |
| MarketCap: 303 Millions | |
| Recent Price: 16.05 Smart Investing & Trading Score: 57 | |
| Day Percent Change: 1.45% Day Change: 0.23 | |
| Week Change: 0.38% Year-to-date Change: -9.4% | |
| ZIMV Links: Profile News Message Board | |
| Charts:- Daily , Weekly | |
| Add ZIMV to Watchlist: View: Get Complete ZIMV Trend Analysis ➞ | |
 | USPH U.S. Physical Therapy, Inc. |
| Sector: Health Care | |
| SubSector: Specialized Health Services | |
| MarketCap: 793.556 Millions | |
| Recent Price: 105.59 Smart Investing & Trading Score: 75 | |
| Day Percent Change: -0.59% Day Change: -0.63 | |
| Week Change: 0.37% Year-to-date Change: 13.4% | |
| USPH Links: Profile News Message Board | |
| Charts:- Daily , Weekly | |
| Add USPH to Watchlist: View: Get Complete USPH Trend Analysis ➞ | |
 | FDMT 4D Molecular Therapeutics, Inc. |
| Sector: Health Care | |
| SubSector: Biotechnology | |
| MarketCap: 772 Millions | |
| Recent Price: 26.80 Smart Investing & Trading Score: 59 | |
| Day Percent Change: 0.15% Day Change: 0.04 | |
| Week Change: 0.37% Year-to-date Change: 29.5% | |
| FDMT Links: Profile News Message Board | |
| Charts:- Daily , Weekly | |
| Add FDMT to Watchlist: View: Get Complete FDMT Trend Analysis ➞ | |
 | HLN Haleon plc |
| Sector: Health Care | |
| SubSector: Drug Manufacturers - Specialty & Generic | |
| MarketCap: 38310 Millions | |
| Recent Price: 8.33 Smart Investing & Trading Score: 25 | |
| Day Percent Change: 1.09% Day Change: 0.09 | |
| Week Change: 0.36% Year-to-date Change: 1.2% | |
| HLN Links: Profile News Message Board | |
| Charts:- Daily , Weekly | |
| Add HLN to Watchlist: View: Get Complete HLN Trend Analysis ➞ | |
 | CCM Concord Medical Services Holdings Limited |
| Sector: Health Care | |
| SubSector: Hospitals | |
| MarketCap: 138.646 Millions | |
| Recent Price: 0.63 Smart Investing & Trading Score: 61 | |
| Day Percent Change: 8.98% Day Change: 0.05 | |
| Week Change: 0.33% Year-to-date Change: -42.5% | |
| CCM Links: Profile News Message Board | |
| Charts:- Daily , Weekly | |
| Add CCM to Watchlist: View: Get Complete CCM Trend Analysis ➞ | |
 | NATR Nature s Sunshine Products, Inc. |
| Sector: Health Care | |
| SubSector: Drugs - Generic | |
| MarketCap: 153.285 Millions | |
| Recent Price: 19.12 Smart Investing & Trading Score: 26 | |
| Day Percent Change: 0.10% Day Change: 0.02 | |
| Week Change: 0.31% Year-to-date Change: 10.6% | |
| NATR Links: Profile News Message Board | |
| Charts:- Daily , Weekly | |
| Add NATR to Watchlist: View: Get Complete NATR Trend Analysis ➞ | |
 | AMED Amedisys, Inc. |
| Sector: Health Care | |
| SubSector: Home Health Care | |
| MarketCap: 6058.95 Millions | |
| Recent Price: 92.36 Smart Investing & Trading Score: 70 | |
| Day Percent Change: 0.02% Day Change: 0.02 | |
| Week Change: 0.3% Year-to-date Change: -2.8% | |
| AMED Links: Profile News Message Board | |
| Charts:- Daily , Weekly | |
| Add AMED to Watchlist: View: Get Complete AMED Trend Analysis ➞ | |
 | GALT Galectin Therapeutics, Inc. |
| Sector: Health Care | |
| SubSector: Biotechnology | |
| MarketCap: 114.185 Millions | |
| Recent Price: 3.35 Smart Investing & Trading Score: 46 | |
| Day Percent Change: -3.46% Day Change: -0.12 | |
| Week Change: 0.3% Year-to-date Change: 101.8% | |
| GALT Links: Profile News Message Board | |
| Charts:- Daily , Weekly | |
| Add GALT to Watchlist: View: Get Complete GALT Trend Analysis ➞ | |
 | KRYS Krystal Biotech, Inc. |
| Sector: Health Care | |
| SubSector: Biotechnology | |
| MarketCap: 874.085 Millions | |
| Recent Price: 161.59 Smart Investing & Trading Score: 78 | |
| Day Percent Change: 2.96% Day Change: 4.65 | |
| Week Change: 0.3% Year-to-date Change: 30.3% | |
| KRYS Links: Profile News Message Board | |
| Charts:- Daily , Weekly | |
| Add KRYS to Watchlist: View: Get Complete KRYS Trend Analysis ➞ | |
 | SDGR Schrodinger, Inc. |
| Sector: Health Care | |
| SubSector: Health Information Services | |
| MarketCap: 47287 Millions | |
| Recent Price: 23.75 Smart Investing & Trading Score: 42 | |
| Day Percent Change: -1.25% Day Change: -0.30 | |
| Week Change: 0.3% Year-to-date Change: -33.7% | |
| SDGR Links: Profile News Message Board | |
| Charts:- Daily , Weekly | |
| Add SDGR to Watchlist: View: Get Complete SDGR Trend Analysis ➞ | |
 | MOR MorphoSys AG |
| Sector: Health Care | |
| SubSector: Biotechnology | |
| MarketCap: 2636.85 Millions | |
| Recent Price: 17.94 Smart Investing & Trading Score: 63 | |
| Day Percent Change: -0.22% Day Change: -0.04 | |
| Week Change: 0.28% Year-to-date Change: 81.2% | |
| MOR Links: Profile News Message Board | |
| Charts:- Daily , Weekly | |
| Add MOR to Watchlist: View: Get Complete MOR Trend Analysis ➞ | |
 | CERT Certara, Inc. |
| Sector: Health Care | |
| SubSector: Biotechnology | |
| MarketCap: 21487 Millions | |
| Recent Price: 17.66 Smart Investing & Trading Score: 86 | |
| Day Percent Change: 1.96% Day Change: 0.34 | |
| Week Change: 0.28% Year-to-date Change: 0.3% | |
| CERT Links: Profile News Message Board | |
| Charts:- Daily , Weekly | |
| Add CERT to Watchlist: View: Get Complete CERT Trend Analysis ➞ | |
 | MIRM Mirum Pharmaceuticals, Inc. |
| Sector: Health Care | |
| SubSector: Biotechnology | |
| MarketCap: 309.585 Millions | |
| Recent Price: 25.91 Smart Investing & Trading Score: 47 | |
| Day Percent Change: -1.89% Day Change: -0.50 | |
| Week Change: 0.27% Year-to-date Change: -12.2% | |
| MIRM Links: Profile News Message Board | |
| Charts:- Daily , Weekly | |
| Add MIRM to Watchlist: View: Get Complete MIRM Trend Analysis ➞ | |
 | MDT Medtronic plc |
| Sector: Health Care | |
| SubSector: Medical Appliances & Equipment | |
| MarketCap: 113698 Millions | |
| Recent Price: 81.90 Smart Investing & Trading Score: 64 | |
| Day Percent Change: 0.17% Day Change: 0.14 | |
| Week Change: 0.26% Year-to-date Change: -0.6% | |
| MDT Links: Profile News Message Board | |
| Charts:- Daily , Weekly | |
| Add MDT to Watchlist: View: Get Complete MDT Trend Analysis ➞ | |
 | ABT Abbott Laboratories |
| Sector: Health Care | |
| SubSector: Medical Appliances & Equipment | |
| MarketCap: 125288 Millions | |
| Recent Price: 106.17 Smart Investing & Trading Score: 35 | |
| Day Percent Change: 0.50% Day Change: 0.53 | |
| Week Change: 0.25% Year-to-date Change: -3.5% | |
| ABT Links: Profile News Message Board | |
| Charts:- Daily , Weekly | |
| Add ABT to Watchlist: View: Get Complete ABT Trend Analysis ➞ | |
 | ALDX Aldeyra Therapeutics, Inc. |
| Sector: Health Care | |
| SubSector: Biotechnology | |
| MarketCap: 61.2785 Millions | |
| Recent Price: 4.17 Smart Investing & Trading Score: 74 | |
| Day Percent Change: 1.21% Day Change: 0.05 | |
| Week Change: 0.24% Year-to-date Change: 18.8% | |
| ALDX Links: Profile News Message Board | |
| Charts:- Daily , Weekly | |
| Add ALDX to Watchlist: View: Get Complete ALDX Trend Analysis ➞ | |
 | TECH Bio-Techne Corporation |
| Sector: Health Care | |
| SubSector: Biotechnology | |
| MarketCap: 6958.05 Millions | |
| Recent Price: 77.46 Smart Investing & Trading Score: 88 | |
| Day Percent Change: 1.84% Day Change: 1.40 | |
| Week Change: 0.22% Year-to-date Change: 0.4% | |
| TECH Links: Profile News Message Board | |
| Charts:- Daily , Weekly | |
| Add TECH to Watchlist: View: Get Complete TECH Trend Analysis ➞ | |
 | SPRY ARS Pharmaceuticals, Inc. |
| Sector: Health Care | |
| SubSector: Biotechnology | |
| MarketCap: 632 Millions | |
| Recent Price: 9.47 Smart Investing & Trading Score: 76 | |
| Day Percent Change: 0.00% Day Change: 0.00 | |
| Week Change: 0.21% Year-to-date Change: 66.6% | |
| SPRY Links: Profile News Message Board | |
| Charts:- Daily , Weekly | |
| Add SPRY to Watchlist: View: Get Complete SPRY Trend Analysis ➞ | |
 | CELC Celcuity Inc. |
| Sector: Health Care | |
| SubSector: Medical Laboratories & Research | |
| MarketCap: 70.53 Millions | |
| Recent Price: 17.70 Smart Investing & Trading Score: 73 | |
| Day Percent Change: -0.51% Day Change: -0.09 | |
| Week Change: 0.2% Year-to-date Change: 20.8% | |
| CELC Links: Profile News Message Board | |
| Charts:- Daily , Weekly | |
| Add CELC to Watchlist: View: Get Complete CELC Trend Analysis ➞ | |
| For tabular summary view of above stock list: Summary View ➞ 0 - 25 , 25 - 50 , 50 - 75 , 75 - 100 , 100 - 125 , 125 - 150 , 150 - 175 , 175 - 200 , 200 - 225 , 225 - 250 , 250 - 275 , 275 - 300 , 300 - 325 , 325 - 350 , 350 - 375 , 375 - 400 , 400 - 425 , 425 - 450 , 450 - 475 , 475 - 500 , 500 - 525 , 525 - 550 , 550 - 575 , 575 - 600 , 600 - 625 , 625 - 650 , 650 - 675 , 675 - 700 , 700 - 725 | ||
| Click To Change The Sort Order: By Market Cap or Company Size Performance: Year-to-date, Week and Day | |
| Select Chart Type: | ||
|
Best Stocks Today 12Stocks.com |
© 2024 12Stocks.com Terms & Conditions Privacy Contact Us
All Information Provided Only For Education And Not To Be Used For Investing or Trading. See Terms & Conditions


One More Thing ... Get Best Stocks Delivered Daily!
Never Ever Miss A Move With Our Top Ten Stocks Lists
Find Best Stocks In Any Market - Bull or Bear Market
Take A Peek At Our Top Ten Stocks Lists: Daily, Weekly, Year-to-Date & Top Trends
Find Best Stocks In Any Market - Bull or Bear Market
Take A Peek At Our Top Ten Stocks Lists: Daily, Weekly, Year-to-Date & Top Trends
Healthcare Stocks With Best Up Trends [0-bearish to 100-bullish]: Design [100], Summit [100], Vanda [100], Emergent Bio[100], Addus HomeCare[100], Cue Biopharma[100], Edgewise [100], Insulet [100], Verrica [100], Oscar Health[100], Avid Bioservices[100]
Best Healthcare Stocks Year-to-Date:
Pieris [5965.93%], Precision BioSciences[2782.19%], Avenue [2620.5%], Inovio [2086.27%], Assembly Biosciences[1438.84%], Agenus [1350.66%], Aurora Cannabis[1297.52%], Adverum Biotechnologies[1273.54%], NuCana [1211.7%], Affimed N.V[736.8%], Mesoblast [623.18%] Best Healthcare Stocks This Week:
Bioventus [27.36%], Design [23.42%], P3 Health[22.36%], Passage Bio[21.37%], Outset [21.09%], Summit [20.96%], FibroGen [20.18%], Lineage Cell[18.87%], BioCryst [18.2%], Vigil Neuroscience[17.28%], ALX Oncology[14.32%] Best Healthcare Stocks Daily:
Design [28.85%], Bioventus [27.68%], Summit [18.79%], FibroGen [18.10%], Vanda [13.22%], Passage Bio[12.77%], Regencell Bioscience[12.20%], Esperion [11.79%], Emergent Bio[10.55%], Vigil Neuroscience[10.38%], Athira Pharma[10.10%]