
 Login Sign Up


| |||||
 |  | ||||

| 12Stocks.com Market Intelligence |
Best Consumer Services Stocks
| In a hurry? Services & Goods Stocks: Performance Trends Table, Stock Charts
Sort Consumer Services: Daily, Weekly, Year-to-Date, Market Cap & Trends. Filter Services & Goods stocks list by size: All Large Mid-Range Small |
| 12Stocks.com Consumer Services Stocks Performances & Trends Daily | |||||||||
|
|  The overall Smart Investing & Trading Score is 57 (0-bearish to 100-bullish) which puts Consumer Services sector in short term neutral trend. The Smart Investing & Trading Score from previous trading session is 35 and hence an improvement of trend.
| ||||||||
Here are the Smart Investing & Trading Scores of the most requested Consumer Services stocks at 12Stocks.com (click stock name for detailed review):
|


| Consider signing up for our daily 12Stocks.com "Best Stocks Newsletter". You will never ever miss a big stock move again! |
| 12Stocks.com: Investing in Consumer Services sector with Stocks | |
|
The following table helps investors and traders sort through current performance and trends (as measured by Smart Investing & Trading Score) of various
stocks in the Consumer Services sector. Quick View: Move mouse or cursor over stock symbol (ticker) to view short-term Technical chart and over stock name to view long term chart. Click on  to add stock symbol to your watchlist and to add stock symbol to your watchlist and  to view watchlist. Click on any ticker or stock name for detailed market intelligence report for that stock. to view watchlist. Click on any ticker or stock name for detailed market intelligence report for that stock. |
12Stocks.com Performance of Stocks in Consumer Services Sector
| Ticker | Stock Name | Watchlist | Category | Recent Price | Smart Investing & Trading Score | Change % | YTD Change% |
| MNSO | MINISO |   | Specialty Retail | 24.02 | 100 | -0.74% | 17.75% |
| LRN | K12 | | Education | 69.82 | 90 | 2.21% | 17.60% |
| ACVA | ACV Auctions | | Auto & Truck Dealerships | 17.70 | 53 | 1.90% | 17.50% |
| CBZ | CBIZ | | Services | 73.10 | 32 | 0.76% | 16.79% |
| KIND | Nextdoor | | Internet Content & Information | 2.15 | 64 | -0.42% | 16.27% |
| GES | Guess | | Apparel | 26.71 | 58 | 1.67% | 15.83% |
| EDU | New Oriental | | Education | 84.75 | 32 | 4.77% | 15.65% |
| MBC | MasterBrand | | Furnishings, Fixtures & Appliances | 17.23 | 45 | 1.71% | 15.44% |
| H | Hyatt Hotels | | Lodging | 150.50 | 39 | -0.78% | 15.41% |
| BAH | Booz Allen | | Services | 147.25 | 53 | 0.37% | 15.12% |
| TW | Tradeweb Markets | | Services | 104.54 | 57 | -0.91% | 15.03% |
| AEO | American Eagle | | Apparel | 24.30 | 78 | -0.69% | 14.84% |
| SCVL | Shoe Carnival | | Apparel | 34.60 | 78 | 1.62% | 14.53% |
| VAC | Marriott Vacations | | Casinos | 97.18 | 76 | -0.49% | 14.48% |
| CASY | Casey s | | Grocery | 313.92 | 48 | -0.84% | 14.26% |
| MCK | McKesson | | Pharmacy | 528.86 | 48 | -0.27% | 14.23% |
| AZO | AutoZone | | Auto Parts | 2952.20 | 32 | -0.33% | 14.18% |
| J | Jacobs Engineering | | Services | 148.10 | 95 | 2.19% | 14.10% |
| RERE | ATRenew | | Internet Retail | 2.15 | 100 | 1.89% | 14.02% |
| WMT | Walmart | | Retail | 59.82 | 71 | 0.18% | 13.83% |
| EBAY | eBay | | Retail | 49.65 | 31 | 0.53% | 13.82% |
| GPC | Genuine Parts | | Auto Parts | 157.41 | 66 | 0.70% | 13.65% |
| LOCO | El Pollo | | Restaurants | 10.01 | 100 | 16.40% | 13.49% |
| GLP | Global Partners | | Basic Materials Wholesale | 47.75 | 90 | 0.19% | 12.86% |
| COST | Costco Wholesale | | Retail | 743.90 | 69 | 1.56% | 12.70% |
| For chart view version of above stock list: Chart View ➞ 0 - 25 , 25 - 50 , 50 - 75 , 75 - 100 , 100 - 125 , 125 - 150 , 150 - 175 , 175 - 200 , 200 - 225 , 225 - 250 , 250 - 275 , 275 - 300 , 300 - 325 , 325 - 350 , 350 - 375 , 375 - 400 , 400 - 425 , 425 - 450 , 450 - 475 | ||
 | Click To Change The Sort Order: By Market Cap or Company Size Performance: Year-to-date, Week and Day |  |
|
Get the most comprehensive stock market coverage daily at 12Stocks.com ➞ Best Stocks Today ➞ Best Stocks Weekly ➞ Best Stocks Year-to-Date ➞ Best Stocks Trends ➞  Best Stocks Today 12Stocks.com Best Nasdaq Stocks ➞ Best S&P 500 Stocks ➞ Best Tech Stocks ➞ Best Biotech Stocks ➞ |
| Detailed Overview of Consumer Services Stocks |
| Consumer Services Technical Overview, Leaders & Laggards, Top Consumer Services ETF Funds & Detailed Consumer Services Stocks List, Charts, Trends & More |
| Consumer Services Sector: Technical Analysis, Trends & YTD Performance | |
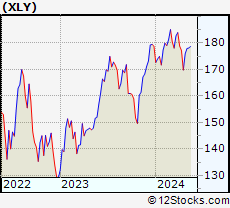
| Consumer Services sector is composed of stocks
from retail, entertainment, media/publishing, consumer goods
and services subsectors. Consumer Services sector, as represented by XLY, an exchange-traded fund [ETF] that holds basket of Consumer Services stocks (e.g, Walmart, Alibaba) is down by -0.5% and is currently underperforming the overall market by -7.38% year-to-date. Below is a quick view of Technical charts and trends: |
|
 XLY Weekly Chart |
|
| Long Term Trend: Not Good | |
| Medium Term Trend: Very Good | |
 XLY Daily Chart |
|
| Short Term Trend: Very Good | |
| Overall Trend Score: 57 | |
| YTD Performance: -0.5% | |
| **Trend Scores & Views Are Only For Educational Purposes And Not For Investing | |
| 12Stocks.com: Top Performing Consumer Services Sector Stocks | ||||||||||||||||||||||||||||||||||||||||||||||||
 The top performing Consumer Services sector stocks year to date are
Now, more recently, over last week, the top performing Consumer Services sector stocks on the move are


|
||||||||||||||||||||||||||||||||||||||||||||||||
| 12Stocks.com: Investing in Consumer Services Sector using Exchange Traded Funds | |
|
The following table shows list of key exchange traded funds (ETF) that
help investors track Consumer Services Index. For detailed view, check out our ETF Funds section of our website. Quick View: Move mouse or cursor over ETF symbol (ticker) to view short-term Technical chart and over ETF name to view long term chart. Click on ticker or stock name for detailed view. Click on to add stock symbol to your watchlist and to view watchlist. |
12Stocks.com List of ETFs that track Consumer Services Index
| Ticker | ETF Name | Watchlist | Recent Price | Smart Investing & Trading Score | Change % | Week % | Year-to-date % |
| XLY | Consumer Discret Sel | | 177.91 | 57 | 0.67 | 1.14 | -0.5% |
| RTH | Retail | | 200.52 | 40 | 0.87 | -0.28 | 6.53% |
| IYC | Consumer Services | | 79.09 | 57 | 0.84 | 0.93 | 4.38% |
| XRT | Retail | | 73.42 | 54 | 1.28 | 0.27 | 1.52% |
| IYK | Consumer Goods | | 66.59 | 64 | 0.20 | -0.25 | 4.2% |
| UCC | Consumer Services | | 34.07 | 54 | 0.31 | -0.27 | -5.13% |
| RETL | Retail Bull 3X | | 8.83 | 52 | 3.52 | 0 | -3.18% |
| RXI | Globl Consumer Discretionary | | 163.11 | 64 | 1.02 | 1.2 | 2.55% |
| SCC | Short Consumer Services | | 15.39 | 36 | -1.63 | -2.5 | 0.4% |
| UGE | Consumer Goods | | 17.27 | 90 | 0.64 | 0.58 | 9.71% |
| 12Stocks.com: Charts, Trends, Fundamental Data and Performances of Consumer Services Stocks | |
|
We now take in-depth look at all Consumer Services stocks including charts, multi-period performances and overall trends (as measured by Smart Investing & Trading Score). One can sort Consumer Services stocks (click link to choose) by Daily, Weekly and by Year-to-Date performances. Also, one can sort by size of the company or by market capitalization. |
| Select Your Default Chart Type: | |||||
| |||||
| Click on stock symbol or name for detailed view. Click on to add stock symbol to your watchlist and to view watchlist. Quick View: Move mouse or cursor over "Daily" to quickly view daily Technical stock chart and over "Weekly" to view weekly Technical stock chart. | |||||

 | MNSO MINISO Group Holding Limited |
| Sector: Services & Goods | |
| SubSector: Specialty Retail | |
| MarketCap: 69427 Millions | |
| Recent Price: 24.02 Smart Investing & Trading Score: 100 | |
| Day Percent Change: -0.74% Day Change: -0.18 | |
| Week Change: 1.65% Year-to-date Change: 17.8% | |
| MNSO Links: Profile News Message Board | |
| Charts:- Daily , Weekly | |
| Add MNSO to Watchlist: View: Get Complete MNSO Trend Analysis ➞ | |
 | LRN K12 Inc. |
| Sector: Services & Goods | |
| SubSector: Education & Training Services | |
| MarketCap: 549.606 Millions | |
| Recent Price: 69.82 Smart Investing & Trading Score: 90 | |
| Day Percent Change: 2.21% Day Change: 1.51 | |
| Week Change: 4.08% Year-to-date Change: 17.6% | |
| LRN Links: Profile News Message Board | |
| Charts:- Daily , Weekly | |
| Add LRN to Watchlist: View: Get Complete LRN Trend Analysis ➞ | |
 | ACVA ACV Auctions Inc. |
| Sector: Services & Goods | |
| SubSector: Auto & Truck Dealerships | |
| MarketCap: 2680 Millions | |
| Recent Price: 17.70 Smart Investing & Trading Score: 53 | |
| Day Percent Change: 1.90% Day Change: 0.33 | |
| Week Change: -2.18% Year-to-date Change: 17.5% | |
| ACVA Links: Profile News Message Board | |
| Charts:- Daily , Weekly | |
| Add ACVA to Watchlist: View: Get Complete ACVA Trend Analysis ➞ | |
 | CBZ CBIZ, Inc. |
| Sector: Services & Goods | |
| SubSector: Business Services | |
| MarketCap: 1121.32 Millions | |
| Recent Price: 73.10 Smart Investing & Trading Score: 32 | |
| Day Percent Change: 0.76% Day Change: 0.55 | |
| Week Change: 0.47% Year-to-date Change: 16.8% | |
| CBZ Links: Profile News Message Board | |
| Charts:- Daily , Weekly | |
| Add CBZ to Watchlist: View: Get Complete CBZ Trend Analysis ➞ | |
 | KIND Nextdoor Holdings, Inc. |
| Sector: Services & Goods | |
| SubSector: Internet Content & Information | |
| MarketCap: 1170 Millions | |
| Recent Price: 2.15 Smart Investing & Trading Score: 64 | |
| Day Percent Change: -0.42% Day Change: -0.01 | |
| Week Change: 6.49% Year-to-date Change: 16.3% | |
| KIND Links: Profile News Message Board | |
| Charts:- Daily , Weekly | |
| Add KIND to Watchlist: View: Get Complete KIND Trend Analysis ➞ | |
 | GES Guess , Inc. |
| Sector: Services & Goods | |
| SubSector: Apparel Stores | |
| MarketCap: 591.908 Millions | |
| Recent Price: 26.71 Smart Investing & Trading Score: 58 | |
| Day Percent Change: 1.67% Day Change: 0.44 | |
| Week Change: 1.83% Year-to-date Change: 15.8% | |
| GES Links: Profile News Message Board | |
| Charts:- Daily , Weekly | |
| Add GES to Watchlist: View: Get Complete GES Trend Analysis ➞ | |
 | EDU New Oriental Education & Technology Group Inc. |
| Sector: Services & Goods | |
| SubSector: Education & Training Services | |
| MarketCap: 18673.7 Millions | |
| Recent Price: 84.75 Smart Investing & Trading Score: 32 | |
| Day Percent Change: 4.77% Day Change: 3.86 | |
| Week Change: 1.79% Year-to-date Change: 15.7% | |
| EDU Links: Profile News Message Board | |
| Charts:- Daily , Weekly | |
| Add EDU to Watchlist: View: Get Complete EDU Trend Analysis ➞ | |
 | MBC MasterBrand, Inc. |
| Sector: Services & Goods | |
| SubSector: Furnishings, Fixtures & Appliances | |
| MarketCap: 1480 Millions | |
| Recent Price: 17.23 Smart Investing & Trading Score: 45 | |
| Day Percent Change: 1.71% Day Change: 0.29 | |
| Week Change: 1.12% Year-to-date Change: 15.4% | |
| MBC Links: Profile News Message Board | |
| Charts:- Daily , Weekly | |
| Add MBC to Watchlist: View: Get Complete MBC Trend Analysis ➞ | |
 | H Hyatt Hotels Corporation |
| Sector: Services & Goods | |
| SubSector: Lodging | |
| MarketCap: 5525.56 Millions | |
| Recent Price: 150.50 Smart Investing & Trading Score: 39 | |
| Day Percent Change: -0.78% Day Change: -1.18 | |
| Week Change: -0.54% Year-to-date Change: 15.4% | |
| H Links: Profile News Message Board | |
| Charts:- Daily , Weekly | |
| Add H to Watchlist: View: Get Complete H Trend Analysis ➞ | |
 | BAH Booz Allen Hamilton Holding Corporation |
| Sector: Services & Goods | |
| SubSector: Management Services | |
| MarketCap: 9037.35 Millions | |
| Recent Price: 147.25 Smart Investing & Trading Score: 53 | |
| Day Percent Change: 0.37% Day Change: 0.55 | |
| Week Change: 1.46% Year-to-date Change: 15.1% | |
| BAH Links: Profile News Message Board | |
| Charts:- Daily , Weekly | |
| Add BAH to Watchlist: View: Get Complete BAH Trend Analysis ➞ | |
 | TW Tradeweb Markets Inc. |
| Sector: Services & Goods | |
| SubSector: Management Services | |
| MarketCap: 9913.35 Millions | |
| Recent Price: 104.54 Smart Investing & Trading Score: 57 | |
| Day Percent Change: -0.91% Day Change: -0.96 | |
| Week Change: 2.65% Year-to-date Change: 15.0% | |
| TW Links: Profile News Message Board | |
| Charts:- Daily , Weekly | |
| Add TW to Watchlist: View: Get Complete TW Trend Analysis ➞ | |
 | AEO American Eagle Outfitters, Inc. |
| Sector: Services & Goods | |
| SubSector: Apparel Stores | |
| MarketCap: 1577.08 Millions | |
| Recent Price: 24.30 Smart Investing & Trading Score: 78 | |
| Day Percent Change: -0.69% Day Change: -0.17 | |
| Week Change: -0.37% Year-to-date Change: 14.8% | |
| AEO Links: Profile News Message Board | |
| Charts:- Daily , Weekly | |
| Add AEO to Watchlist: View: Get Complete AEO Trend Analysis ➞ | |
 | SCVL Shoe Carnival, Inc. |
| Sector: Services & Goods | |
| SubSector: Apparel Stores | |
| MarketCap: 252.508 Millions | |
| Recent Price: 34.60 Smart Investing & Trading Score: 78 | |
| Day Percent Change: 1.62% Day Change: 0.55 | |
| Week Change: 0.2% Year-to-date Change: 14.5% | |
| SCVL Links: Profile News Message Board | |
| Charts:- Daily , Weekly | |
| Add SCVL to Watchlist: View: Get Complete SCVL Trend Analysis ➞ | |
 | VAC Marriott Vacations Worldwide Corporation |
| Sector: Services & Goods | |
| SubSector: Resorts & Casinos | |
| MarketCap: 2173.54 Millions | |
| Recent Price: 97.18 Smart Investing & Trading Score: 76 | |
| Day Percent Change: -0.49% Day Change: -0.48 | |
| Week Change: -3.66% Year-to-date Change: 14.5% | |
| VAC Links: Profile News Message Board | |
| Charts:- Daily , Weekly | |
| Add VAC to Watchlist: View: Get Complete VAC Trend Analysis ➞ | |
 | CASY Casey s General Stores, Inc. |
| Sector: Services & Goods | |
| SubSector: Grocery Stores | |
| MarketCap: 5787.95 Millions | |
| Recent Price: 313.92 Smart Investing & Trading Score: 48 | |
| Day Percent Change: -0.84% Day Change: -2.66 | |
| Week Change: -1.91% Year-to-date Change: 14.3% | |
| CASY Links: Profile News Message Board | |
| Charts:- Daily , Weekly | |
| Add CASY to Watchlist: View: Get Complete CASY Trend Analysis ➞ | |
 | MCK McKesson Corporation |
| Sector: Services & Goods | |
| SubSector: Drugs Wholesale | |
| MarketCap: 24096.7 Millions | |
| Recent Price: 528.86 Smart Investing & Trading Score: 48 | |
| Day Percent Change: -0.27% Day Change: -1.41 | |
| Week Change: -2.66% Year-to-date Change: 14.2% | |
| MCK Links: Profile News Message Board | |
| Charts:- Daily , Weekly | |
| Add MCK to Watchlist: View: Get Complete MCK Trend Analysis ➞ | |
 | AZO AutoZone, Inc. |
| Sector: Services & Goods | |
| SubSector: Auto Parts Stores | |
| MarketCap: 19128 Millions | |
| Recent Price: 2952.20 Smart Investing & Trading Score: 32 | |
| Day Percent Change: -0.33% Day Change: -9.89 | |
| Week Change: 0.21% Year-to-date Change: 14.2% | |
| AZO Links: Profile News Message Board | |
| Charts:- Daily , Weekly | |
| Add AZO to Watchlist: View: Get Complete AZO Trend Analysis ➞ | |
 | J Jacobs Engineering Group Inc. |
| Sector: Services & Goods | |
| SubSector: Technical Services | |
| MarketCap: 9714.8 Millions | |
| Recent Price: 148.10 Smart Investing & Trading Score: 95 | |
| Day Percent Change: 2.19% Day Change: 3.17 | |
| Week Change: 2.2% Year-to-date Change: 14.1% | |
| J Links: Profile News Message Board | |
| Charts:- Daily , Weekly | |
| Add J to Watchlist: View: Get Complete J Trend Analysis ➞ | |
 | RERE ATRenew Inc. |
| Sector: Services & Goods | |
| SubSector: Internet Retail | |
| MarketCap: 672 Millions | |
| Recent Price: 2.15 Smart Investing & Trading Score: 100 | |
| Day Percent Change: 1.89% Day Change: 0.04 | |
| Week Change: 8.84% Year-to-date Change: 14.0% | |
| RERE Links: Profile News Message Board | |
| Charts:- Daily , Weekly | |
| Add RERE to Watchlist: View: Get Complete RERE Trend Analysis ➞ | |
 | WMT Walmart Inc. |
| Sector: Services & Goods | |
| SubSector: Discount, Variety Stores | |
| MarketCap: 355610 Millions | |
| Recent Price: 59.82 Smart Investing & Trading Score: 71 | |
| Day Percent Change: 0.18% Day Change: 0.11 | |
| Week Change: -0.57% Year-to-date Change: 13.8% | |
| WMT Links: Profile News Message Board | |
| Charts:- Daily , Weekly | |
| Add WMT to Watchlist: View: Get Complete WMT Trend Analysis ➞ | |
 | EBAY eBay Inc. |
| Sector: Services & Goods | |
| SubSector: Specialty Retail, Other | |
| MarketCap: 23152.3 Millions | |
| Recent Price: 49.65 Smart Investing & Trading Score: 31 | |
| Day Percent Change: 0.53% Day Change: 0.26 | |
| Week Change: -4.56% Year-to-date Change: 13.8% | |
| EBAY Links: Profile News Message Board | |
| Charts:- Daily , Weekly | |
| Add EBAY to Watchlist: View: Get Complete EBAY Trend Analysis ➞ | |
 | GPC Genuine Parts Company |
| Sector: Services & Goods | |
| SubSector: Auto Parts Stores | |
| MarketCap: 8605.9 Millions | |
| Recent Price: 157.41 Smart Investing & Trading Score: 66 | |
| Day Percent Change: 0.70% Day Change: 1.09 | |
| Week Change: -1.58% Year-to-date Change: 13.7% | |
| GPC Links: Profile News Message Board | |
| Charts:- Daily , Weekly | |
| Add GPC to Watchlist: View: Get Complete GPC Trend Analysis ➞ | |
 | LOCO El Pollo Loco Holdings, Inc. |
| Sector: Services & Goods | |
| SubSector: Restaurants | |
| MarketCap: 296.97 Millions | |
| Recent Price: 10.01 Smart Investing & Trading Score: 100 | |
| Day Percent Change: 16.40% Day Change: 1.41 | |
| Week Change: 12.35% Year-to-date Change: 13.5% | |
| LOCO Links: Profile News Message Board | |
| Charts:- Daily , Weekly | |
| Add LOCO to Watchlist: View: Get Complete LOCO Trend Analysis ➞ | |
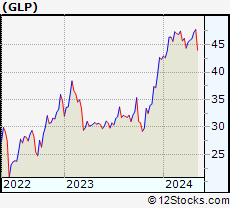 | GLP Global Partners LP |
| Sector: Services & Goods | |
| SubSector: Basic Materials Wholesale | |
| MarketCap: 416.73 Millions | |
| Recent Price: 47.75 Smart Investing & Trading Score: 90 | |
| Day Percent Change: 0.19% Day Change: 0.09 | |
| Week Change: 1.12% Year-to-date Change: 12.9% | |
| GLP Links: Profile News Message Board | |
| Charts:- Daily , Weekly | |
| Add GLP to Watchlist: View: Get Complete GLP Trend Analysis ➞ | |
 | COST Costco Wholesale Corporation |
| Sector: Services & Goods | |
| SubSector: Discount, Variety Stores | |
| MarketCap: 136355 Millions | |
| Recent Price: 743.90 Smart Investing & Trading Score: 69 | |
| Day Percent Change: 1.56% Day Change: 11.46 | |
| Week Change: 2.02% Year-to-date Change: 12.7% | |
| COST Links: Profile News Message Board | |
| Charts:- Daily , Weekly | |
| Add COST to Watchlist: View: Get Complete COST Trend Analysis ➞ | |
| For tabular summary view of above stock list: Summary View ➞ 0 - 25 , 25 - 50 , 50 - 75 , 75 - 100 , 100 - 125 , 125 - 150 , 150 - 175 , 175 - 200 , 200 - 225 , 225 - 250 , 250 - 275 , 275 - 300 , 300 - 325 , 325 - 350 , 350 - 375 , 375 - 400 , 400 - 425 , 425 - 450 , 450 - 475 | ||
| Click To Change The Sort Order: By Market Cap or Company Size Performance: Year-to-date, Week and Day | |
| Select Chart Type: | ||
|
Best Stocks Today 12Stocks.com |
© 2024 12Stocks.com Terms & Conditions Privacy Contact Us
All Information Provided Only For Education And Not To Be Used For Investing or Trading. See Terms & Conditions


One More Thing ... Get Best Stocks Delivered Daily!
Never Ever Miss A Move With Our Top Ten Stocks Lists
Find Best Stocks In Any Market - Bull or Bear Market
Take A Peek At Our Top Ten Stocks Lists: Daily, Weekly, Year-to-Date & Top Trends
Find Best Stocks In Any Market - Bull or Bear Market
Take A Peek At Our Top Ten Stocks Lists: Daily, Weekly, Year-to-Date & Top Trends
Consumer Services Stocks With Best Up Trends [0-bearish to 100-bullish]: GameStop [100], El Pollo[100], Adtalem Global[100], Chicken Soup[100], Willdan [100], SunCar Technology[100], Frontier [100], Verra Mobility[100], Mondee [100], Laureate Education[100], Hesai [100]
Best Consumer Services Stocks Year-to-Date:
U Power[3264.96%], Vroom [2061.45%], Yatsen Holding[493.22%], Fluent [422.39%], Research[141.9%], Codere Online[131.85%], Carvana Co[129.83%], Sweetgreen [95.58%], RealReal [94.03%], Smart Share[68.93%], PaySign [68.93%] Best Consumer Services Stocks This Week:
Chicken Soup[192.17%], Carvana Co[44.31%], Smart Share[40.05%], GameStop [38.4%], Perdoceo Education[29.06%], CareDx [28.57%], Gannett Co[22.87%], Wayfair [22.26%], Adtalem Global[20.93%], Sunnova Energy[19.75%], WW [19.43%] Best Consumer Services Stocks Daily:
GameStop [29.08%], El Pollo[16.40%], Team [15.14%], Adtalem Global[14.66%], Chicken Soup[13.51%], WW [10.58%], Willdan [9.87%], U Power[9.44%], SunCar Technology[9.43%], Frontier [8.66%], Wayfair [8.44%]