
 Login Sign Up


| |||||
 |  | ||||

| 12Stocks.com Market Intelligence |
Best Consumer Services Stocks
| In a hurry? Services & Goods Stocks: Performance Trends Table, Stock Charts
Sort Consumer Services: Daily, Weekly, Year-to-Date, Market Cap & Trends. Filter Services & Goods stocks list by size: All Large Mid-Range Small |
| 12Stocks.com Consumer Services Stocks Performances & Trends Daily | |||||||||
|
|  The overall Smart Investing & Trading Score is 57 (0-bearish to 100-bullish) which puts Consumer Services sector in short term neutral trend. The Smart Investing & Trading Score from previous trading session is 35 and hence an improvement of trend.
| ||||||||
Here are the Smart Investing & Trading Scores of the most requested Consumer Services stocks at 12Stocks.com (click stock name for detailed review):
|


| Consider signing up for our daily 12Stocks.com "Best Stocks Newsletter". You will never ever miss a big stock move again! |
| 12Stocks.com: Investing in Consumer Services sector with Stocks | |
|
The following table helps investors and traders sort through current performance and trends (as measured by Smart Investing & Trading Score) of various
stocks in the Consumer Services sector. Quick View: Move mouse or cursor over stock symbol (ticker) to view short-term Technical chart and over stock name to view long term chart. Click on  to add stock symbol to your watchlist and to add stock symbol to your watchlist and  to view watchlist. Click on any ticker or stock name for detailed market intelligence report for that stock. to view watchlist. Click on any ticker or stock name for detailed market intelligence report for that stock. |
12Stocks.com Performance of Stocks in Consumer Services Sector
| Ticker | Stock Name | Watchlist | Category | Recent Price | Smart Investing & Trading Score | Change % | YTD Change% |
| AOUT | American Outdoor |   | Leisure | 7.84 | 36 | 0.38% | -7.11% |
| VIPS | Vipshop | | Retail | 16.48 | 64 | 2.65% | -7.18% |
| BKR | Baker Hughes | | Services | 31.68 | 26 | -0.77% | -7.30% |
| GAMB | Gambling.com | | Gambling | 9.04 | 60 | 0.44% | -7.38% |
| TGNA | TEGNA | | Broadcasting | 14.16 | 100 | 0.11% | -7.42% |
| NYT | New York | | Publishing | 45.20 | 90 | 1.69% | -7.74% |
| ODP | Office Depot | | Retail | 51.70 | 64 | 1.54% | -8.18% |
| LFUS | Littelfuse | | Retail | 245.56 | 100 | 2.82% | -8.22% |
| FC | Franklin Covey | | Education | 39.83 | 90 | 0.00% | -8.50% |
| MCD | McDonald s | | Restaurants | 270.99 | 33 | -0.84% | -8.61% |
| MGM | MGM Resorts | | Casinos | 40.82 | 32 | -0.12% | -8.64% |
| MTN | Vail Resorts | | Casinos | 194.79 | 32 | 0.67% | -8.75% |
| WH | Wyndham Hotels | | Lodging | 73.34 | 52 | -0.73% | -8.79% |
| KTOS | Kratos Defense | | Security | 18.48 | 57 | 2.18% | -8.90% |
| LSXMB | Liberty SiriusXM | | Broadcasting | 26.18 | 55 | 0.00% | -9.03% |
| PDCO | Patterson | | Medical | 25.73 | 57 | 1.16% | -9.58% |
| DRI | Darden Restaurants | | Restaurants | 148.52 | 0 | 0.45% | -9.60% |
| MSM | MSC Industrial | | Equipment | 91.54 | 25 | 0.46% | -9.60% |
| CARS | Cars.com | | Automobile | 17.13 | 57 | 1.33% | -9.73% |
| BLMN | Bloomin | | Restaurants | 25.40 | 17 | 1.24% | -9.77% |
| YUMC | Yum China | | Restaurants | 38.22 | 57 | 2.29% | -9.93% |
| MOND | Mondee | | Travel Services | 2.50 | 100 | 7.54% | -10.25% |
| KMX | CarMax | | Automobile | 68.82 | 32 | 1.15% | -10.32% |
| HSIC | Henry Schein | | Medical | 67.87 | 0 | -1.06% | -10.36% |
| CURV | Torrid | | Apparel Retail | 5.24 | 90 | 0.19% | -10.43% |
| For chart view version of above stock list: Chart View ➞ 0 - 25 , 25 - 50 , 50 - 75 , 75 - 100 , 100 - 125 , 125 - 150 , 150 - 175 , 175 - 200 , 200 - 225 , 225 - 250 , 250 - 275 , 275 - 300 , 300 - 325 , 325 - 350 , 350 - 375 , 375 - 400 , 400 - 425 , 425 - 450 , 450 - 475 | ||
 | Click To Change The Sort Order: By Market Cap or Company Size Performance: Year-to-date, Week and Day |  |
|
Get the most comprehensive stock market coverage daily at 12Stocks.com ➞ Best Stocks Today ➞ Best Stocks Weekly ➞ Best Stocks Year-to-Date ➞ Best Stocks Trends ➞  Best Stocks Today 12Stocks.com Best Nasdaq Stocks ➞ Best S&P 500 Stocks ➞ Best Tech Stocks ➞ Best Biotech Stocks ➞ |
| Detailed Overview of Consumer Services Stocks |
| Consumer Services Technical Overview, Leaders & Laggards, Top Consumer Services ETF Funds & Detailed Consumer Services Stocks List, Charts, Trends & More |
| Consumer Services Sector: Technical Analysis, Trends & YTD Performance | |
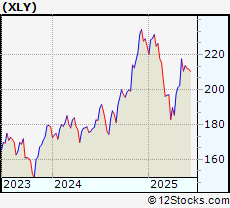
| Consumer Services sector is composed of stocks
from retail, entertainment, media/publishing, consumer goods
and services subsectors. Consumer Services sector, as represented by XLY, an exchange-traded fund [ETF] that holds basket of Consumer Services stocks (e.g, Walmart, Alibaba) is down by -0.32% and is currently underperforming the overall market by -7.22% year-to-date. Below is a quick view of Technical charts and trends: |
|
 XLY Weekly Chart |
|
| Long Term Trend: Not Good | |
| Medium Term Trend: Very Good | |
 XLY Daily Chart |
|
| Short Term Trend: Very Good | |
| Overall Trend Score: 57 | |
| YTD Performance: -0.32% | |
| **Trend Scores & Views Are Only For Educational Purposes And Not For Investing | |
| 12Stocks.com: Top Performing Consumer Services Sector Stocks | ||||||||||||||||||||||||||||||||||||||||||||||||
 The top performing Consumer Services sector stocks year to date are
Now, more recently, over last week, the top performing Consumer Services sector stocks on the move are


|
||||||||||||||||||||||||||||||||||||||||||||||||
| 12Stocks.com: Investing in Consumer Services Sector using Exchange Traded Funds | |
|
The following table shows list of key exchange traded funds (ETF) that
help investors track Consumer Services Index. For detailed view, check out our ETF Funds section of our website. Quick View: Move mouse or cursor over ETF symbol (ticker) to view short-term Technical chart and over ETF name to view long term chart. Click on ticker or stock name for detailed view. Click on to add stock symbol to your watchlist and to view watchlist. |
12Stocks.com List of ETFs that track Consumer Services Index
| Ticker | ETF Name | Watchlist | Recent Price | Smart Investing & Trading Score | Change % | Week % | Year-to-date % |
| XLY | Consumer Discret Sel | | 178.23 | 57 | 0.85 | 1.32 | -0.32% |
| RTH | Retail | | 198.74 | 25 | -0.03 | -1.16 | 5.58% |
| IYC | Consumer Services | | 79.19 | 19 | 0.98 | 1.07 | 4.52% |
| XRT | Retail | | 73.42 | 54 | 1.28 | 0.27 | 1.52% |
| IYK | Consumer Goods | | 66.57 | 56 | 0.17 | -0.28 | 4.17% |
| UCC | Consumer Services | | 34.07 | 54 | 0.31 | -0.27 | -5.13% |
| RETL | Retail Bull 3X | | 8.84 | 37 | 3.63 | 0.11 | -3.07% |
| RXI | Globl Consumer Discretionary | | 162.98 | 64 | 0.94 | 1.12 | 2.47% |
| SCC | Short Consumer Services | | 15.38 | 36 | -1.66 | -2.53 | 0.37% |
| UGE | Consumer Goods | | 17.26 | 90 | 0.58 | 0.52 | 9.65% |
| 12Stocks.com: Charts, Trends, Fundamental Data and Performances of Consumer Services Stocks | |
|
We now take in-depth look at all Consumer Services stocks including charts, multi-period performances and overall trends (as measured by Smart Investing & Trading Score). One can sort Consumer Services stocks (click link to choose) by Daily, Weekly and by Year-to-Date performances. Also, one can sort by size of the company or by market capitalization. |
| Select Your Default Chart Type: | |||||
| |||||
| Click on stock symbol or name for detailed view. Click on to add stock symbol to your watchlist and to view watchlist. Quick View: Move mouse or cursor over "Daily" to quickly view daily Technical stock chart and over "Weekly" to view weekly Technical stock chart. | |||||

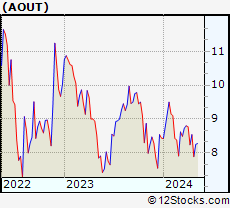 | AOUT American Outdoor Brands, Inc. |
| Sector: Services & Goods | |
| SubSector: Leisure | |
| MarketCap: 19027 Millions | |
| Recent Price: 7.84 Smart Investing & Trading Score: 36 | |
| Day Percent Change: 0.38% Day Change: 0.03 | |
| Week Change: -0.63% Year-to-date Change: -7.1% | |
| AOUT Links: Profile News Message Board | |
| Charts:- Daily , Weekly | |
| Add AOUT to Watchlist: View: Get Complete AOUT Trend Analysis ➞ | |
 | VIPS Vipshop Holdings Limited |
| Sector: Services & Goods | |
| SubSector: Catalog & Mail Order Houses | |
| MarketCap: 10496.2 Millions | |
| Recent Price: 16.48 Smart Investing & Trading Score: 64 | |
| Day Percent Change: 2.65% Day Change: 0.43 | |
| Week Change: 4.8% Year-to-date Change: -7.2% | |
| VIPS Links: Profile News Message Board | |
| Charts:- Daily , Weekly | |
| Add VIPS to Watchlist: View: Get Complete VIPS Trend Analysis ➞ | |
 | BKR Baker Hughes Company |
| Sector: Services & Goods | |
| SubSector: Technical Services | |
| MarketCap: 1330 Millions | |
| Recent Price: 31.68 Smart Investing & Trading Score: 26 | |
| Day Percent Change: -0.77% Day Change: -0.25 | |
| Week Change: -3.52% Year-to-date Change: -7.3% | |
| BKR Links: Profile News Message Board | |
| Charts:- Daily , Weekly | |
| Add BKR to Watchlist: View: Get Complete BKR Trend Analysis ➞ | |
 | GAMB Gambling.com Group Limited |
| Sector: Services & Goods | |
| SubSector: Gambling | |
| MarketCap: 376 Millions | |
| Recent Price: 9.04 Smart Investing & Trading Score: 60 | |
| Day Percent Change: 0.44% Day Change: 0.04 | |
| Week Change: 3.55% Year-to-date Change: -7.4% | |
| GAMB Links: Profile News Message Board | |
| Charts:- Daily , Weekly | |
| Add GAMB to Watchlist: View: Get Complete GAMB Trend Analysis ➞ | |
 | TGNA TEGNA Inc. |
| Sector: Services & Goods | |
| SubSector: Broadcasting - TV | |
| MarketCap: 2791.83 Millions | |
| Recent Price: 14.16 Smart Investing & Trading Score: 100 | |
| Day Percent Change: 0.11% Day Change: 0.01 | |
| Week Change: 4.62% Year-to-date Change: -7.4% | |
| TGNA Links: Profile News Message Board | |
| Charts:- Daily , Weekly | |
| Add TGNA to Watchlist: View: Get Complete TGNA Trend Analysis ➞ | |
 | NYT The New York Times Company |
| Sector: Services & Goods | |
| SubSector: Publishing - Newspapers | |
| MarketCap: 5188.22 Millions | |
| Recent Price: 45.20 Smart Investing & Trading Score: 90 | |
| Day Percent Change: 1.69% Day Change: 0.75 | |
| Week Change: 4.7% Year-to-date Change: -7.7% | |
| NYT Links: Profile News Message Board | |
| Charts:- Daily , Weekly | |
| Add NYT to Watchlist: View: Get Complete NYT Trend Analysis ➞ | |
 | ODP Office Depot, Inc. |
| Sector: Services & Goods | |
| SubSector: Specialty Retail, Other | |
| MarketCap: 1024.44 Millions | |
| Recent Price: 51.70 Smart Investing & Trading Score: 64 | |
| Day Percent Change: 1.54% Day Change: 0.79 | |
| Week Change: 0.59% Year-to-date Change: -8.2% | |
| ODP Links: Profile News Message Board | |
| Charts:- Daily , Weekly | |
| Add ODP to Watchlist: View: Get Complete ODP Trend Analysis ➞ | |
 | LFUS Littelfuse, Inc. |
| Sector: Services & Goods | |
| SubSector: Electronics Wholesale | |
| MarketCap: 2965.23 Millions | |
| Recent Price: 245.56 Smart Investing & Trading Score: 100 | |
| Day Percent Change: 2.82% Day Change: 6.73 | |
| Week Change: 6.01% Year-to-date Change: -8.2% | |
| LFUS Links: Profile News Message Board | |
| Charts:- Daily , Weekly | |
| Add LFUS to Watchlist: View: Get Complete LFUS Trend Analysis ➞ | |
 | FC Franklin Covey Co. |
| Sector: Services & Goods | |
| SubSector: Education & Training Services | |
| MarketCap: 243.306 Millions | |
| Recent Price: 39.83 Smart Investing & Trading Score: 90 | |
| Day Percent Change: 0.00% Day Change: 0.00 | |
| Week Change: 0.73% Year-to-date Change: -8.5% | |
| FC Links: Profile News Message Board | |
| Charts:- Daily , Weekly | |
| Add FC to Watchlist: View: Get Complete FC Trend Analysis ➞ | |
 | MCD McDonald s Corporation |
| Sector: Services & Goods | |
| SubSector: Restaurants | |
| MarketCap: 122481 Millions | |
| Recent Price: 270.99 Smart Investing & Trading Score: 33 | |
| Day Percent Change: -0.84% Day Change: -2.29 | |
| Week Change: -0.77% Year-to-date Change: -8.6% | |
| MCD Links: Profile News Message Board | |
| Charts:- Daily , Weekly | |
| Add MCD to Watchlist: View: Get Complete MCD Trend Analysis ➞ | |
 | MGM MGM Resorts International |
| Sector: Services & Goods | |
| SubSector: Resorts & Casinos | |
| MarketCap: 5315.04 Millions | |
| Recent Price: 40.82 Smart Investing & Trading Score: 32 | |
| Day Percent Change: -0.12% Day Change: -0.05 | |
| Week Change: -0.66% Year-to-date Change: -8.6% | |
| MGM Links: Profile News Message Board | |
| Charts:- Daily , Weekly | |
| Add MGM to Watchlist: View: Get Complete MGM Trend Analysis ➞ | |
 | MTN Vail Resorts, Inc. |
| Sector: Services & Goods | |
| SubSector: Resorts & Casinos | |
| MarketCap: 6259.64 Millions | |
| Recent Price: 194.79 Smart Investing & Trading Score: 32 | |
| Day Percent Change: 0.67% Day Change: 1.29 | |
| Week Change: -1.78% Year-to-date Change: -8.8% | |
| MTN Links: Profile News Message Board | |
| Charts:- Daily , Weekly | |
| Add MTN to Watchlist: View: Get Complete MTN Trend Analysis ➞ | |
 | WH Wyndham Hotels & Resorts, Inc. |
| Sector: Services & Goods | |
| SubSector: Lodging | |
| MarketCap: 2656.66 Millions | |
| Recent Price: 73.34 Smart Investing & Trading Score: 52 | |
| Day Percent Change: -0.73% Day Change: -0.54 | |
| Week Change: -0.61% Year-to-date Change: -8.8% | |
| WH Links: Profile News Message Board | |
| Charts:- Daily , Weekly | |
| Add WH to Watchlist: View: Get Complete WH Trend Analysis ➞ | |
 | KTOS Kratos Defense & Security Solutions, Inc. |
| Sector: Services & Goods | |
| SubSector: Security & Protection Services | |
| MarketCap: 1369.63 Millions | |
| Recent Price: 18.48 Smart Investing & Trading Score: 57 | |
| Day Percent Change: 2.18% Day Change: 0.39 | |
| Week Change: -1.96% Year-to-date Change: -8.9% | |
| KTOS Links: Profile News Message Board | |
| Charts:- Daily , Weekly | |
| Add KTOS to Watchlist: View: Get Complete KTOS Trend Analysis ➞ | |
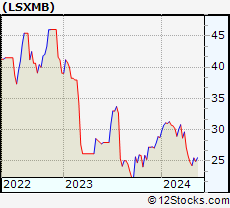 | LSXMB The Liberty SiriusXM Group |
| Sector: Services & Goods | |
| SubSector: Broadcasting - Radio | |
| MarketCap: 252.295 Millions | |
| Recent Price: 26.18 Smart Investing & Trading Score: 55 | |
| Day Percent Change: 0.00% Day Change: 0.00 | |
| Week Change: 7.83% Year-to-date Change: -9.0% | |
| LSXMB Links: Profile News Message Board | |
| Charts:- Daily , Weekly | |
| Add LSXMB to Watchlist: View: Get Complete LSXMB Trend Analysis ➞ | |
 | PDCO Patterson Companies, Inc. |
| Sector: Services & Goods | |
| SubSector: Medical Equipment Wholesale | |
| MarketCap: 1672.2 Millions | |
| Recent Price: 25.73 Smart Investing & Trading Score: 57 | |
| Day Percent Change: 1.16% Day Change: 0.30 | |
| Week Change: -0.17% Year-to-date Change: -9.6% | |
| PDCO Links: Profile News Message Board | |
| Charts:- Daily , Weekly | |
| Add PDCO to Watchlist: View: Get Complete PDCO Trend Analysis ➞ | |
 | DRI Darden Restaurants, Inc. |
| Sector: Services & Goods | |
| SubSector: Restaurants | |
| MarketCap: 5623.1 Millions | |
| Recent Price: 148.52 Smart Investing & Trading Score: 0 | |
| Day Percent Change: 0.45% Day Change: 0.66 | |
| Week Change: -4.86% Year-to-date Change: -9.6% | |
| DRI Links: Profile News Message Board | |
| Charts:- Daily , Weekly | |
| Add DRI to Watchlist: View: Get Complete DRI Trend Analysis ➞ | |
 | MSM MSC Industrial Direct Co., Inc. |
| Sector: Services & Goods | |
| SubSector: Industrial Equipment Wholesale | |
| MarketCap: 2701.88 Millions | |
| Recent Price: 91.54 Smart Investing & Trading Score: 25 | |
| Day Percent Change: 0.46% Day Change: 0.42 | |
| Week Change: -1.8% Year-to-date Change: -9.6% | |
| MSM Links: Profile News Message Board | |
| Charts:- Daily , Weekly | |
| Add MSM to Watchlist: View: Get Complete MSM Trend Analysis ➞ | |
 | CARS Cars.com Inc. |
| Sector: Services & Goods | |
| SubSector: Auto Dealerships | |
| MarketCap: 290.321 Millions | |
| Recent Price: 17.13 Smart Investing & Trading Score: 57 | |
| Day Percent Change: 1.33% Day Change: 0.23 | |
| Week Change: 0.62% Year-to-date Change: -9.7% | |
| CARS Links: Profile News Message Board | |
| Charts:- Daily , Weekly | |
| Add CARS to Watchlist: View: Get Complete CARS Trend Analysis ➞ | |
 | BLMN Bloomin Brands, Inc. |
| Sector: Services & Goods | |
| SubSector: Restaurants | |
| MarketCap: 503.47 Millions | |
| Recent Price: 25.40 Smart Investing & Trading Score: 17 | |
| Day Percent Change: 1.24% Day Change: 0.31 | |
| Week Change: -5.68% Year-to-date Change: -9.8% | |
| BLMN Links: Profile News Message Board | |
| Charts:- Daily , Weekly | |
| Add BLMN to Watchlist: View: Get Complete BLMN Trend Analysis ➞ | |
 | YUMC Yum China Holdings, Inc. |
| Sector: Services & Goods | |
| SubSector: Restaurants | |
| MarketCap: 16284.5 Millions | |
| Recent Price: 38.22 Smart Investing & Trading Score: 57 | |
| Day Percent Change: 2.29% Day Change: 0.86 | |
| Week Change: -3.62% Year-to-date Change: -9.9% | |
| YUMC Links: Profile News Message Board | |
| Charts:- Daily , Weekly | |
| Add YUMC to Watchlist: View: Get Complete YUMC Trend Analysis ➞ | |
 | MOND Mondee Holdings, Inc. |
| Sector: Services & Goods | |
| SubSector: Travel Services | |
| MarketCap: 744 Millions | |
| Recent Price: 2.50 Smart Investing & Trading Score: 100 | |
| Day Percent Change: 7.54% Day Change: 0.18 | |
| Week Change: 14.45% Year-to-date Change: -10.3% | |
| MOND Links: Profile News Message Board | |
| Charts:- Daily , Weekly | |
| Add MOND to Watchlist: View: Get Complete MOND Trend Analysis ➞ | |
 | KMX CarMax, Inc. |
| Sector: Services & Goods | |
| SubSector: Auto Dealerships | |
| MarketCap: 8121.71 Millions | |
| Recent Price: 68.82 Smart Investing & Trading Score: 32 | |
| Day Percent Change: 1.15% Day Change: 0.78 | |
| Week Change: -1.11% Year-to-date Change: -10.3% | |
| KMX Links: Profile News Message Board | |
| Charts:- Daily , Weekly | |
| Add KMX to Watchlist: View: Get Complete KMX Trend Analysis ➞ | |
 | HSIC Henry Schein, Inc. |
| Sector: Services & Goods | |
| SubSector: Medical Equipment Wholesale | |
| MarketCap: 6760.9 Millions | |
| Recent Price: 67.87 Smart Investing & Trading Score: 0 | |
| Day Percent Change: -1.06% Day Change: -0.73 | |
| Week Change: -7.19% Year-to-date Change: -10.4% | |
| HSIC Links: Profile News Message Board | |
| Charts:- Daily , Weekly | |
| Add HSIC to Watchlist: View: Get Complete HSIC Trend Analysis ➞ | |
 | CURV Torrid Holdings Inc. |
| Sector: Services & Goods | |
| SubSector: Apparel Retail | |
| MarketCap: 278 Millions | |
| Recent Price: 5.24 Smart Investing & Trading Score: 90 | |
| Day Percent Change: 0.19% Day Change: 0.01 | |
| Week Change: 4.8% Year-to-date Change: -10.4% | |
| CURV Links: Profile News Message Board | |
| Charts:- Daily , Weekly | |
| Add CURV to Watchlist: View: Get Complete CURV Trend Analysis ➞ | |
| For tabular summary view of above stock list: Summary View ➞ 0 - 25 , 25 - 50 , 50 - 75 , 75 - 100 , 100 - 125 , 125 - 150 , 150 - 175 , 175 - 200 , 200 - 225 , 225 - 250 , 250 - 275 , 275 - 300 , 300 - 325 , 325 - 350 , 350 - 375 , 375 - 400 , 400 - 425 , 425 - 450 , 450 - 475 | ||
| Click To Change The Sort Order: By Market Cap or Company Size Performance: Year-to-date, Week and Day | |
| Select Chart Type: | ||
|
Best Stocks Today 12Stocks.com |
© 2024 12Stocks.com Terms & Conditions Privacy Contact Us
All Information Provided Only For Education And Not To Be Used For Investing or Trading. See Terms & Conditions


One More Thing ... Get Best Stocks Delivered Daily!
Never Ever Miss A Move With Our Top Ten Stocks Lists
Find Best Stocks In Any Market - Bull or Bear Market
Take A Peek At Our Top Ten Stocks Lists: Daily, Weekly, Year-to-Date & Top Trends
Find Best Stocks In Any Market - Bull or Bear Market
Take A Peek At Our Top Ten Stocks Lists: Daily, Weekly, Year-to-Date & Top Trends
Consumer Services Stocks With Best Up Trends [0-bearish to 100-bullish]: GameStop [100], El Pollo[100], Adtalem Global[100], Frontier [100], Willdan [100], SunCar Technology[100], Mondee [100], BJ s[100], Ameresco [100], Hesai [100], Super [100]
Best Consumer Services Stocks Year-to-Date:
U Power[3264.96%], Vroom [1970.28%], Yatsen Holding[478.18%], Fluent [395.52%], Research[144.22%], Codere Online[131.85%], Carvana Co[130.26%], Sweetgreen [96.11%], RealReal [96.02%], Smart Share[68.93%], PaySign [66.79%] Best Consumer Services Stocks This Week:
Chicken Soup[144.35%], Carvana Co[44.59%], Smart Share[40.05%], CareDx [29.63%], Perdoceo Education[27.62%], GameStop [23.53%], Gannett Co[21.9%], Wayfair [20.44%], Adtalem Global[19.56%], Research[18.42%], WW [18.29%] Best Consumer Services Stocks Daily:
Team [17.39%], GameStop [15.20%], El Pollo[14.83%], Adtalem Global[13.35%], Cumulus Media[12.17%], Frontier [10.11%], Willdan [10.04%], WW [9.52%], U Power[9.44%], SunCar Technology[9.43%], MercadoLibre [8.69%]