
 Login Sign Up


| |||||
 |  | ||||

| 12Stocks.com Market Intelligence |
Best Consumer Services Stocks
| In a hurry? Services & Goods Stocks: Performance Trends Table, Stock Charts
Sort Consumer Services: Daily, Weekly, Year-to-Date, Market Cap & Trends. Filter Services & Goods stocks list by size: All Large Mid-Range Small |
| 12Stocks.com Consumer Services Stocks Performances & Trends Daily | |||||||||
|
|  The overall Smart Investing & Trading Score is 35 (0-bearish to 100-bullish) which puts Consumer Services sector in short term bearish to neutral trend. The Smart Investing & Trading Score from previous trading session is 7 and hence an improvement of trend.
| ||||||||
Here are the Smart Investing & Trading Scores of the most requested Consumer Services stocks at 12Stocks.com (click stock name for detailed review):
|


| Consider signing up for our daily 12Stocks.com "Best Stocks Newsletter". You will never ever miss a big stock move again! |
| 12Stocks.com: Investing in Consumer Services sector with Stocks | |
|
The following table helps investors and traders sort through current performance and trends (as measured by Smart Investing & Trading Score) of various
stocks in the Consumer Services sector. Quick View: Move mouse or cursor over stock symbol (ticker) to view short-term Technical chart and over stock name to view long term chart. Click on  to add stock symbol to your watchlist and to add stock symbol to your watchlist and  to view watchlist. Click on any ticker or stock name for detailed market intelligence report for that stock. to view watchlist. Click on any ticker or stock name for detailed market intelligence report for that stock. |
12Stocks.com Performance of Stocks in Consumer Services Sector
| Ticker | Stock Name | Watchlist | Category | Recent Price | Smart Investing & Trading Score | Change % | YTD Change% |
| ARW | Arrow Electronics |   | Retail | 122.71 | 26 | -1.71% | 0.38% |
| HSII | Heidrick & Struggles | | Staffing | 29.63 | 10 | 0.82% | 0.34% |
| DFIN | Donnelley Financial | | Services | 62.42 | 28 | 4.85% | 0.08% |
| ABM | ABM Industries | | Services | 44.84 | 100 | 0.09% | 0.02% |
| ASGN | ASGN | | Staffing | 96.06 | 8 | 0.52% | -0.11% |
| PSO | Pearson | | Publishing | 12.27 | 30 | 1.66% | -0.16% |
| WMK | Weis Markets | | Grocery | 63.85 | 62 | 1.37% | -0.17% |
| PAYX | Paychex | | Staffing | 118.45 | 0 | -0.80% | -0.55% |
| GPS | Gap | | Apparel | 20.79 | 50 | 4.84% | -0.57% |
| HRB | H&R Block | | Services | 48.03 | 64 | 0.69% | -0.70% |
| PFGC | Performance Food | | Restaurants | 68.49 | 18 | 0.09% | -0.95% |
| EEX | Emerald Holding | | Services | 5.92 | 58 | 0.68% | -1.00% |
| CHDN | Churchill Downs | | Gaming | 133.11 | 100 | 2.53% | -1.35% |
| GDEV | GDEV | | Electronic Gaming & Multimedia | 2.17 | 27 | 0.46% | -1.37% |
| MCRI | Monarch Casino | | Casinos | 68.15 | 17 | -0.47% | -1.45% |
| PKOH | Park-Ohio | | Equipment | 26.53 | 64 | 2.43% | -1.59% |
| OLLI | Ollie s | | Retail | 74.62 | 57 | 3.27% | -1.67% |
| QGEN | QIAGEN N.V | | Research | 42.68 | 82 | -0.30% | -1.73% |
| EVI | EVI Industries | | Consumer Services | 23.24 | 90 | 7.25% | -2.06% |
| GOLF | Acushnet | | Retail | 61.86 | 42 | 1.63% | -2.07% |
| BKNG | Booking | | Services | 3472.91 | 23 | 1.68% | -2.09% |
| VRSK | Verisk Analytics | | Services | 233.76 | 64 | 0.41% | -2.14% |
| NWSA | News | | Broadcasting | 24.00 | 10 | 0.67% | -2.24% |
| SDA | SunCar Technology | | Auto & Truck Dealerships | 7.59 | 68 | -1.88% | -2.38% |
| CASS | Cass Information | | Services | 43.98 | 39 | 1.13% | -2.38% |
| For chart view version of above stock list: Chart View ➞ 0 - 25 , 25 - 50 , 50 - 75 , 75 - 100 , 100 - 125 , 125 - 150 , 150 - 175 , 175 - 200 , 200 - 225 , 225 - 250 , 250 - 275 , 275 - 300 , 300 - 325 , 325 - 350 , 350 - 375 , 375 - 400 , 400 - 425 , 425 - 450 , 450 - 475 | ||
 | Click To Change The Sort Order: By Market Cap or Company Size Performance: Year-to-date, Week and Day |  |
|
Get the most comprehensive stock market coverage daily at 12Stocks.com ➞ Best Stocks Today ➞ Best Stocks Weekly ➞ Best Stocks Year-to-Date ➞ Best Stocks Trends ➞  Best Stocks Today 12Stocks.com Best Nasdaq Stocks ➞ Best S&P 500 Stocks ➞ Best Tech Stocks ➞ Best Biotech Stocks ➞ |
| Detailed Overview of Consumer Services Stocks |
| Consumer Services Technical Overview, Leaders & Laggards, Top Consumer Services ETF Funds & Detailed Consumer Services Stocks List, Charts, Trends & More |
| Consumer Services Sector: Technical Analysis, Trends & YTD Performance | |
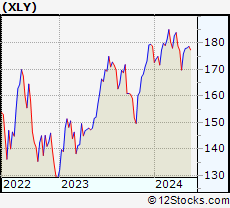
| Consumer Services sector is composed of stocks
from retail, entertainment, media/publishing, consumer goods
and services subsectors. Consumer Services sector, as represented by XLY, an exchange-traded fund [ETF] that holds basket of Consumer Services stocks (e.g, Walmart, Alibaba) is down by -1.17% and is currently underperforming the overall market by -6.79% year-to-date. Below is a quick view of Technical charts and trends: |
|
 XLY Weekly Chart |
|
| Long Term Trend: Not Good | |
| Medium Term Trend: Deteriorating | |
 XLY Daily Chart |
|
| Short Term Trend: Deteriorating | |
| Overall Trend Score: 35 | |
| YTD Performance: -1.17% | |
| **Trend Scores & Views Are Only For Educational Purposes And Not For Investing | |
| 12Stocks.com: Top Performing Consumer Services Sector Stocks | ||||||||||||||||||||||||||||||||||||||||||||||||
 The top performing Consumer Services sector stocks year to date are
Now, more recently, over last week, the top performing Consumer Services sector stocks on the move are


|
||||||||||||||||||||||||||||||||||||||||||||||||
| 12Stocks.com: Investing in Consumer Services Sector using Exchange Traded Funds | |
|
The following table shows list of key exchange traded funds (ETF) that
help investors track Consumer Services Index. For detailed view, check out our ETF Funds section of our website. Quick View: Move mouse or cursor over ETF symbol (ticker) to view short-term Technical chart and over ETF name to view long term chart. Click on ticker or stock name for detailed view. Click on to add stock symbol to your watchlist and to view watchlist. |
12Stocks.com List of ETFs that track Consumer Services Index
| Ticker | ETF Name | Watchlist | Recent Price | Smart Investing & Trading Score | Change % | Week % | Year-to-date % |
| XLY | Consumer Discret Sel | | 176.72 | 35 | 1.26 | 0.46 | -1.17% |
| RTH | Retail | | 198.79 | 17 | 1.39 | -1.14 | 5.61% |
| IYC | Consumer Services | | 78.43 | 17 | 1.38 | 0.09 | 3.51% |
| XRT | Retail | | 72.49 | 32 | 1.70 | -1 | 0.24% |
| IYK | Consumer Goods | | 66.46 | 66 | 0.51 | -0.45 | 4% |
| UCC | Consumer Services | | 33.96 | 49 | 1.98 | -0.59 | -5.42% |
| RETL | Retail Bull 3X | | 8.53 | 30 | 5.44 | -3.4 | -6.47% |
| RXI | Globl Consumer Discretionary | | 161.47 | 42 | 1.46 | 0.18 | 1.52% |
| SCC | Short Consumer Services | | 15.64 | 71 | -2.13 | -0.89 | 2.06% |
| UGE | Consumer Goods | | 17.16 | 90 | 1.81 | -0.06 | 9.01% |
| 12Stocks.com: Charts, Trends, Fundamental Data and Performances of Consumer Services Stocks | |
|
We now take in-depth look at all Consumer Services stocks including charts, multi-period performances and overall trends (as measured by Smart Investing & Trading Score). One can sort Consumer Services stocks (click link to choose) by Daily, Weekly and by Year-to-Date performances. Also, one can sort by size of the company or by market capitalization. |
| Select Your Default Chart Type: | |||||
| |||||
| Click on stock symbol or name for detailed view. Click on to add stock symbol to your watchlist and to view watchlist. Quick View: Move mouse or cursor over "Daily" to quickly view daily Technical stock chart and over "Weekly" to view weekly Technical stock chart. | |||||

 | ARW Arrow Electronics, Inc. |
| Sector: Services & Goods | |
| SubSector: Electronics Wholesale | |
| MarketCap: 4155.03 Millions | |
| Recent Price: 122.71 Smart Investing & Trading Score: 26 | |
| Day Percent Change: -1.71% Day Change: -2.14 | |
| Week Change: -4.57% Year-to-date Change: 0.4% | |
| ARW Links: Profile News Message Board | |
| Charts:- Daily , Weekly | |
| Add ARW to Watchlist: View: Get Complete ARW Trend Analysis ➞ | |
 | HSII Heidrick & Struggles International, Inc. |
| Sector: Services & Goods | |
| SubSector: Staffing & Outsourcing Services | |
| MarketCap: 431.428 Millions | |
| Recent Price: 29.63 Smart Investing & Trading Score: 10 | |
| Day Percent Change: 0.82% Day Change: 0.24 | |
| Week Change: -2.08% Year-to-date Change: 0.3% | |
| HSII Links: Profile News Message Board | |
| Charts:- Daily , Weekly | |
| Add HSII to Watchlist: View: Get Complete HSII Trend Analysis ➞ | |
 | DFIN Donnelley Financial Solutions, Inc. |
| Sector: Services & Goods | |
| SubSector: Business Services | |
| MarketCap: 229.882 Millions | |
| Recent Price: 62.42 Smart Investing & Trading Score: 28 | |
| Day Percent Change: 4.85% Day Change: 2.89 | |
| Week Change: -0.95% Year-to-date Change: 0.1% | |
| DFIN Links: Profile News Message Board | |
| Charts:- Daily , Weekly | |
| Add DFIN to Watchlist: View: Get Complete DFIN Trend Analysis ➞ | |
 | ABM ABM Industries Incorporated |
| Sector: Services & Goods | |
| SubSector: Business Services | |
| MarketCap: 1706.72 Millions | |
| Recent Price: 44.84 Smart Investing & Trading Score: 100 | |
| Day Percent Change: 0.09% Day Change: 0.04 | |
| Week Change: 1.82% Year-to-date Change: 0.0% | |
| ABM Links: Profile News Message Board | |
| Charts:- Daily , Weekly | |
| Add ABM to Watchlist: View: Get Complete ABM Trend Analysis ➞ | |
 | ASGN ASGN Incorporated |
| Sector: Services & Goods | |
| SubSector: Staffing & Outsourcing Services | |
| MarketCap: 2035.88 Millions | |
| Recent Price: 96.06 Smart Investing & Trading Score: 8 | |
| Day Percent Change: 0.52% Day Change: 0.50 | |
| Week Change: -1.49% Year-to-date Change: -0.1% | |
| ASGN Links: Profile News Message Board | |
| Charts:- Daily , Weekly | |
| Add ASGN to Watchlist: View: Get Complete ASGN Trend Analysis ➞ | |
 | PSO Pearson plc |
| Sector: Services & Goods | |
| SubSector: Publishing - Books | |
| MarketCap: 4595.42 Millions | |
| Recent Price: 12.27 Smart Investing & Trading Score: 30 | |
| Day Percent Change: 1.66% Day Change: 0.20 | |
| Week Change: -0.89% Year-to-date Change: -0.2% | |
| PSO Links: Profile News Message Board | |
| Charts:- Daily , Weekly | |
| Add PSO to Watchlist: View: Get Complete PSO Trend Analysis ➞ | |
 | WMK Weis Markets, Inc. |
| Sector: Services & Goods | |
| SubSector: Grocery Stores | |
| MarketCap: 1148.75 Millions | |
| Recent Price: 63.85 Smart Investing & Trading Score: 62 | |
| Day Percent Change: 1.37% Day Change: 0.86 | |
| Week Change: 0.3% Year-to-date Change: -0.2% | |
| WMK Links: Profile News Message Board | |
| Charts:- Daily , Weekly | |
| Add WMK to Watchlist: View: Get Complete WMK Trend Analysis ➞ | |
 | PAYX Paychex, Inc. |
| Sector: Services & Goods | |
| SubSector: Staffing & Outsourcing Services | |
| MarketCap: 20928.8 Millions | |
| Recent Price: 118.45 Smart Investing & Trading Score: 0 | |
| Day Percent Change: -0.80% Day Change: -0.96 | |
| Week Change: -1.27% Year-to-date Change: -0.6% | |
| PAYX Links: Profile News Message Board | |
| Charts:- Daily , Weekly | |
| Add PAYX to Watchlist: View: Get Complete PAYX Trend Analysis ➞ | |
 | GPS The Gap, Inc. |
| Sector: Services & Goods | |
| SubSector: Apparel Stores | |
| MarketCap: 2936.08 Millions | |
| Recent Price: 20.79 Smart Investing & Trading Score: 50 | |
| Day Percent Change: 4.84% Day Change: 0.96 | |
| Week Change: -2.62% Year-to-date Change: -0.6% | |
| GPS Links: Profile News Message Board | |
| Charts:- Daily , Weekly | |
| Add GPS to Watchlist: View: Get Complete GPS Trend Analysis ➞ | |
 | HRB H&R Block, Inc. |
| Sector: Services & Goods | |
| SubSector: Personal Services | |
| MarketCap: 3052.45 Millions | |
| Recent Price: 48.03 Smart Investing & Trading Score: 64 | |
| Day Percent Change: 0.69% Day Change: 0.33 | |
| Week Change: 3.29% Year-to-date Change: -0.7% | |
| HRB Links: Profile News Message Board | |
| Charts:- Daily , Weekly | |
| Add HRB to Watchlist: View: Get Complete HRB Trend Analysis ➞ | |
 | PFGC Performance Food Group Company |
| Sector: Services & Goods | |
| SubSector: Restaurants | |
| MarketCap: 2457.5 Millions | |
| Recent Price: 68.49 Smart Investing & Trading Score: 18 | |
| Day Percent Change: 0.09% Day Change: 0.06 | |
| Week Change: -0.52% Year-to-date Change: -1.0% | |
| PFGC Links: Profile News Message Board | |
| Charts:- Daily , Weekly | |
| Add PFGC to Watchlist: View: Get Complete PFGC Trend Analysis ➞ | |
 | EEX Emerald Holding, Inc. |
| Sector: Services & Goods | |
| SubSector: Business Services | |
| MarketCap: 252.682 Millions | |
| Recent Price: 5.92 Smart Investing & Trading Score: 58 | |
| Day Percent Change: 0.68% Day Change: 0.04 | |
| Week Change: 1.02% Year-to-date Change: -1.0% | |
| EEX Links: Profile News Message Board | |
| Charts:- Daily , Weekly | |
| Add EEX to Watchlist: View: Get Complete EEX Trend Analysis ➞ | |
 | CHDN Churchill Downs Incorporated |
| Sector: Services & Goods | |
| SubSector: Gaming Activities | |
| MarketCap: 3693.29 Millions | |
| Recent Price: 133.11 Smart Investing & Trading Score: 100 | |
| Day Percent Change: 2.53% Day Change: 3.28 | |
| Week Change: 2.84% Year-to-date Change: -1.4% | |
| CHDN Links: Profile News Message Board | |
| Charts:- Daily , Weekly | |
| Add CHDN to Watchlist: View: Get Complete CHDN Trend Analysis ➞ | |
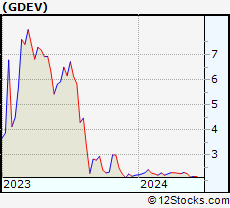 | GDEV GDEV Inc. |
| Sector: Services & Goods | |
| SubSector: Electronic Gaming & Multimedia | |
| MarketCap: 1300 Millions | |
| Recent Price: 2.17 Smart Investing & Trading Score: 27 | |
| Day Percent Change: 0.46% Day Change: 0.01 | |
| Week Change: 2.36% Year-to-date Change: -1.4% | |
| GDEV Links: Profile News Message Board | |
| Charts:- Daily , Weekly | |
| Add GDEV to Watchlist: View: Get Complete GDEV Trend Analysis ➞ | |
 | MCRI Monarch Casino & Resort, Inc. |
| Sector: Services & Goods | |
| SubSector: Resorts & Casinos | |
| MarketCap: 352.894 Millions | |
| Recent Price: 68.15 Smart Investing & Trading Score: 17 | |
| Day Percent Change: -0.47% Day Change: -0.32 | |
| Week Change: 0.12% Year-to-date Change: -1.5% | |
| MCRI Links: Profile News Message Board | |
| Charts:- Daily , Weekly | |
| Add MCRI to Watchlist: View: Get Complete MCRI Trend Analysis ➞ | |
 | PKOH Park-Ohio Holdings Corp. |
| Sector: Services & Goods | |
| SubSector: Industrial Equipment Wholesale | |
| MarketCap: 214.358 Millions | |
| Recent Price: 26.53 Smart Investing & Trading Score: 64 | |
| Day Percent Change: 2.43% Day Change: 0.63 | |
| Week Change: 10.13% Year-to-date Change: -1.6% | |
| PKOH Links: Profile News Message Board | |
| Charts:- Daily , Weekly | |
| Add PKOH to Watchlist: View: Get Complete PKOH Trend Analysis ➞ | |
 | OLLI Ollie s Bargain Outlet Holdings, Inc. |
| Sector: Services & Goods | |
| SubSector: Discount, Variety Stores | |
| MarketCap: 2904.62 Millions | |
| Recent Price: 74.62 Smart Investing & Trading Score: 57 | |
| Day Percent Change: 3.27% Day Change: 2.36 | |
| Week Change: 0.21% Year-to-date Change: -1.7% | |
| OLLI Links: Profile News Message Board | |
| Charts:- Daily , Weekly | |
| Add OLLI to Watchlist: View: Get Complete OLLI Trend Analysis ➞ | |
 | QGEN QIAGEN N.V. |
| Sector: Services & Goods | |
| SubSector: Research Services | |
| MarketCap: 8698.94 Millions | |
| Recent Price: 42.68 Smart Investing & Trading Score: 82 | |
| Day Percent Change: -0.30% Day Change: -0.13 | |
| Week Change: 2.47% Year-to-date Change: -1.7% | |
| QGEN Links: Profile News Message Board | |
| Charts:- Daily , Weekly | |
| Add QGEN to Watchlist: View: Get Complete QGEN Trend Analysis ➞ | |
 | EVI EVI Industries, Inc. |
| Sector: Services & Goods | |
| SubSector: Consumer Services | |
| MarketCap: 207.448 Millions | |
| Recent Price: 23.24 Smart Investing & Trading Score: 90 | |
| Day Percent Change: 7.25% Day Change: 1.57 | |
| Week Change: 8.4% Year-to-date Change: -2.1% | |
| EVI Links: Profile News Message Board | |
| Charts:- Daily , Weekly | |
| Add EVI to Watchlist: View: Get Complete EVI Trend Analysis ➞ | |
 | GOLF Acushnet Holdings Corp. |
| Sector: Services & Goods | |
| SubSector: Sporting Goods Stores | |
| MarketCap: 1717.74 Millions | |
| Recent Price: 61.86 Smart Investing & Trading Score: 42 | |
| Day Percent Change: 1.63% Day Change: 0.99 | |
| Week Change: -0.59% Year-to-date Change: -2.1% | |
| GOLF Links: Profile News Message Board | |
| Charts:- Daily , Weekly | |
| Add GOLF to Watchlist: View: Get Complete GOLF Trend Analysis ➞ | |
 | BKNG Booking Holdings Inc. |
| Sector: Services & Goods | |
| SubSector: Business Services | |
| MarketCap: 54467.9 Millions | |
| Recent Price: 3472.91 Smart Investing & Trading Score: 23 | |
| Day Percent Change: 1.68% Day Change: 57.27 | |
| Week Change: -1.37% Year-to-date Change: -2.1% | |
| BKNG Links: Profile News Message Board | |
| Charts:- Daily , Weekly | |
| Add BKNG to Watchlist: View: Get Complete BKNG Trend Analysis ➞ | |
 | VRSK Verisk Analytics, Inc. |
| Sector: Services & Goods | |
| SubSector: Business Services | |
| MarketCap: 22033.2 Millions | |
| Recent Price: 233.76 Smart Investing & Trading Score: 64 | |
| Day Percent Change: 0.41% Day Change: 0.95 | |
| Week Change: 5.71% Year-to-date Change: -2.1% | |
| VRSK Links: Profile News Message Board | |
| Charts:- Daily , Weekly | |
| Add VRSK to Watchlist: View: Get Complete VRSK Trend Analysis ➞ | |
 | NWSA News Corporation |
| Sector: Services & Goods | |
| SubSector: Broadcasting - TV | |
| MarketCap: 5857.53 Millions | |
| Recent Price: 24.00 Smart Investing & Trading Score: 10 | |
| Day Percent Change: 0.67% Day Change: 0.16 | |
| Week Change: -0.91% Year-to-date Change: -2.2% | |
| NWSA Links: Profile News Message Board | |
| Charts:- Daily , Weekly | |
| Add NWSA to Watchlist: View: Get Complete NWSA Trend Analysis ➞ | |
 | SDA SunCar Technology Group Inc. |
| Sector: Services & Goods | |
| SubSector: Auto & Truck Dealerships | |
| MarketCap: 2680 Millions | |
| Recent Price: 7.59 Smart Investing & Trading Score: 68 | |
| Day Percent Change: -1.88% Day Change: -0.15 | |
| Week Change: 4.48% Year-to-date Change: -2.4% | |
| SDA Links: Profile News Message Board | |
| Charts:- Daily , Weekly | |
| Add SDA to Watchlist: View: Get Complete SDA Trend Analysis ➞ | |
 | CASS Cass Information Systems, Inc. |
| Sector: Services & Goods | |
| SubSector: Business Services | |
| MarketCap: 477.382 Millions | |
| Recent Price: 43.98 Smart Investing & Trading Score: 39 | |
| Day Percent Change: 1.13% Day Change: 0.49 | |
| Week Change: 0.83% Year-to-date Change: -2.4% | |
| CASS Links: Profile News Message Board | |
| Charts:- Daily , Weekly | |
| Add CASS to Watchlist: View: Get Complete CASS Trend Analysis ➞ | |
| For tabular summary view of above stock list: Summary View ➞ 0 - 25 , 25 - 50 , 50 - 75 , 75 - 100 , 100 - 125 , 125 - 150 , 150 - 175 , 175 - 200 , 200 - 225 , 225 - 250 , 250 - 275 , 275 - 300 , 300 - 325 , 325 - 350 , 350 - 375 , 375 - 400 , 400 - 425 , 425 - 450 , 450 - 475 | ||
| Click To Change The Sort Order: By Market Cap or Company Size Performance: Year-to-date, Week and Day | |
| Select Chart Type: | ||
|
Best Stocks Today 12Stocks.com |
© 2024 12Stocks.com Terms & Conditions Privacy Contact Us
All Information Provided Only For Education And Not To Be Used For Investing or Trading. See Terms & Conditions


One More Thing ... Get Best Stocks Delivered Daily!
Never Ever Miss A Move With Our Top Ten Stocks Lists
Find Best Stocks In Any Market - Bull or Bear Market
Take A Peek At Our Top Ten Stocks Lists: Daily, Weekly, Year-to-Date & Top Trends
Find Best Stocks In Any Market - Bull or Bear Market
Take A Peek At Our Top Ten Stocks Lists: Daily, Weekly, Year-to-Date & Top Trends
Consumer Services Stocks With Best Up Trends [0-bearish to 100-bullish]: Carvana Co[100], Perdoceo Education[100], Gannett Co[100], Sprouts Farmers[100], frontdoor [100], Boqii Holding[100], MINISO [100], Smart Share[100], Deluxe [100], E.W. Scripps[100], Thomson Reuters[100]
Best Consumer Services Stocks Year-to-Date:
U Power[2974.78%], Vroom [1970.28%], Yatsen Holding[475.45%], Fluent [395.52%], Research[138.8%], Codere Online[132.88%], Carvana Co[120.06%], Sweetgreen [88.85%], RealReal [87.56%], Smart Share[68.74%], PaySign [64.64%] Best Consumer Services Stocks This Week:
Chicken Soup[157.39%], Smart Share[39.89%], Carvana Co[38.18%], Perdoceo Education[27.84%], Olaplex [24.63%], CareDx [22.62%], Polestar Automotive[21.61%], XPeng [19.9%], Gannett Co[18.6%], OneSpaWorld [16.28%], Research[15.79%] Best Consumer Services Stocks Daily:
Carvana Co[33.77%], Perdoceo Education[31.46%], Gannett Co[26.97%], Sunnova Energy[25.21%], Chicken Soup[20.82%], Olaplex [19.29%], GameStop [16.96%], Wayfair [16.05%], XPeng [15.76%], Children s[14.88%], OneWater Marine[14.09%]