
 Login Sign Up


| |||||
 |  | ||||

| 12Stocks.com Market Intelligence |
Best Consumer Services Stocks
| In a hurry? Services & Goods Stocks: Performance Trends Table, Stock Charts
Sort Consumer Services: Daily, Weekly, Year-to-Date, Market Cap & Trends. Filter Services & Goods stocks list by size: All Large Mid-Range Small |
| 12Stocks.com Consumer Services Stocks Performances & Trends Daily | |||||||||
|
|  The overall Smart Investing & Trading Score is 17 (0-bearish to 100-bullish) which puts Consumer Services sector in short term bearish trend. The Smart Investing & Trading Score from previous trading session is 7 and hence an improvement of trend.
| ||||||||
Here are the Smart Investing & Trading Scores of the most requested Consumer Services stocks at 12Stocks.com (click stock name for detailed review):
|


| Consider signing up for our daily 12Stocks.com "Best Stocks Newsletter". You will never ever miss a big stock move again! |
| 12Stocks.com: Investing in Consumer Services sector with Stocks | |
|
The following table helps investors and traders sort through current performance and trends (as measured by Smart Investing & Trading Score) of various
stocks in the Consumer Services sector. Quick View: Move mouse or cursor over stock symbol (ticker) to view short-term Technical chart and over stock name to view long term chart. Click on  to add stock symbol to your watchlist and to add stock symbol to your watchlist and  to view watchlist. Click on any ticker or stock name for detailed market intelligence report for that stock. to view watchlist. Click on any ticker or stock name for detailed market intelligence report for that stock. |
12Stocks.com Performance of Stocks in Consumer Services Sector
| Ticker | Stock Name | Watchlist | Category | Recent Price | Smart Investing & Trading Score | Change % | YTD Change% |
| WEN | Wendy s |   | Restaurants | 20.32 | 100 | 3.54% | 4.29% |
| EEFT | Euronet Worldwide | | Services | 105.77 | 39 | 1.34% | 4.22% |
| MAR | Marriott | | Lodging | 234.84 | 10 | 0.42% | 4.14% |
| BZUN | Baozun | | Retail | 2.85 | 70 | 5.56% | 4.01% |
| PK | Park Hotels | | Lodging | 15.91 | 0 | -0.38% | 3.99% |
| KFY | Korn Ferry | | Staffing | 61.71 | 32 | 0.87% | 3.98% |
| VRRM | Verra Mobility | | Security | 23.91 | 33 | 0.89% | 3.82% |
| NGVC | Natural Grocers | | Grocery | 16.61 | 52 | 0.54% | 3.81% |
| LPX | Louisiana-Pacific | | Wholesale | 73.42 | 10 | 0.75% | 3.66% |
| SGHC | Super | | Gambling | 3.31 | 69 | 1.53% | 3.60% |
| OSW | OneSpaWorld | | Casinos | 14.60 | 100 | 2.06% | 3.51% |
| CAH | Cardinal Health | | Pharmacy | 104.12 | 40 | 1.91% | 3.29% |
| AMBP | Ardagh Metal | | Packaging | 3.95 | 76 | -0.25% | 3.27% |
| HCSG | Healthcare Services | | Services | 10.70 | 15 | 0.52% | 3.13% |
| STN | Stantec | | Services | 82.53 | 57 | 2.62% | 2.92% |
| CSV | Carriage Services | | Services | 25.70 | 100 | -0.43% | 2.76% |
| SBGI | Slair Broadcast | | Broadcasting | 13.37 | 74 | 4.53% | 2.61% |
| ROL | Rollins | | Services | 44.77 | 53 | 0.20% | 2.52% |
| LOW | Lowe s | | Retail | 227.51 | 10 | 0.00% | 2.23% |
| REZI | Resideo Technologies | | Security | 19.18 | 0 | -0.57% | 1.91% |
| BABA | Alibaba | | Retail | 78.70 | 100 | 4.23% | 1.54% |
| SCI | Service | | Services | 69.50 | 15 | -2.66% | 1.53% |
| XPOF | Xponential Fitness | | Leisure | 13.24 | 61 | 1.77% | 1.53% |
| LQDT | Liquidity Services | | Retail | 17.47 | 25 | 0.40% | 1.51% |
| TJX | TJX | | Department | 95.20 | 47 | 1.48% | 1.49% |
| For chart view version of above stock list: Chart View ➞ 0 - 25 , 25 - 50 , 50 - 75 , 75 - 100 , 100 - 125 , 125 - 150 , 150 - 175 , 175 - 200 , 200 - 225 , 225 - 250 , 250 - 275 , 275 - 300 , 300 - 325 , 325 - 350 , 350 - 375 , 375 - 400 , 400 - 425 , 425 - 450 | ||
 | Click To Change The Sort Order: By Market Cap or Company Size Performance: Year-to-date, Week and Day |  |
|
Get the most comprehensive stock market coverage daily at 12Stocks.com ➞ Best Stocks Today ➞ Best Stocks Weekly ➞ Best Stocks Year-to-Date ➞ Best Stocks Trends ➞  Best Stocks Today 12Stocks.com Best Nasdaq Stocks ➞ Best S&P 500 Stocks ➞ Best Tech Stocks ➞ Best Biotech Stocks ➞ |
| Detailed Overview of Consumer Services Stocks |
| Consumer Services Technical Overview, Leaders & Laggards, Top Consumer Services ETF Funds & Detailed Consumer Services Stocks List, Charts, Trends & More |
| Consumer Services Sector: Technical Analysis, Trends & YTD Performance | |
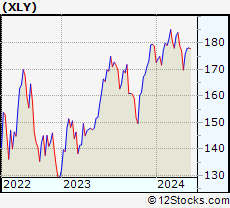
| Consumer Services sector is composed of stocks
from retail, entertainment, media/publishing, consumer goods
and services subsectors. Consumer Services sector, as represented by XLY, an exchange-traded fund [ETF] that holds basket of Consumer Services stocks (e.g, Walmart, Alibaba) is down by -1.72% and is currently underperforming the overall market by -6.87% year-to-date. Below is a quick view of Technical charts and trends: |
|
 XLY Weekly Chart |
|
| Long Term Trend: Not Good | |
| Medium Term Trend: Not Good | |
 XLY Daily Chart |
|
| Short Term Trend: Not Good | |
| Overall Trend Score: 17 | |
| YTD Performance: -1.72% | |
| **Trend Scores & Views Are Only For Educational Purposes And Not For Investing | |
| 12Stocks.com: Top Performing Consumer Services Sector Stocks | ||||||||||||||||||||||||||||||||||||||||||||||||
 The top performing Consumer Services sector stocks year to date are
Now, more recently, over last week, the top performing Consumer Services sector stocks on the move are


|
||||||||||||||||||||||||||||||||||||||||||||||||
| 12Stocks.com: Investing in Consumer Services Sector using Exchange Traded Funds | |
|
The following table shows list of key exchange traded funds (ETF) that
help investors track Consumer Services Index. For detailed view, check out our ETF Funds section of our website. Quick View: Move mouse or cursor over ETF symbol (ticker) to view short-term Technical chart and over ETF name to view long term chart. Click on ticker or stock name for detailed view. Click on to add stock symbol to your watchlist and to view watchlist. |
12Stocks.com List of ETFs that track Consumer Services Index
| Ticker | ETF Name | Watchlist | Recent Price | Smart Investing & Trading Score | Change % | Week % | Year-to-date % |
| XLY | Consumer Discret Sel | | 175.73 | 17 | 0.69 | -0.1 | -1.72% |
| RTH | Retail | | 196.96 | 0 | 0.45 | -2.05 | 4.64% |
| XRT | Retail | | 72.09 | 20 | 1.14 | -1.54 | -0.31% |
| UCC | Consumer Services | | 33.30 | 42 | 0.00 | -2.52 | -7.26% |
| SCC | Short Consumer Services | | 15.98 | 88 | 0.00 | 1.27 | 4.28% |
| UGE | Consumer Goods | | 16.92 | 73 | 0.39 | -1.46 | 7.49% |
| 12Stocks.com: Charts, Trends, Fundamental Data and Performances of Consumer Services Stocks | |
|
We now take in-depth look at all Consumer Services stocks including charts, multi-period performances and overall trends (as measured by Smart Investing & Trading Score). One can sort Consumer Services stocks (click link to choose) by Daily, Weekly and by Year-to-Date performances. Also, one can sort by size of the company or by market capitalization. |
| Select Your Default Chart Type: | |||||
| |||||
| Click on stock symbol or name for detailed view. Click on to add stock symbol to your watchlist and to view watchlist. Quick View: Move mouse or cursor over "Daily" to quickly view daily Technical stock chart and over "Weekly" to view weekly Technical stock chart. | |||||

 | WEN The Wendy s Company |
| Sector: Services & Goods | |
| SubSector: Restaurants | |
| MarketCap: 2814.9 Millions | |
| Recent Price: 20.32 Smart Investing & Trading Score: 100 | |
| Day Percent Change: 3.54% Day Change: 0.70 | |
| Week Change: 0.87% Year-to-date Change: 4.3% | |
| WEN Links: Profile News Message Board | |
| Charts:- Daily , Weekly | |
| Add WEN to Watchlist: View: Get Complete WEN Trend Analysis ➞ | |
 | EEFT Euronet Worldwide, Inc. |
| Sector: Services & Goods | |
| SubSector: Business Services | |
| MarketCap: 4809.62 Millions | |
| Recent Price: 105.77 Smart Investing & Trading Score: 39 | |
| Day Percent Change: 1.34% Day Change: 1.40 | |
| Week Change: 1.87% Year-to-date Change: 4.2% | |
| EEFT Links: Profile News Message Board | |
| Charts:- Daily , Weekly | |
| Add EEFT to Watchlist: View: Get Complete EEFT Trend Analysis ➞ | |
 | MAR Marriott International, Inc. |
| Sector: Services & Goods | |
| SubSector: Lodging | |
| MarketCap: 25831.6 Millions | |
| Recent Price: 234.84 Smart Investing & Trading Score: 10 | |
| Day Percent Change: 0.42% Day Change: 0.97 | |
| Week Change: -2.49% Year-to-date Change: 4.1% | |
| MAR Links: Profile News Message Board | |
| Charts:- Daily , Weekly | |
| Add MAR to Watchlist: View: Get Complete MAR Trend Analysis ➞ | |
 | BZUN Baozun Inc. |
| Sector: Services & Goods | |
| SubSector: Catalog & Mail Order Houses | |
| MarketCap: 1668.92 Millions | |
| Recent Price: 2.85 Smart Investing & Trading Score: 70 | |
| Day Percent Change: 5.56% Day Change: 0.15 | |
| Week Change: 3.64% Year-to-date Change: 4.0% | |
| BZUN Links: Profile News Message Board | |
| Charts:- Daily , Weekly | |
| Add BZUN to Watchlist: View: Get Complete BZUN Trend Analysis ➞ | |
 | PK Park Hotels & Resorts Inc. |
| Sector: Services & Goods | |
| SubSector: Lodging | |
| MarketCap: 2221.06 Millions | |
| Recent Price: 15.91 Smart Investing & Trading Score: 0 | |
| Day Percent Change: -0.38% Day Change: -0.06 | |
| Week Change: -3.98% Year-to-date Change: 4.0% | |
| PK Links: Profile News Message Board | |
| Charts:- Daily , Weekly | |
| Add PK to Watchlist: View: Get Complete PK Trend Analysis ➞ | |
 | KFY Korn Ferry |
| Sector: Services & Goods | |
| SubSector: Staffing & Outsourcing Services | |
| MarketCap: 1534.28 Millions | |
| Recent Price: 61.71 Smart Investing & Trading Score: 32 | |
| Day Percent Change: 0.87% Day Change: 0.53 | |
| Week Change: 1.15% Year-to-date Change: 4.0% | |
| KFY Links: Profile News Message Board | |
| Charts:- Daily , Weekly | |
| Add KFY to Watchlist: View: Get Complete KFY Trend Analysis ➞ | |
 | VRRM Verra Mobility Corporation |
| Sector: Services & Goods | |
| SubSector: Security & Protection Services | |
| MarketCap: 1265.03 Millions | |
| Recent Price: 23.91 Smart Investing & Trading Score: 33 | |
| Day Percent Change: 0.89% Day Change: 0.21 | |
| Week Change: -1.32% Year-to-date Change: 3.8% | |
| VRRM Links: Profile News Message Board | |
| Charts:- Daily , Weekly | |
| Add VRRM to Watchlist: View: Get Complete VRRM Trend Analysis ➞ | |
 | NGVC Natural Grocers by Vitamin Cottage, Inc. |
| Sector: Services & Goods | |
| SubSector: Grocery Stores | |
| MarketCap: 185.475 Millions | |
| Recent Price: 16.61 Smart Investing & Trading Score: 52 | |
| Day Percent Change: 0.54% Day Change: 0.09 | |
| Week Change: -1.6% Year-to-date Change: 3.8% | |
| NGVC Links: Profile News Message Board | |
| Charts:- Daily , Weekly | |
| Add NGVC to Watchlist: View: Get Complete NGVC Trend Analysis ➞ | |
 | LPX Louisiana-Pacific Corporation |
| Sector: Services & Goods | |
| SubSector: Building Materials Wholesale | |
| MarketCap: 1943.43 Millions | |
| Recent Price: 73.42 Smart Investing & Trading Score: 10 | |
| Day Percent Change: 0.75% Day Change: 0.55 | |
| Week Change: -1.54% Year-to-date Change: 3.7% | |
| LPX Links: Profile News Message Board | |
| Charts:- Daily , Weekly | |
| Add LPX to Watchlist: View: Get Complete LPX Trend Analysis ➞ | |
 | SGHC Super Group (SGHC) Limited |
| Sector: Services & Goods | |
| SubSector: Gambling | |
| MarketCap: 1390 Millions | |
| Recent Price: 3.31 Smart Investing & Trading Score: 69 | |
| Day Percent Change: 1.53% Day Change: 0.05 | |
| Week Change: 9.97% Year-to-date Change: 3.6% | |
| SGHC Links: Profile News Message Board | |
| Charts:- Daily , Weekly | |
| Add SGHC to Watchlist: View: Get Complete SGHC Trend Analysis ➞ | |
 | OSW OneSpaWorld Holdings Limited |
| Sector: Services & Goods | |
| SubSector: Resorts & Casinos | |
| MarketCap: 228.394 Millions | |
| Recent Price: 14.60 Smart Investing & Trading Score: 100 | |
| Day Percent Change: 2.06% Day Change: 0.29 | |
| Week Change: 14.2% Year-to-date Change: 3.5% | |
| OSW Links: Profile News Message Board | |
| Charts:- Daily , Weekly | |
| Add OSW to Watchlist: View: Get Complete OSW Trend Analysis ➞ | |
 | CAH Cardinal Health, Inc. |
| Sector: Services & Goods | |
| SubSector: Drugs Wholesale | |
| MarketCap: 14509.9 Millions | |
| Recent Price: 104.12 Smart Investing & Trading Score: 40 | |
| Day Percent Change: 1.91% Day Change: 1.95 | |
| Week Change: 0.88% Year-to-date Change: 3.3% | |
| CAH Links: Profile News Message Board | |
| Charts:- Daily , Weekly | |
| Add CAH to Watchlist: View: Get Complete CAH Trend Analysis ➞ | |
 | AMBP Ardagh Metal Packaging S.A. |
| Sector: Services & Goods | |
| SubSector: Packaging & Containers | |
| MarketCap: 2170 Millions | |
| Recent Price: 3.95 Smart Investing & Trading Score: 76 | |
| Day Percent Change: -0.25% Day Change: -0.01 | |
| Week Change: -2.47% Year-to-date Change: 3.3% | |
| AMBP Links: Profile News Message Board | |
| Charts:- Daily , Weekly | |
| Add AMBP to Watchlist: View: Get Complete AMBP Trend Analysis ➞ | |
 | HCSG Healthcare Services Group, Inc. |
| Sector: Services & Goods | |
| SubSector: Business Services | |
| MarketCap: 1758.32 Millions | |
| Recent Price: 10.70 Smart Investing & Trading Score: 15 | |
| Day Percent Change: 0.52% Day Change: 0.05 | |
| Week Change: -1.43% Year-to-date Change: 3.1% | |
| HCSG Links: Profile News Message Board | |
| Charts:- Daily , Weekly | |
| Add HCSG to Watchlist: View: Get Complete HCSG Trend Analysis ➞ | |
 | STN Stantec Inc. |
| Sector: Services & Goods | |
| SubSector: Business Services | |
| MarketCap: 2855.92 Millions | |
| Recent Price: 82.53 Smart Investing & Trading Score: 57 | |
| Day Percent Change: 2.62% Day Change: 2.11 | |
| Week Change: 0.84% Year-to-date Change: 2.9% | |
| STN Links: Profile News Message Board | |
| Charts:- Daily , Weekly | |
| Add STN to Watchlist: View: Get Complete STN Trend Analysis ➞ | |
 | CSV Carriage Services, Inc. |
| Sector: Services & Goods | |
| SubSector: Personal Services | |
| MarketCap: 304.725 Millions | |
| Recent Price: 25.70 Smart Investing & Trading Score: 100 | |
| Day Percent Change: -0.43% Day Change: -0.11 | |
| Week Change: 3.13% Year-to-date Change: 2.8% | |
| CSV Links: Profile News Message Board | |
| Charts:- Daily , Weekly | |
| Add CSV to Watchlist: View: Get Complete CSV Trend Analysis ➞ | |
 | SBGI Sinclair Broadcast Group, Inc. |
| Sector: Services & Goods | |
| SubSector: Broadcasting - TV | |
| MarketCap: 1461.73 Millions | |
| Recent Price: 13.37 Smart Investing & Trading Score: 74 | |
| Day Percent Change: 4.53% Day Change: 0.58 | |
| Week Change: 10.31% Year-to-date Change: 2.6% | |
| SBGI Links: Profile News Message Board | |
| Charts:- Daily , Weekly | |
| Add SBGI to Watchlist: View: Get Complete SBGI Trend Analysis ➞ | |
 | ROL Rollins, Inc. |
| Sector: Services & Goods | |
| SubSector: Business Services | |
| MarketCap: 12827.4 Millions | |
| Recent Price: 44.77 Smart Investing & Trading Score: 53 | |
| Day Percent Change: 0.20% Day Change: 0.09 | |
| Week Change: -0.29% Year-to-date Change: 2.5% | |
| ROL Links: Profile News Message Board | |
| Charts:- Daily , Weekly | |
| Add ROL to Watchlist: View: Get Complete ROL Trend Analysis ➞ | |
 | LOW Lowe s Companies, Inc. |
| Sector: Services & Goods | |
| SubSector: Home Improvement Stores | |
| MarketCap: 56084.2 Millions | |
| Recent Price: 227.51 Smart Investing & Trading Score: 10 | |
| Day Percent Change: 0.00% Day Change: -0.01 | |
| Week Change: -1.03% Year-to-date Change: 2.2% | |
| LOW Links: Profile News Message Board | |
| Charts:- Daily , Weekly | |
| Add LOW to Watchlist: View: Get Complete LOW Trend Analysis ➞ | |
 | REZI Resideo Technologies, Inc. |
| Sector: Services & Goods | |
| SubSector: Security & Protection Services | |
| MarketCap: 712.603 Millions | |
| Recent Price: 19.18 Smart Investing & Trading Score: 0 | |
| Day Percent Change: -0.57% Day Change: -0.11 | |
| Week Change: -3.52% Year-to-date Change: 1.9% | |
| REZI Links: Profile News Message Board | |
| Charts:- Daily , Weekly | |
| Add REZI to Watchlist: View: Get Complete REZI Trend Analysis ➞ | |
 | BABA Alibaba Group Holding Limited |
| Sector: Services & Goods | |
| SubSector: Specialty Retail, Other | |
| MarketCap: 522666 Millions | |
| Recent Price: 78.70 Smart Investing & Trading Score: 100 | |
| Day Percent Change: 4.23% Day Change: 3.19 | |
| Week Change: 4.18% Year-to-date Change: 1.5% | |
| BABA Links: Profile News Message Board | |
| Charts:- Daily , Weekly | |
| Add BABA to Watchlist: View: Get Complete BABA Trend Analysis ➞ | |
 | SCI Service Corporation International |
| Sector: Services & Goods | |
| SubSector: Personal Services | |
| MarketCap: 7216.05 Millions | |
| Recent Price: 69.50 Smart Investing & Trading Score: 15 | |
| Day Percent Change: -2.66% Day Change: -1.90 | |
| Week Change: -3.12% Year-to-date Change: 1.5% | |
| SCI Links: Profile News Message Board | |
| Charts:- Daily , Weekly | |
| Add SCI to Watchlist: View: Get Complete SCI Trend Analysis ➞ | |
 | XPOF Xponential Fitness, Inc. |
| Sector: Services & Goods | |
| SubSector: Leisure | |
| MarketCap: 811 Millions | |
| Recent Price: 13.24 Smart Investing & Trading Score: 61 | |
| Day Percent Change: 1.77% Day Change: 0.23 | |
| Week Change: 3.36% Year-to-date Change: 1.5% | |
| XPOF Links: Profile News Message Board | |
| Charts:- Daily , Weekly | |
| Add XPOF to Watchlist: View: Get Complete XPOF Trend Analysis ➞ | |
 | LQDT Liquidity Services, Inc. |
| Sector: Services & Goods | |
| SubSector: Catalog & Mail Order Houses | |
| MarketCap: 144.492 Millions | |
| Recent Price: 17.47 Smart Investing & Trading Score: 25 | |
| Day Percent Change: 0.40% Day Change: 0.07 | |
| Week Change: 0.29% Year-to-date Change: 1.5% | |
| LQDT Links: Profile News Message Board | |
| Charts:- Daily , Weekly | |
| Add LQDT to Watchlist: View: Get Complete LQDT Trend Analysis ➞ | |
 | TJX The TJX Companies, Inc. |
| Sector: Services & Goods | |
| SubSector: Department Stores | |
| MarketCap: 50656.2 Millions | |
| Recent Price: 95.20 Smart Investing & Trading Score: 47 | |
| Day Percent Change: 1.48% Day Change: 1.39 | |
| Week Change: -1.2% Year-to-date Change: 1.5% | |
| TJX Links: Profile News Message Board | |
| Charts:- Daily , Weekly | |
| Add TJX to Watchlist: View: Get Complete TJX Trend Analysis ➞ | |
| For tabular summary view of above stock list: Summary View ➞ 0 - 25 , 25 - 50 , 50 - 75 , 75 - 100 , 100 - 125 , 125 - 150 , 150 - 175 , 175 - 200 , 200 - 225 , 225 - 250 , 250 - 275 , 275 - 300 , 300 - 325 , 325 - 350 , 350 - 375 , 375 - 400 , 400 - 425 , 425 - 450 | ||
| Click To Change The Sort Order: By Market Cap or Company Size Performance: Year-to-date, Week and Day | |
| Select Chart Type: | ||
|
Best Stocks Today 12Stocks.com |
© 2024 12Stocks.com Terms & Conditions Privacy Contact Us
All Information Provided Only For Education And Not To Be Used For Investing or Trading. See Terms & Conditions


One More Thing ... Get Best Stocks Delivered Daily!
Never Ever Miss A Move With Our Top Ten Stocks Lists
Find Best Stocks In Any Market - Bull or Bear Market
Take A Peek At Our Top Ten Stocks Lists: Daily, Weekly, Year-to-Date & Top Trends
Find Best Stocks In Any Market - Bull or Bear Market
Take A Peek At Our Top Ten Stocks Lists: Daily, Weekly, Year-to-Date & Top Trends
Consumer Services Stocks With Best Up Trends [0-bearish to 100-bullish]: Gannett Co[100], Sprouts Farmers[100], Smart Share[100], Hesai [100], Alibaba [100], Gray Television[100], Wendy s[100], Outbrain [100], ATRenew [100], OneSpaWorld [100], Brinker [100]
Best Consumer Services Stocks Year-to-Date:
U Power[2974.78%], Vroom [2010.06%], Yatsen Holding[485.7%], Fluent [392.54%], Research[129.49%], Codere Online[129.11%], RealReal [94.28%], Smart Share[70.8%], Sweetgreen [68.23%], PaySign [63.21%], CAVA [56.54%] Best Consumer Services Stocks This Week:
Chicken Soup[91.3%], Smart Share[41.6%], Olaplex [24.63%], Gannett Co[22.48%], CareDx [21.76%], Polestar Automotive[21.61%], Golden Heaven[16.16%], Perdoceo Education[15.96%], Li Auto[14.84%], OneSpaWorld [14.2%], Brinker [13.8%] Best Consumer Services Stocks Daily:
Gannett Co[31.12%], Olaplex [19.29%], Perdoceo Education[19.25%], Children s[14.21%], Sprouts Farmers[13.84%], Sunnova Energy[13.46%], Polestar Automotive[13.44%], Wayfair [12.43%], OneWater Marine[11.76%], Vroom [10.89%], Smart Share[9.95%]