
 Login Sign Up


| |||||
 |  | ||||

| 12Stocks.com Market Intelligence |
Best Consumer Services Stocks
| In a hurry? Services & Goods Stocks: Performance Trends Table, Stock Charts
Sort Consumer Services: Daily, Weekly, Year-to-Date, Market Cap & Trends. Filter Services & Goods stocks list by size: All Large Mid-Range Small |
| 12Stocks.com Consumer Services Stocks Performances & Trends Daily | |||||||||
|
|  The overall Smart Investing & Trading Score is 80 (0-bearish to 100-bullish) which puts Consumer Services sector in short term neutral to bullish trend. The Smart Investing & Trading Score from previous trading session is 90 and hence a deterioration of trend.
| ||||||||
Here are the Smart Investing & Trading Scores of the most requested Consumer Services stocks at 12Stocks.com (click stock name for detailed review):
|


| Consider signing up for our daily 12Stocks.com "Best Stocks Newsletter". You will never ever miss a big stock move again! |
| 12Stocks.com: Investing in Consumer Services sector with Stocks | |
|
The following table helps investors and traders sort through current performance and trends (as measured by Smart Investing & Trading Score) of various
stocks in the Consumer Services sector. Quick View: Move mouse or cursor over stock symbol (ticker) to view short-term Technical chart and over stock name to view long term chart. Click on  to add stock symbol to your watchlist and to add stock symbol to your watchlist and  to view watchlist. Click on any ticker or stock name for detailed market intelligence report for that stock. to view watchlist. Click on any ticker or stock name for detailed market intelligence report for that stock. |
12Stocks.com Performance of Stocks in Consumer Services Sector
| Ticker | Stock Name | Watchlist | Category | Recent Price | Smart Investing & Trading Score | Change % | Weekly Change% |
| CBS | CBS |   | Entertainment | 19.60 | 20 | 0.72% | -19.18% |
| CLCT | Collectors Universe | | Services | 19.67 | 10 | 0.87% | -19.52% |
| FBR | Fibria Celulose | | Paper | 350.82 | 20 | 0.34% | -20.04% |
| EGL | Engility | | Staffing | 11.08 | 0 | 0.00% | -20.57% |
| ABCO | Advisory Board | | Services | 34.53 | 30 | 0.82% | -22.86% |
| TCS | Container Store | | Retail | 2.65 | 60 | 22.69% | -24.29% |
| HIBB | Hibbett Sports | | Retail | 66.01 | 0 | 0.64% | -24.54% |
| HLG | Hailiang Education | | Education | 10.79 | 20 | -0.46% | -24.55% |
| CPLA | Capella Education | | Education | 5.71 | 50 | 0.71% | -25.46% |
| WAGE | WageWorks | | Services | 12.89 | 30 | 0.31% | -26.43% |
| ZPIN | Zhaopin | | Staffing | 58.69 | 10 | -0.46% | -29.23% |
| SIX | Six Flags | | Entertainment | 23.03 | 20 | 1.28% | -29.38% |
| BID | Sothebys | | Retail | 31.81 | 0 | 0.09% | -30.55% |
| SALE | RetailMeNot | | Marketing | 0.59 | 10 | 0.00% | -30.59% |
| TOWR | Tower | | Auto Parts | 10.39 | 0 | 0.39% | -31.24% |
| HSNI | HSN | | Retail | 17.94 | 20 | 1.36% | -33.08% |
| ISCA | Speedway | | Sporting | 10.54 | 40 | 1.25% | -33.79% |
| TVPT | Travelport Worldwide | | Recreational | 6.17 | 30 | 1.98% | -36.33% |
| DL | China Distance | | Education | 12.61 | 30 | 0.24% | -36.60% |
| SRT | StarTek | | Services | 2.72 | 0 | -2.51% | -37.76% |
| SVU | SUPERVALU | | Grocery | 8.73 | 40 | 20.41% | -39.67% |
| WAIR | Wesco Aircraft | | Equipment | 10.17 | 0 | 0.49% | -40.11% |
| JCP | J. C. | | Department | 59.28 | 20 | 1.51% | -41.38% |
| NTRI | Nutrisystem | | Services | 198.50 | 0 | 0.17% | -45.91% |
| FDC | First Data | | Services | 36.79 | 0 | -1.66% | -48.03% |
| For chart view version of above stock list: Chart View ➞ 0 - 25 , 25 - 50 , 50 - 75 , 75 - 100 , 100 - 125 , 125 - 150 , 150 - 175 , 175 - 200 , 200 - 225 , 225 - 250 , 250 - 275 , 275 - 300 , 300 - 325 , 325 - 350 , 350 - 375 , 375 - 400 , 400 - 425 , 425 - 450 , 450 - 475 , 475 - 500 , 500 - 525 , 525 - 550 , 550 - 575 , 575 - 600 , 600 - 625 | ||
 | Click To Change The Sort Order: By Market Cap or Company Size Performance: Year-to-date, Week and Day |  |
|
Get the most comprehensive stock market coverage daily at 12Stocks.com ➞ Best Stocks Today ➞ Best Stocks Weekly ➞ Best Stocks Year-to-Date ➞ Best Stocks Trends ➞  Best Stocks Today 12Stocks.com Best Nasdaq Stocks ➞ Best S&P 500 Stocks ➞ Best Tech Stocks ➞ Best Biotech Stocks ➞ |
| Detailed Overview of Consumer Services Stocks |
| Consumer Services Technical Overview, Leaders & Laggards, Top Consumer Services ETF Funds & Detailed Consumer Services Stocks List, Charts, Trends & More |
| Consumer Services Sector: Technical Analysis, Trends & YTD Performance | |
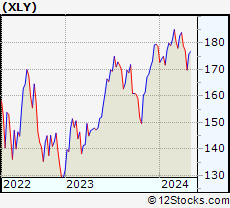
| Consumer Services sector is composed of stocks
from retail, entertainment, media/publishing, consumer goods
and services subsectors. Consumer Services sector, as represented by XLY, an exchange-traded fund [ETF] that holds basket of Consumer Services stocks (e.g, Walmart, Alibaba) is up by 9.14834% and is currently underperforming the overall market by -4.71176% year-to-date. Below is a quick view of Technical charts and trends: |
|
 XLY Weekly Chart |
|
| Long Term Trend: Very Good | |
| Medium Term Trend: Good | |
 XLY Daily Chart |
|
| Short Term Trend: Not Good | |
| Overall Trend Score: 80 | |
| YTD Performance: 9.14834% | |
| **Trend Scores & Views Are Only For Educational Purposes And Not For Investing | |
| 12Stocks.com: Top Performing Consumer Services Sector Stocks | ||||||||||||||||||||||||||||||||||||||||||||||||
 The top performing Consumer Services sector stocks year to date are
Now, more recently, over last week, the top performing Consumer Services sector stocks on the move are


|
||||||||||||||||||||||||||||||||||||||||||||||||
| 12Stocks.com: Investing in Consumer Services Sector using Exchange Traded Funds | |
|
The following table shows list of key exchange traded funds (ETF) that
help investors track Consumer Services Index. For detailed view, check out our ETF Funds section of our website. Quick View: Move mouse or cursor over ETF symbol (ticker) to view short-term Technical chart and over ETF name to view long term chart. Click on ticker or stock name for detailed view. Click on to add stock symbol to your watchlist and to view watchlist. |
12Stocks.com List of ETFs that track Consumer Services Index
| Ticker | ETF Name | Watchlist | Recent Price | Smart Investing & Trading Score | Change % | Week % | Year-to-date % |
| PMR | Retail | | 40.96 | 70 | -0.0244081 | 2.86288 | 0% |
| 12Stocks.com: Charts, Trends, Fundamental Data and Performances of Consumer Services Stocks | |
|
We now take in-depth look at all Consumer Services stocks including charts, multi-period performances and overall trends (as measured by Smart Investing & Trading Score). One can sort Consumer Services stocks (click link to choose) by Daily, Weekly and by Year-to-Date performances. Also, one can sort by size of the company or by market capitalization. |
| Select Your Default Chart Type: | |||||
| |||||
| Click on stock symbol or name for detailed view. Click on to add stock symbol to your watchlist and to view watchlist. Quick View: Move mouse or cursor over "Daily" to quickly view daily Technical stock chart and over "Weekly" to view weekly Technical stock chart. | |||||

 | CBS CBS Corporation |
| Sector: Services & Goods | |
| SubSector: Entertainment - Diversified | |
| MarketCap: 30644.2 Millions | |
| Recent Price: 19.60 Smart Investing & Trading Score: 20 | |
| Day Percent Change: 0.719424% Day Change: -9999 | |
| Week Change: -19.1753% Year-to-date Change: 0.0% | |
| CBS Links: Profile News Message Board | |
| Charts:- Daily , Weekly | |
| Add CBS to Watchlist: View: Get Complete CBS Trend Analysis ➞ | |
 | CLCT Collectors Universe, Inc. |
| Sector: Services & Goods | |
| SubSector: Business Services | |
| MarketCap: 150.482 Millions | |
| Recent Price: 19.67 Smart Investing & Trading Score: 10 | |
| Day Percent Change: 0.871795% Day Change: -9999 | |
| Week Change: -19.5172% Year-to-date Change: 0.0% | |
| CLCT Links: Profile News Message Board | |
| Charts:- Daily , Weekly | |
| Add CLCT to Watchlist: View: Get Complete CLCT Trend Analysis ➞ | |
 | FBR Fibria Celulose S.A. |
| Sector: Services & Goods | |
| SubSector: Paper & Paper Products | |
| MarketCap: 4857.81 Millions | |
| Recent Price: 350.82 Smart Investing & Trading Score: 20 | |
| Day Percent Change: 0.34036% Day Change: -9999 | |
| Week Change: -20.0374% Year-to-date Change: 0.0% | |
| FBR Links: Profile News Message Board | |
| Charts:- Daily , Weekly | |
| Add FBR to Watchlist: View: Get Complete FBR Trend Analysis ➞ | |
 | EGL Engility Holdings, Inc. |
| Sector: Services & Goods | |
| SubSector: Staffing & Outsourcing Services | |
| MarketCap: 1106.67 Millions | |
| Recent Price: 11.08 Smart Investing & Trading Score: 0 | |
| Day Percent Change: 0% Day Change: -9999 | |
| Week Change: -20.5735% Year-to-date Change: 0.0% | |
| EGL Links: Profile News Message Board | |
| Charts:- Daily , Weekly | |
| Add EGL to Watchlist: View: Get Complete EGL Trend Analysis ➞ | |
 | ABCO The Advisory Board Company |
| Sector: Services & Goods | |
| SubSector: Business Services | |
| MarketCap: 1806.71 Millions | |
| Recent Price: 34.53 Smart Investing & Trading Score: 30 | |
| Day Percent Change: 0.817518% Day Change: -9999 | |
| Week Change: -22.8552% Year-to-date Change: 0.0% | |
| ABCO Links: Profile News Message Board | |
| Charts:- Daily , Weekly | |
| Add ABCO to Watchlist: View: Get Complete ABCO Trend Analysis ➞ | |
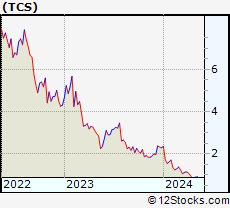 | TCS The Container Store Group, Inc. |
| Sector: Services & Goods | |
| SubSector: Specialty Retail, Other | |
| MarketCap: 142.644 Millions | |
| Recent Price: 2.65 Smart Investing & Trading Score: 60 | |
| Day Percent Change: 22.6852% Day Change: -9999 | |
| Week Change: -24.2857% Year-to-date Change: 0.0% | |
| TCS Links: Profile News Message Board | |
| Charts:- Daily , Weekly | |
| Add TCS to Watchlist: View: Get Complete TCS Trend Analysis ➞ | |
 | HIBB Hibbett Sports, Inc. |
| Sector: Services & Goods | |
| SubSector: Sporting Goods Stores | |
| MarketCap: 183 Millions | |
| Recent Price: 66.01 Smart Investing & Trading Score: 0 | |
| Day Percent Change: 0.640342% Day Change: -9999 | |
| Week Change: -24.5428% Year-to-date Change: 0.0% | |
| HIBB Links: Profile News Message Board | |
| Charts:- Daily , Weekly | |
| Add HIBB to Watchlist: View: Get Complete HIBB Trend Analysis ➞ | |
 | HLG Hailiang Education Group Inc. |
| Sector: Services & Goods | |
| SubSector: Education & Training Services | |
| MarketCap: 1024.06 Millions | |
| Recent Price: 10.79 Smart Investing & Trading Score: 20 | |
| Day Percent Change: -0.461255% Day Change: -9999 | |
| Week Change: -24.5455% Year-to-date Change: 0.0% | |
| HLG Links: Profile News Message Board | |
| Charts:- Daily , Weekly | |
| Add HLG to Watchlist: View: Get Complete HLG Trend Analysis ➞ | |
 | CPLA Capella Education Company |
| Sector: Services & Goods | |
| SubSector: Education & Training Services | |
| MarketCap: 909.47 Millions | |
| Recent Price: 5.71 Smart Investing & Trading Score: 50 | |
| Day Percent Change: 0.705467% Day Change: -9999 | |
| Week Change: -25.4569% Year-to-date Change: 0.0% | |
| CPLA Links: Profile News Message Board | |
| Charts:- Daily , Weekly | |
| Add CPLA to Watchlist: View: Get Complete CPLA Trend Analysis ➞ | |
 | WAGE WageWorks, Inc. |
| Sector: Services & Goods | |
| SubSector: Management Services | |
| MarketCap: 2889.49 Millions | |
| Recent Price: 12.89 Smart Investing & Trading Score: 30 | |
| Day Percent Change: 0.311284% Day Change: -9999 | |
| Week Change: -26.4269% Year-to-date Change: 0.0% | |
| WAGE Links: Profile News Message Board | |
| Charts:- Daily , Weekly | |
| Add WAGE to Watchlist: View: Get Complete WAGE Trend Analysis ➞ | |
 | ZPIN Zhaopin Limited |
| Sector: Services & Goods | |
| SubSector: Staffing & Outsourcing Services | |
| MarketCap: 957.9 Millions | |
| Recent Price: 58.69 Smart Investing & Trading Score: 10 | |
| Day Percent Change: -0.457938% Day Change: -9999 | |
| Week Change: -29.2295% Year-to-date Change: 0.0% | |
| ZPIN Links: Profile News Message Board | |
| Charts:- Daily , Weekly | |
| Add ZPIN to Watchlist: View: Get Complete ZPIN Trend Analysis ➞ | |
 | SIX Six Flags Entertainment Corporation |
| Sector: Services & Goods | |
| SubSector: General Entertainment | |
| MarketCap: 1282.69 Millions | |
| Recent Price: 23.03 Smart Investing & Trading Score: 20 | |
| Day Percent Change: 1.27529% Day Change: -9999 | |
| Week Change: -29.3775% Year-to-date Change: 0.0% | |
| SIX Links: Profile News Message Board | |
| Charts:- Daily , Weekly | |
| Add SIX to Watchlist: View: Get Complete SIX Trend Analysis ➞ | |
 | BID Sothebys |
| Sector: Services & Goods | |
| SubSector: Specialty Retail, Other | |
| MarketCap: 2519.84 Millions | |
| Recent Price: 31.81 Smart Investing & Trading Score: 0 | |
| Day Percent Change: 0.094399% Day Change: -9999 | |
| Week Change: -30.5459% Year-to-date Change: 0.0% | |
| BID Links: Profile News Message Board | |
| Charts:- Daily , Weekly | |
| Add BID to Watchlist: View: Get Complete BID Trend Analysis ➞ | |
 | SALE RetailMeNot, Inc. |
| Sector: Services & Goods | |
| SubSector: Marketing Services | |
| MarketCap: 409.15 Millions | |
| Recent Price: 0.59 Smart Investing & Trading Score: 10 | |
| Day Percent Change: 0% Day Change: -9999 | |
| Week Change: -30.5882% Year-to-date Change: 0.0% | |
| SALE Links: Profile News Message Board | |
| Charts:- Daily , Weekly | |
| Add SALE to Watchlist: View: Get Complete SALE Trend Analysis ➞ | |
 | TOWR Tower International, Inc. |
| Sector: Services & Goods | |
| SubSector: Auto Parts | |
| MarketCap: 578.45 Millions | |
| Recent Price: 10.39 Smart Investing & Trading Score: 0 | |
| Day Percent Change: 0.386473% Day Change: -9999 | |
| Week Change: -31.2376% Year-to-date Change: 0.0% | |
| TOWR Links: Profile News Message Board | |
| Charts:- Daily , Weekly | |
| Add TOWR to Watchlist: View: Get Complete TOWR Trend Analysis ➞ | |
 | HSNI HSN, Inc. |
| Sector: Services & Goods | |
| SubSector: Specialty Retail, Other | |
| MarketCap: 1895.93 Millions | |
| Recent Price: 17.94 Smart Investing & Trading Score: 20 | |
| Day Percent Change: 1.35593% Day Change: -9999 | |
| Week Change: -33.0847% Year-to-date Change: 0.0% | |
| HSNI Links: Profile News Message Board | |
| Charts:- Daily , Weekly | |
| Add HSNI to Watchlist: View: Get Complete HSNI Trend Analysis ➞ | |
 | ISCA International Speedway Corporation |
| Sector: Services & Goods | |
| SubSector: Sporting Activities | |
| MarketCap: 1642.07 Millions | |
| Recent Price: 10.54 Smart Investing & Trading Score: 40 | |
| Day Percent Change: 1.2488% Day Change: -9999 | |
| Week Change: -33.794% Year-to-date Change: 0.0% | |
| ISCA Links: Profile News Message Board | |
| Charts:- Daily , Weekly | |
| Add ISCA to Watchlist: View: Get Complete ISCA Trend Analysis ➞ | |
 | TVPT Travelport Worldwide Limited |
| Sector: Services & Goods | |
| SubSector: Recreational Goods, Other | |
| MarketCap: 1516.79 Millions | |
| Recent Price: 6.17 Smart Investing & Trading Score: 30 | |
| Day Percent Change: 1.98347% Day Change: -9999 | |
| Week Change: -36.3261% Year-to-date Change: 0.0% | |
| TVPT Links: Profile News Message Board | |
| Charts:- Daily , Weekly | |
| Add TVPT to Watchlist: View: Get Complete TVPT Trend Analysis ➞ | |
 | DL China Distance Education Holdings Limited |
| Sector: Services & Goods | |
| SubSector: Education & Training Services | |
| MarketCap: 257.606 Millions | |
| Recent Price: 12.61 Smart Investing & Trading Score: 30 | |
| Day Percent Change: 0.238474% Day Change: -9999 | |
| Week Change: -36.6013% Year-to-date Change: 0.0% | |
| DL Links: Profile News Message Board | |
| Charts:- Daily , Weekly | |
| Add DL to Watchlist: View: Get Complete DL Trend Analysis ➞ | |
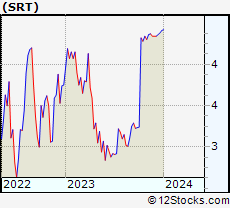 | SRT StarTek, Inc. |
| Sector: Services & Goods | |
| SubSector: Business Services | |
| MarketCap: 168.282 Millions | |
| Recent Price: 2.72 Smart Investing & Trading Score: 0 | |
| Day Percent Change: -2.50896% Day Change: -9999 | |
| Week Change: -37.7574% Year-to-date Change: 0.0% | |
| SRT Links: Profile News Message Board | |
| Charts:- Daily , Weekly | |
| Add SRT to Watchlist: View: Get Complete SRT Trend Analysis ➞ | |
 | SVU SUPERVALU Inc. |
| Sector: Services & Goods | |
| SubSector: Grocery Stores | |
| MarketCap: 923.8 Millions | |
| Recent Price: 8.73 Smart Investing & Trading Score: 40 | |
| Day Percent Change: 20.4138% Day Change: -9999 | |
| Week Change: -39.6683% Year-to-date Change: 0.0% | |
| SVU Links: Profile News Message Board | |
| Charts:- Daily , Weekly | |
| Add SVU to Watchlist: View: Get Complete SVU Trend Analysis ➞ | |
 | WAIR Wesco Aircraft Holdings, Inc. |
| Sector: Services & Goods | |
| SubSector: Industrial Equipment Wholesale | |
| MarketCap: 1164.52 Millions | |
| Recent Price: 10.17 Smart Investing & Trading Score: 0 | |
| Day Percent Change: 0.494071% Day Change: -9999 | |
| Week Change: -40.106% Year-to-date Change: 0.0% | |
| WAIR Links: Profile News Message Board | |
| Charts:- Daily , Weekly | |
| Add WAIR to Watchlist: View: Get Complete WAIR Trend Analysis ➞ | |
 | JCP J. C. Penney Company, Inc. |
| Sector: Services & Goods | |
| SubSector: Department Stores | |
| MarketCap: 175 Millions | |
| Recent Price: 59.28 Smart Investing & Trading Score: 20 | |
| Day Percent Change: 1.50685% Day Change: -9999 | |
| Week Change: -41.3824% Year-to-date Change: 0.0% | |
| JCP Links: Profile News Message Board | |
| Charts:- Daily , Weekly | |
| Add JCP to Watchlist: View: Get Complete JCP Trend Analysis ➞ | |
 | NTRI Nutrisystem, Inc. |
| Sector: Services & Goods | |
| SubSector: Personal Services | |
| MarketCap: 1526.53 Millions | |
| Recent Price: 198.50 Smart Investing & Trading Score: 0 | |
| Day Percent Change: 0.171579% Day Change: -9999 | |
| Week Change: -45.9143% Year-to-date Change: 0.0% | |
| NTRI Links: Profile News Message Board | |
| Charts:- Daily , Weekly | |
| Add NTRI to Watchlist: View: Get Complete NTRI Trend Analysis ➞ | |
 | FDC First Data Corporation |
| Sector: Services & Goods | |
| SubSector: Business Services | |
| MarketCap: 14383.3 Millions | |
| Recent Price: 36.79 Smart Investing & Trading Score: 0 | |
| Day Percent Change: -1.65731% Day Change: -9999 | |
| Week Change: -48.0294% Year-to-date Change: 0.0% | |
| FDC Links: Profile News Message Board | |
| Charts:- Daily , Weekly | |
| Add FDC to Watchlist: View: Get Complete FDC Trend Analysis ➞ | |
| For tabular summary view of above stock list: Summary View ➞ 0 - 25 , 25 - 50 , 50 - 75 , 75 - 100 , 100 - 125 , 125 - 150 , 150 - 175 , 175 - 200 , 200 - 225 , 225 - 250 , 250 - 275 , 275 - 300 , 300 - 325 , 325 - 350 , 350 - 375 , 375 - 400 , 400 - 425 , 425 - 450 , 450 - 475 , 475 - 500 , 500 - 525 , 525 - 550 , 550 - 575 , 575 - 600 , 600 - 625 | ||
| Click To Change The Sort Order: By Market Cap or Company Size Performance: Year-to-date, Week and Day | |
| Select Chart Type: | ||
|
Best Stocks Today 12Stocks.com |
© 2025 12Stocks.com Terms & Conditions Privacy Contact Us
All Information Provided Only For Education And Not To Be Used For Investing or Trading. See Terms & Conditions


One More Thing ... Get Best Stocks Delivered Daily!
Never Ever Miss A Move With Our Top Ten Stocks Lists
Find Best Stocks In Any Market - Bull or Bear Market
Take A Peek At Our Top Ten Stocks Lists: Daily, Weekly, Year-to-Date & Top Trends
Find Best Stocks In Any Market - Bull or Bear Market
Take A Peek At Our Top Ten Stocks Lists: Daily, Weekly, Year-to-Date & Top Trends
Consumer Services Stocks With Best Up Trends [0-bearish to 100-bullish]: SES AI[100], QuantumScape Corp[100], Whole Foods[100], Net 1[100], China Automotive[100], Flexsteel Industries[100], Hooker Furnishings[100], Urban One[100], National Vision[100], Resources Connection[100], LiveWire [100]
Best Consumer Services Stocks Year-to-Date:
WW [2010.49%], Nova Lifestyle[688.863%], ThredUp [656.028%], Lucid [576.568%], Vroom [455.146%], China Yuchai[299.164%], Luxottica [210.802%], Jumia Technologies[205.641%], Cooper-Standard [190.097%], Niu Technologies[150%], National Vision[145.404%] Best Consumer Services Stocks This Week:
Party City[37593.9%], Companhia Brasileira[18587.4%], Conn s[16420.1%], Rite Aid[10214.6%], Arctic Cat[2387.5%], Chico s[2120.53%], Multi-Color [2063.68%], Reis [1734.59%], Quotient Technology[954.386%], Express [946.725%], Volt Information[705.085%] Best Consumer Services Stocks Daily:
Container Store[22.6852%], SES AI[21.5385%], SUPERVALU [20.4138%], QuantumScape Corp[18.2261%], World Wrestling[14.734%], Global Sources[13.1016%], Whole Foods[11.8363%], Ranpak [10.8974%], iClick Interactive[10%], Net 1[9.46197%], RCI Hospitality[9.18605%]