
 Login Sign Up


| |||||
 |  | ||||

| 12Stocks.com Market Intelligence |
Best SmallCap Stocks
|
| In a hurry? Small Cap Stock Lists: Performance Trends Table, Stock Charts
Sort Small Cap stocks: Daily, Weekly, Year-to-Date, Market Cap & Trends. Filter Small Cap stocks list by sector: Show all, Tech, Finance, Energy, Staples, Retail, Industrial, Materials, Utilities and HealthCare Filter Small Cap stocks list by size: All Large Medium Small and MicroCap |
| 12Stocks.com Small Cap Stocks Performances & Trends Daily | |||||||||
|
|  The overall Smart Investing & Trading Score is 44 (0-bearish to 100-bullish) which puts Small Cap index in short term neutral trend. The Smart Investing & Trading Score from previous trading session is 58 and hence a deterioration of trend.
| ||||||||
Here are the Smart Investing & Trading Scores of the most requested small cap stocks at 12Stocks.com (click stock name for detailed review):
|


| 12Stocks.com: Investing in Smallcap Index with Stocks | |
|
The following table helps investors and traders sort through current performance and trends (as measured by Smart Investing & Trading Score) of various
stocks in the Smallcap Index. Quick View: Move mouse or cursor over stock symbol (ticker) to view short-term technical chart and over stock name to view long term chart. Click on  to add stock symbol to your watchlist and to add stock symbol to your watchlist and  to view watchlist. Click on any ticker or stock name for detailed market intelligence report for that stock. to view watchlist. Click on any ticker or stock name for detailed market intelligence report for that stock. |
12Stocks.com Performance of Stocks in Smallcap Index
| Ticker | Stock Name | Watchlist | Category | Recent Price | Smart Investing & Trading Score | Change % | Weekly Change% |
| MKTW | MarketWise |   | Technology | 1.61 | 52 | -3.59% | -1.83% |
| MRC | MRC Global | | Energy | 11.57 | 36 | -0.86% | -1.87% |
| SPTN | SpartanNash | | Consumer Staples | 19.30 | 47 | -0.41% | -1.88% |
| RICK | RCI Hospitality | | Services & Goods | 50.67 | 27 | -0.37% | -1.88% |
| UEC | Uranium Energy | | Materials | 6.66 | 10 | 0.60% | -1.91% |
| MBUU | Malibu Boats | | Consumer Staples | 33.82 | 18 | -2.65% | -1.91% |
| OEC | Orion Engineered | | Materials | 23.63 | 26 | 0.42% | -1.91% |
| YMAB | Y-mAbs | | Health Care | 14.86 | 58 | -2.81% | -1.91% |
| EIG | Employers | | Financials | 43.51 | 88 | -3.10% | -1.92% |
| JRVR | James River | | Financials | 9.16 | 55 | -1.29% | -1.93% |
| LXFR | Luxfer | | Industrials | 9.59 | 46 | -0.93% | -1.94% |
| ODC | Oil-Dri | | Materials | 67.70 | 51 | -2.49% | -1.97% |
| NBN | Northeast Bank | | Financials | 51.79 | 35 | -1.33% | -1.97% |
| PD | PagerDuty | | Technology | 20.20 | 10 | -2.70% | -1.99% |
| EFSC | Enterprise Financial | | Financials | 38.89 | 17 | -0.61% | -1.99% |
| CHUY | Chuy s | | Services & Goods | 29.98 | 18 | -1.80% | -1.99% |
| XFOR | X4 | | Health Care | 1.23 | 56 | -4.65% | -1.99% |
| PWOD | Penns Woods | | Financials | 17.60 | 7 | 1.85% | -2.00% |
| PFSI | PennyMac Financial | | Financials | 86.20 | 81 | -6.38% | -2.00% |
| PRAA | PRA Group | | Services & Goods | 23.88 | 68 | -3.67% | -2.01% |
| JACK | Jack in | | Services & Goods | 58.44 | 27 | -0.70% | -2.01% |
| FMNB | Farmers National | | Financials | 12.16 | 42 | -1.78% | -2.01% |
| CRGY | Crescent Energy | | Energy | 10.75 | 0 | 0.37% | -2.01% |
| WDFC | WD-40 | | Materials | 225.20 | 10 | -0.66% | -2.02% |
| PDLB | PDL Community | | Financials | 8.18 | 42 | -1.80% | -2.04% |


| Too many stocks? View smallcap stocks filtered by marketcap & sector |
| Marketcap: All SmallCap Stocks (default-no microcap), Large, Mid-Range, Small |
| Smallcap Sector: Tech, Finance, Energy, Staples, Retail, Industrial, Materials, & Medical |
|
Get the most comprehensive stock market coverage daily at 12Stocks.com ➞ Best Stocks Today ➞ Best Stocks Weekly ➞ Best Stocks Year-to-Date ➞ Best Stocks Trends ➞  Best Stocks Today 12Stocks.com Best Nasdaq Stocks ➞ Best S&P 500 Stocks ➞ Best Tech Stocks ➞ Best Biotech Stocks ➞ |
| Detailed Overview of SmallCap Stocks |
| SmallCap Technical Overview, Leaders & Laggards, Top SmallCap ETF Funds & Detailed SmallCap Stocks List, Charts, Trends & More |
| Smallcap: Technical Analysis, Trends & YTD Performance | |
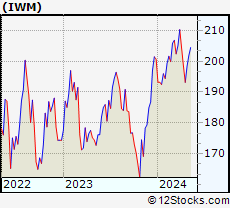
| SmallCap segment as represented by
IWM, an exchange-traded fund [ETF], holds basket of thousands of smallcap stocks from across all major sectors of the US stock market. The smallcap index (contains stocks like Riverbed & Sotheby's) is down by -2.11% and is currently underperforming the overall market by -7.27% year-to-date. Below is a quick view of technical charts and trends: | |
 IWM Weekly Chart |
|
| Long Term Trend: Good | |
| Medium Term Trend: Not Good | |
 IWM Daily Chart |
|
| Short Term Trend: Very Good | |
| Overall Trend Score: 44 | |
| YTD Performance: -2.11% | |
| **Trend Scores & Views Are Only For Educational Purposes And Not For Investing | |
| 12Stocks.com: Top Performing Small Cap Index Stocks | ||||||||||||||||||||||||||||||||||||||||||||||||
 The top performing Small Cap Index stocks year to date are
Now, more recently, over last week, the top performing Small Cap Index stocks on the move are


|
||||||||||||||||||||||||||||||||||||||||||||||||
| 12Stocks.com: Investing in Smallcap Index using Exchange Traded Funds | |
|
The following table shows list of key exchange traded funds (ETF) that
help investors track Smallcap index. The following list also includes leveraged ETF funds that track twice or thrice the daily returns of Smallcap indices. Short or inverse ETF funds move in the opposite direction to the index they track and are useful during market pullbacks or during bear markets. Quick View: Move mouse or cursor over ETF symbol (ticker) to view short-term technical chart and over ETF name to view long term chart. Click on ticker or stock name for detailed view. Click on to add stock symbol to your watchlist and to view watchlist. |
12Stocks.com List of ETFs that track Smallcap Index
| Ticker | ETF Name | Watchlist | Recent Price | Smart Investing & Trading Score | Change % | Week % | Year-to-date % |
| IWM | iShares Russell 2000 | | 196.48 | 44 | -0.61 | 1.73 | -2.11% |
| IJR | iShares Core S&P Small-Cap | | 104.86 | 78 | -0.80 | 1.59 | -3.13% |
| VTWO | Vanguard Russell 2000 ETF | | 79.45 | 63 | -0.60 | 1.75 | -2.03% |
| IWN | iShares Russell 2000 Value | | 150.18 | 68 | -0.73 | 1.62 | -3.32% |
| IWO | iShares Russell 2000 Growth | | 249.86 | 51 | -0.56 | 1.86 | -0.94% |
| IJS | iShares S&P Small-Cap 600 Value | | 96.69 | 60 | -1.04 | 1.13 | -6.19% |
| IJT | iShares S&P Small-Cap 600 Growth | | 125.06 | 63 | -0.25 | 2.33 | -0.06% |
| XSLV | PowerShares S&P SmallCap Low Volatil ETF | | 42.54 | 73 | -0.93 | 0.85 | -3.65% |
| SDD | ProShares UltraShort SmallCap600 | | 19.58 | 42 | 0.46 | -3.74 | 6.26% |
| SBB | ProShares Short SmallCap600 | | 16.50 | 40 | 0.79 | -2.02 | 3.58% |
| SMLV | SPDR SSGA US Small Cap Low Volatil ETF | | 107.33 | 73 | -1.01 | 1.17 | -4.61% |
| SAA | ProShares Ultra SmallCap600 | | 22.66 | 58 | -1.52 | 3.94 | -9.18% |
| 12Stocks.com: Charts, Trends, Fundamental Data and Performances of SmallCap Stocks | |
|
We now take in-depth look at all SmallCap stocks including charts, multi-period performances and overall trends (as measured by Smart Investing & Trading Score). One can sort SmallCap stocks (click link to choose) by Daily, Weekly and by Year-to-Date performances. Also, one can sort by size of the company or by market capitalization. |
| Select Your Default Chart Type: | |||||
| |||||
| Click on stock symbol or name for detailed view. Click on to add stock symbol to your watchlist and to view watchlist. Quick View: Move mouse or cursor over "Daily" to quickly view daily technical stock chart and over "Weekly" to view weekly technical stock chart. | |||||

 | MKTW MarketWise, Inc. |
| Sector: Technology | |
| SubSector: Software - Application | |
| MarketCap: 646 Millions | |
| Recent Price: 1.61 Smart Investing & Trading Score: 52 | |
| Day Percent Change: -3.59% Day Change: -0.06 | |
| Week Change: -1.83% Year-to-date Change: -40.4% | |
| MKTW Links: Profile News Message Board | |
| Charts:- Daily , Weekly | |
| Add MKTW to Watchlist: View: Get Complete MKTW Trend Analysis ➞ | |
 | MRC MRC Global Inc. |
| Sector: Energy | |
| SubSector: Oil & Gas Equipment & Services | |
| MarketCap: 364.061 Millions | |
| Recent Price: 11.57 Smart Investing & Trading Score: 36 | |
| Day Percent Change: -0.86% Day Change: -0.10 | |
| Week Change: -1.87% Year-to-date Change: 5.1% | |
| MRC Links: Profile News Message Board | |
| Charts:- Daily , Weekly | |
| Add MRC to Watchlist: View: Get Complete MRC Trend Analysis ➞ | |
 | SPTN SpartanNash Company |
| Sector: Consumer Staples | |
| SubSector: Food Wholesale | |
| MarketCap: 671.229 Millions | |
| Recent Price: 19.30 Smart Investing & Trading Score: 47 | |
| Day Percent Change: -0.41% Day Change: -0.08 | |
| Week Change: -1.88% Year-to-date Change: -15.9% | |
| SPTN Links: Profile News Message Board | |
| Charts:- Daily , Weekly | |
| Add SPTN to Watchlist: View: Get Complete SPTN Trend Analysis ➞ | |
 | RICK RCI Hospitality Holdings, Inc. |
| Sector: Services & Goods | |
| SubSector: Restaurants | |
| MarketCap: 93 Millions | |
| Recent Price: 50.67 Smart Investing & Trading Score: 27 | |
| Day Percent Change: -0.37% Day Change: -0.19 | |
| Week Change: -1.88% Year-to-date Change: -23.5% | |
| RICK Links: Profile News Message Board | |
| Charts:- Daily , Weekly | |
| Add RICK to Watchlist: View: Get Complete RICK Trend Analysis ➞ | |
 | UEC Uranium Energy Corp. |
| Sector: Materials | |
| SubSector: Industrial Metals & Minerals | |
| MarketCap: 138.91 Millions | |
| Recent Price: 6.66 Smart Investing & Trading Score: 10 | |
| Day Percent Change: 0.60% Day Change: 0.04 | |
| Week Change: -1.91% Year-to-date Change: 4.1% | |
| UEC Links: Profile News Message Board | |
| Charts:- Daily , Weekly | |
| Add UEC to Watchlist: View: Get Complete UEC Trend Analysis ➞ | |
 | MBUU Malibu Boats, Inc. |
| Sector: Consumer Staples | |
| SubSector: Recreational Goods, Other | |
| MarketCap: 561.059 Millions | |
| Recent Price: 33.82 Smart Investing & Trading Score: 18 | |
| Day Percent Change: -2.65% Day Change: -0.92 | |
| Week Change: -1.91% Year-to-date Change: -38.3% | |
| MBUU Links: Profile News Message Board | |
| Charts:- Daily , Weekly | |
| Add MBUU to Watchlist: View: Get Complete MBUU Trend Analysis ➞ | |
 | OEC Orion Engineered Carbons S.A. |
| Sector: Materials | |
| SubSector: Specialty Chemicals | |
| MarketCap: 493.457 Millions | |
| Recent Price: 23.63 Smart Investing & Trading Score: 26 | |
| Day Percent Change: 0.42% Day Change: 0.10 | |
| Week Change: -1.91% Year-to-date Change: -14.8% | |
| OEC Links: Profile News Message Board | |
| Charts:- Daily , Weekly | |
| Add OEC to Watchlist: View: Get Complete OEC Trend Analysis ➞ | |
 | YMAB Y-mAbs Therapeutics, Inc. |
| Sector: Health Care | |
| SubSector: Biotechnology | |
| MarketCap: 899.585 Millions | |
| Recent Price: 14.86 Smart Investing & Trading Score: 58 | |
| Day Percent Change: -2.81% Day Change: -0.43 | |
| Week Change: -1.91% Year-to-date Change: 117.9% | |
| YMAB Links: Profile News Message Board | |
| Charts:- Daily , Weekly | |
| Add YMAB to Watchlist: View: Get Complete YMAB Trend Analysis ➞ | |
 | EIG Employers Holdings, Inc. |
| Sector: Financials | |
| SubSector: Accident & Health Insurance | |
| MarketCap: 1202.6 Millions | |
| Recent Price: 43.51 Smart Investing & Trading Score: 88 | |
| Day Percent Change: -3.10% Day Change: -1.39 | |
| Week Change: -1.92% Year-to-date Change: 10.4% | |
| EIG Links: Profile News Message Board | |
| Charts:- Daily , Weekly | |
| Add EIG to Watchlist: View: Get Complete EIG Trend Analysis ➞ | |
 | JRVR James River Group Holdings, Ltd. |
| Sector: Financials | |
| SubSector: Property & Casualty Insurance | |
| MarketCap: 978.312 Millions | |
| Recent Price: 9.16 Smart Investing & Trading Score: 55 | |
| Day Percent Change: -1.29% Day Change: -0.12 | |
| Week Change: -1.93% Year-to-date Change: -0.9% | |
| JRVR Links: Profile News Message Board | |
| Charts:- Daily , Weekly | |
| Add JRVR to Watchlist: View: Get Complete JRVR Trend Analysis ➞ | |
 | LXFR Luxfer Holdings PLC |
| Sector: Industrials | |
| SubSector: Diversified Machinery | |
| MarketCap: 406.716 Millions | |
| Recent Price: 9.59 Smart Investing & Trading Score: 46 | |
| Day Percent Change: -0.93% Day Change: -0.09 | |
| Week Change: -1.94% Year-to-date Change: 7.3% | |
| LXFR Links: Profile News Message Board | |
| Charts:- Daily , Weekly | |
| Add LXFR to Watchlist: View: Get Complete LXFR Trend Analysis ➞ | |
 | ODC Oil-Dri Corporation of America |
| Sector: Materials | |
| SubSector: Specialty Chemicals | |
| MarketCap: 249.857 Millions | |
| Recent Price: 67.70 Smart Investing & Trading Score: 51 | |
| Day Percent Change: -2.49% Day Change: -1.73 | |
| Week Change: -1.97% Year-to-date Change: 0.9% | |
| ODC Links: Profile News Message Board | |
| Charts:- Daily , Weekly | |
| Add ODC to Watchlist: View: Get Complete ODC Trend Analysis ➞ | |
 | NBN Northeast Bank |
| Sector: Financials | |
| SubSector: Regional - Northeast Banks | |
| MarketCap: 114.199 Millions | |
| Recent Price: 51.79 Smart Investing & Trading Score: 35 | |
| Day Percent Change: -1.33% Day Change: -0.70 | |
| Week Change: -1.97% Year-to-date Change: -6.2% | |
| NBN Links: Profile News Message Board | |
| Charts:- Daily , Weekly | |
| Add NBN to Watchlist: View: Get Complete NBN Trend Analysis ➞ | |
 | PD PagerDuty, Inc. |
| Sector: Technology | |
| SubSector: Application Software | |
| MarketCap: 1690.32 Millions | |
| Recent Price: 20.20 Smart Investing & Trading Score: 10 | |
| Day Percent Change: -2.70% Day Change: -0.56 | |
| Week Change: -1.99% Year-to-date Change: -12.7% | |
| PD Links: Profile News Message Board | |
| Charts:- Daily , Weekly | |
| Add PD to Watchlist: View: Get Complete PD Trend Analysis ➞ | |
 | EFSC Enterprise Financial Services Corp |
| Sector: Financials | |
| SubSector: Regional - Southwest Banks | |
| MarketCap: 770.165 Millions | |
| Recent Price: 38.89 Smart Investing & Trading Score: 17 | |
| Day Percent Change: -0.61% Day Change: -0.24 | |
| Week Change: -1.99% Year-to-date Change: -12.9% | |
| EFSC Links: Profile News Message Board | |
| Charts:- Daily , Weekly | |
| Add EFSC to Watchlist: View: Get Complete EFSC Trend Analysis ➞ | |
 | CHUY Chuy s Holdings, Inc. |
| Sector: Services & Goods | |
| SubSector: Restaurants | |
| MarketCap: 159.17 Millions | |
| Recent Price: 29.98 Smart Investing & Trading Score: 18 | |
| Day Percent Change: -1.80% Day Change: -0.55 | |
| Week Change: -1.99% Year-to-date Change: -21.6% | |
| CHUY Links: Profile News Message Board | |
| Charts:- Daily , Weekly | |
| Add CHUY to Watchlist: View: Get Complete CHUY Trend Analysis ➞ | |
 | XFOR X4 Pharmaceuticals, Inc. |
| Sector: Health Care | |
| SubSector: Biotechnology | |
| MarketCap: 143.385 Millions | |
| Recent Price: 1.23 Smart Investing & Trading Score: 56 | |
| Day Percent Change: -4.65% Day Change: -0.06 | |
| Week Change: -1.99% Year-to-date Change: 46.7% | |
| XFOR Links: Profile News Message Board | |
| Charts:- Daily , Weekly | |
| Add XFOR to Watchlist: View: Get Complete XFOR Trend Analysis ➞ | |
 | PWOD Penns Woods Bancorp, Inc. |
| Sector: Financials | |
| SubSector: Regional - Mid-Atlantic Banks | |
| MarketCap: 152.559 Millions | |
| Recent Price: 17.60 Smart Investing & Trading Score: 7 | |
| Day Percent Change: 1.85% Day Change: 0.32 | |
| Week Change: -2% Year-to-date Change: -21.8% | |
| PWOD Links: Profile News Message Board | |
| Charts:- Daily , Weekly | |
| Add PWOD to Watchlist: View: Get Complete PWOD Trend Analysis ➞ | |
 | PFSI PennyMac Financial Services, Inc. |
| Sector: Financials | |
| SubSector: Mortgage Investment | |
| MarketCap: 1588.09 Millions | |
| Recent Price: 86.20 Smart Investing & Trading Score: 81 | |
| Day Percent Change: -6.38% Day Change: -5.87 | |
| Week Change: -2% Year-to-date Change: -2.5% | |
| PFSI Links: Profile News Message Board | |
| Charts:- Daily , Weekly | |
| Add PFSI to Watchlist: View: Get Complete PFSI Trend Analysis ➞ | |
 | PRAA PRA Group, Inc. |
| Sector: Services & Goods | |
| SubSector: Business Services | |
| MarketCap: 1290.32 Millions | |
| Recent Price: 23.88 Smart Investing & Trading Score: 68 | |
| Day Percent Change: -3.67% Day Change: -0.91 | |
| Week Change: -2.01% Year-to-date Change: -8.9% | |
| PRAA Links: Profile News Message Board | |
| Charts:- Daily , Weekly | |
| Add PRAA to Watchlist: View: Get Complete PRAA Trend Analysis ➞ | |
 | JACK Jack in the Box Inc. |
| Sector: Services & Goods | |
| SubSector: Restaurants | |
| MarketCap: 633.87 Millions | |
| Recent Price: 58.44 Smart Investing & Trading Score: 27 | |
| Day Percent Change: -0.70% Day Change: -0.41 | |
| Week Change: -2.01% Year-to-date Change: -28.4% | |
| JACK Links: Profile News Message Board | |
| Charts:- Daily , Weekly | |
| Add JACK to Watchlist: View: Get Complete JACK Trend Analysis ➞ | |
 | FMNB Farmers National Banc Corp. |
| Sector: Financials | |
| SubSector: Regional - Midwest Banks | |
| MarketCap: 366.57 Millions | |
| Recent Price: 12.16 Smart Investing & Trading Score: 42 | |
| Day Percent Change: -1.78% Day Change: -0.22 | |
| Week Change: -2.01% Year-to-date Change: -15.9% | |
| FMNB Links: Profile News Message Board | |
| Charts:- Daily , Weekly | |
| Add FMNB to Watchlist: View: Get Complete FMNB Trend Analysis ➞ | |
 | CRGY Crescent Energy Company |
| Sector: Energy | |
| SubSector: Oil & Gas E&P | |
| MarketCap: 1700 Millions | |
| Recent Price: 10.75 Smart Investing & Trading Score: 0 | |
| Day Percent Change: 0.37% Day Change: 0.04 | |
| Week Change: -2.01% Year-to-date Change: -18.5% | |
| CRGY Links: Profile News Message Board | |
| Charts:- Daily , Weekly | |
| Add CRGY to Watchlist: View: Get Complete CRGY Trend Analysis ➞ | |
 | WDFC WD-40 Company |
| Sector: Materials | |
| SubSector: Specialty Chemicals | |
| MarketCap: 2900.57 Millions | |
| Recent Price: 225.20 Smart Investing & Trading Score: 10 | |
| Day Percent Change: -0.66% Day Change: -1.49 | |
| Week Change: -2.02% Year-to-date Change: -5.8% | |
| WDFC Links: Profile News Message Board | |
| Charts:- Daily , Weekly | |
| Add WDFC to Watchlist: View: Get Complete WDFC Trend Analysis ➞ | |
 | PDLB PDL Community Bancorp |
| Sector: Financials | |
| SubSector: REIT - Retail | |
| MarketCap: 206.114 Millions | |
| Recent Price: 8.18 Smart Investing & Trading Score: 42 | |
| Day Percent Change: -1.80% Day Change: -0.15 | |
| Week Change: -2.04% Year-to-date Change: -16.2% | |
| PDLB Links: Profile News Message Board | |
| Charts:- Daily , Weekly | |
| Add PDLB to Watchlist: View: Get Complete PDLB Trend Analysis ➞ | |
| Too many stocks? View smallcap stocks filtered by marketcap & sector |
| Marketcap: All SmallCap Stocks (default-no microcap), Large, Mid-Range, Small & MicroCap |
| Sector: Tech, Finance, Energy, Staples, Retail, Industrial, Materials, Utilities & Medical |
|
Best Stocks Today 12Stocks.com |
© 2024 12Stocks.com Terms & Conditions Privacy Contact Us
All Information Provided Only For Education And Not To Be Used For Investing or Trading. See Terms & Conditions


One More Thing ... Get Best Stocks Delivered Daily!
Never Ever Miss A Move With Our Top Ten Stocks Lists
Find Best Stocks In Any Market - Bull or Bear Market
Take A Peek At Our Top Ten Stocks Lists: Daily, Weekly, Year-to-Date & Top Trends
Find Best Stocks In Any Market - Bull or Bear Market
Take A Peek At Our Top Ten Stocks Lists: Daily, Weekly, Year-to-Date & Top Trends
Smallcap Stocks With Best Up Trends [0-bearish to 100-bullish]: B. Riley[100], Central Pacific[100], California Water[100], Cricut [100], Carpenter [100], Haemonetics [100], Sanmina [100], Trustmark [100], Comstock Resources[100], EchoStar [100], Mueller Industries[100]
Best Smallcap Stocks Year-to-Date:
CareMax [490.72%], Janux [338.34%], Viking [270.02%], Alpine Immune[239.52%], Longboard [218%], Super Micro[177%], Arcutis Bio[166.56%], Avidity Biosciences[159.79%], Vera [149.94%], Hippo [128.87%], Stoke [122.15%] Best Smallcap Stocks This Week:
Matterport [168.97%], B. Riley[73.54%], Impinj [33.73%], ProKidney [32.84%], Seres [32.65%], Riot Blockchain[32.64%], Ribbon [25.58%], Cullinan Oncology[22.92%], P.A.M. Transportation[22.85%], NuScale Power[21.44%], Hibbett Sports[21.03%] Best Smallcap Stocks Daily:
Impinj [28.65%], P.A.M. Transportation[17.95%], B. Riley[16.61%], Strategic Education[16.28%], OptiNose [14.56%], JELD-WEN Holding[11.54%], Sonic Automotive[10.86%], Intevac [10.54%], SiTime [8.84%], Noodles & [8.08%], ProKidney [7.75%]