
 Login Sign Up


| |||||
 |  | ||||

| 12Stocks.com Market Intelligence |
Best SmallCap Stocks
|
| In a hurry? Small Cap Stock Lists: Performance Trends Table, Stock Charts
Sort Small Cap stocks: Daily, Weekly, Year-to-Date, Market Cap & Trends. Filter Small Cap stocks list by sector: Show all, Tech, Finance, Energy, Staples, Retail, Industrial, Materials, Utilities and HealthCare Filter Small Cap stocks list by size: All Large Medium Small and MicroCap |
| 12Stocks.com Small Cap Stocks Performances & Trends Daily | |||||||||
|
|  The overall Smart Investing & Trading Score is 65 (0-bearish to 100-bullish) which puts Small Cap index in short term neutral to bullish trend. The Smart Investing & Trading Score from previous trading session is 93 and hence a deterioration of trend.
| ||||||||
Here are the Smart Investing & Trading Scores of the most requested small cap stocks at 12Stocks.com (click stock name for detailed review):
|


| 12Stocks.com: Investing in Smallcap Index with Stocks | |
|
The following table helps investors and traders sort through current performance and trends (as measured by Smart Investing & Trading Score) of various
stocks in the Smallcap Index. Quick View: Move mouse or cursor over stock symbol (ticker) to view short-term technical chart and over stock name to view long term chart. Click on  to add stock symbol to your watchlist and to add stock symbol to your watchlist and  to view watchlist. Click on any ticker or stock name for detailed market intelligence report for that stock. to view watchlist. Click on any ticker or stock name for detailed market intelligence report for that stock. |
12Stocks.com Performance of Stocks in Smallcap Index
| Ticker | Stock Name | Watchlist | Category | Recent Price | Smart Investing & Trading Score | Change % | Weekly Change% |
| AUR | Aurora Innovation |   | Technology | 3.22 | 65 | -10.80% | -3.30% |
| GERN | Geron | | Health Care | 3.80 | 83 | -2.06% | -3.31% |
| GBTG | Global Business | | Technology | 5.98 | 31 | -0.33% | -3.31% |
| EOSE | Eos Energy | | Industrials | 0.72 | 37 | 6.95% | -3.33% |
| WW | WW | | Services & Goods | 2.02 | 39 | 2.02% | -3.35% |
| RC | Ready Capital | | Financials | 8.37 | 10 | -3.52% | -3.35% |
| IKNA | Ikena Oncology | | Health Care | 1.29 | 17 | -4.44% | -3.37% |
| WISH | ContextLogic | | Services & Goods | 5.13 | 5 | -0.97% | -3.39% |
| ACRV | Acrivon | | Health Care | 8.77 | 53 | 7.74% | -3.41% |
| EVEX | Eve Holding | | Industrials | 5.23 | 20 | -2.06% | -3.42% |
| PD | PagerDuty | | Technology | 19.69 | 0 | -0.76% | -3.43% |
| INFN | Infinera | | Technology | 5.06 | 45 | 0.00% | -3.44% |
| LMNR | Limoneira | | Consumer Staples | 21.23 | 90 | 0.05% | -3.46% |
| SGHC | Super Group | | Services & Goods | 3.35 | 61 | -4.29% | -3.46% |
| MSTR | MicroStrategy | | Technology | 1180.48 | 53 | -6.58% | -3.48% |
| EXTR | Extreme s | | Technology | 10.81 | 27 | 2.17% | -3.48% |
| HCC | Warrior Met | | Materials | 63.91 | 26 | -3.24% | -3.50% |
| ANGO | AngioDynamics | | Health Care | 6.05 | 60 | -1.14% | -3.51% |
| JAMF | Jamf Holding | | Technology | 19.51 | 68 | -2.21% | -3.51% |
| RSVR | Reservoir Media | | Services & Goods | 8.38 | 46 | -0.24% | -3.51% |
| CHUY | Chuy s | | Services & Goods | 28.10 | 28 | -5.45% | -3.54% |
| KPTI | Karyopharm | | Health Care | 1.09 | 20 | 1.87% | -3.54% |
| ASAN | Asana | | Technology | 15.16 | 32 | 2.36% | -3.56% |
| IRTC | iRhythm | | Health Care | 99.01 | 0 | -0.87% | -3.57% |
| GPOR | Gulfport Energy | | Energy | 147.71 | 26 | -3.44% | -3.58% |


| Too many stocks? View smallcap stocks filtered by marketcap & sector |
| Marketcap: All SmallCap Stocks (default-no microcap), Large, Mid-Range, Small |
| Smallcap Sector: Tech, Finance, Energy, Staples, Retail, Industrial, Materials, & Medical |
|
Get the most comprehensive stock market coverage daily at 12Stocks.com ➞ Best Stocks Today ➞ Best Stocks Weekly ➞ Best Stocks Year-to-Date ➞ Best Stocks Trends ➞  Best Stocks Today 12Stocks.com Best Nasdaq Stocks ➞ Best S&P 500 Stocks ➞ Best Tech Stocks ➞ Best Biotech Stocks ➞ |
| Detailed Overview of SmallCap Stocks |
| SmallCap Technical Overview, Leaders & Laggards, Top SmallCap ETF Funds & Detailed SmallCap Stocks List, Charts, Trends & More |
| Smallcap: Technical Analysis, Trends & YTD Performance | |
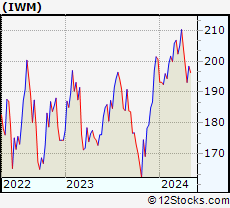
| SmallCap segment as represented by
IWM, an exchange-traded fund [ETF], holds basket of thousands of smallcap stocks from across all major sectors of the US stock market. The smallcap index (contains stocks like Riverbed & Sotheby's) is up by 1.79% and is currently underperforming the overall market by -6.99% year-to-date. Below is a quick view of technical charts and trends: | |
 IWM Weekly Chart |
|
| Long Term Trend: Very Good | |
| Medium Term Trend: Very Good | |
 IWM Daily Chart |
|
| Short Term Trend: Not Good | |
| Overall Trend Score: 65 | |
| YTD Performance: 1.79% | |
| **Trend Scores & Views Are Only For Educational Purposes And Not For Investing | |
| 12Stocks.com: Top Performing Small Cap Index Stocks | ||||||||||||||||||||||||||||||||||||||||||||||||
 The top performing Small Cap Index stocks year to date are
Now, more recently, over last week, the top performing Small Cap Index stocks on the move are


|
||||||||||||||||||||||||||||||||||||||||||||||||
| 12Stocks.com: Investing in Smallcap Index using Exchange Traded Funds | |
|
The following table shows list of key exchange traded funds (ETF) that
help investors track Smallcap index. The following list also includes leveraged ETF funds that track twice or thrice the daily returns of Smallcap indices. Short or inverse ETF funds move in the opposite direction to the index they track and are useful during market pullbacks or during bear markets. Quick View: Move mouse or cursor over ETF symbol (ticker) to view short-term technical chart and over ETF name to view long term chart. Click on ticker or stock name for detailed view. Click on to add stock symbol to your watchlist and to view watchlist. |
12Stocks.com List of ETFs that track Smallcap Index
| Ticker | ETF Name | Watchlist | Recent Price | Smart Investing & Trading Score | Change % | Week % | Year-to-date % |
| IWM | iShares Russell 2000 | | 204.31 | 65 | -0.75 | 1.19 | 1.79% |
| IJR | iShares Core S&P Small-Cap | | 108.98 | 88 | -0.53 | 1.73 | 0.67% |
| IWN | iShares Russell 2000 Value | | 156.19 | 88 | -0.61 | 1.28 | 0.55% |
| VTWO | Vanguard Russell 2000 ETF | | 82.63 | 58 | -0.68 | 1.24 | 1.88% |
| IWO | iShares Russell 2000 Growth | | 259.92 | 57 | -0.76 | 1.19 | 3.05% |
| IJS | iShares S&P Small-Cap 600 Value | | 100.52 | 60 | -0.46 | 1.82 | -2.47% |
| IJT | iShares S&P Small-Cap 600 Growth | | 129.86 | 76 | -0.51 | 1.64 | 3.77% |
| XSLV | PowerShares S&P SmallCap Low Volatil ETF | | 44.23 | 83 | -0.47 | 2.34 | 0.18% |
| SBB | ProShares Short SmallCap600 | | 15.96 | 18 | 0.47 | -1.27 | 0.16% |
| SMLV | SPDR SSGA US Small Cap Low Volatil ETF | | 111.22 | 95 | -0.48 | 1.4 | -1.16% |
| SDD | ProShares UltraShort SmallCap600 | | 18.28 | 28 | 0.19 | -3 | -0.8% |
| SAA | ProShares Ultra SmallCap600 | | 24.35 | 90 | -0.40 | 3.22 | -2.4% |
| 12Stocks.com: Charts, Trends, Fundamental Data and Performances of SmallCap Stocks | |
|
We now take in-depth look at all SmallCap stocks including charts, multi-period performances and overall trends (as measured by Smart Investing & Trading Score). One can sort SmallCap stocks (click link to choose) by Daily, Weekly and by Year-to-Date performances. Also, one can sort by size of the company or by market capitalization. |
| Select Your Default Chart Type: | |||||
| |||||
| Click on stock symbol or name for detailed view. Click on to add stock symbol to your watchlist and to view watchlist. Quick View: Move mouse or cursor over "Daily" to quickly view daily technical stock chart and over "Weekly" to view weekly technical stock chart. | |||||

 | AUR Aurora Innovation, Inc. |
| Sector: Technology | |
| SubSector: Information Technology Services | |
| MarketCap: 3220 Millions | |
| Recent Price: 3.22 Smart Investing & Trading Score: 65 | |
| Day Percent Change: -10.80% Day Change: -0.39 | |
| Week Change: -3.3% Year-to-date Change: -26.9% | |
| AUR Links: Profile News Message Board | |
| Charts:- Daily , Weekly | |
| Add AUR to Watchlist: View: Get Complete AUR Trend Analysis ➞ | |
 | GERN Geron Corporation |
| Sector: Health Care | |
| SubSector: Biotechnology | |
| MarketCap: 228.685 Millions | |
| Recent Price: 3.80 Smart Investing & Trading Score: 83 | |
| Day Percent Change: -2.06% Day Change: -0.08 | |
| Week Change: -3.31% Year-to-date Change: 80.1% | |
| GERN Links: Profile News Message Board | |
| Charts:- Daily , Weekly | |
| Add GERN to Watchlist: View: Get Complete GERN Trend Analysis ➞ | |
 | GBTG Global Business Travel Group, Inc. |
| Sector: Technology | |
| SubSector: Software - Application | |
| MarketCap: 3440 Millions | |
| Recent Price: 5.98 Smart Investing & Trading Score: 31 | |
| Day Percent Change: -0.33% Day Change: -0.02 | |
| Week Change: -3.31% Year-to-date Change: -8.4% | |
| GBTG Links: Profile News Message Board | |
| Charts:- Daily , Weekly | |
| Add GBTG to Watchlist: View: Get Complete GBTG Trend Analysis ➞ | |
 | EOSE Eos Energy Enterprises, Inc. |
| Sector: Industrials | |
| SubSector: Electrical Equipment & Parts | |
| MarketCap: 76627 Millions | |
| Recent Price: 0.72 Smart Investing & Trading Score: 37 | |
| Day Percent Change: 6.95% Day Change: 0.05 | |
| Week Change: -3.33% Year-to-date Change: -33.8% | |
| EOSE Links: Profile News Message Board | |
| Charts:- Daily , Weekly | |
| Add EOSE to Watchlist: View: Get Complete EOSE Trend Analysis ➞ | |
 | WW WW International, Inc. |
| Sector: Services & Goods | |
| SubSector: Personal Services | |
| MarketCap: 1186.25 Millions | |
| Recent Price: 2.02 Smart Investing & Trading Score: 39 | |
| Day Percent Change: 2.02% Day Change: 0.04 | |
| Week Change: -3.35% Year-to-date Change: -76.9% | |
| WW Links: Profile News Message Board | |
| Charts:- Daily , Weekly | |
| Add WW to Watchlist: View: Get Complete WW Trend Analysis ➞ | |
 | RC Ready Capital Corporation |
| Sector: Financials | |
| SubSector: Mortgage Investment | |
| MarketCap: 358.039 Millions | |
| Recent Price: 8.37 Smart Investing & Trading Score: 10 | |
| Day Percent Change: -3.52% Day Change: -0.31 | |
| Week Change: -3.35% Year-to-date Change: -18.3% | |
| RC Links: Profile News Message Board | |
| Charts:- Daily , Weekly | |
| Add RC to Watchlist: View: Get Complete RC Trend Analysis ➞ | |
 | IKNA Ikena Oncology, Inc. |
| Sector: Health Care | |
| SubSector: Biotechnology | |
| MarketCap: 277 Millions | |
| Recent Price: 1.29 Smart Investing & Trading Score: 17 | |
| Day Percent Change: -4.44% Day Change: -0.06 | |
| Week Change: -3.37% Year-to-date Change: -35.5% | |
| IKNA Links: Profile News Message Board | |
| Charts:- Daily , Weekly | |
| Add IKNA to Watchlist: View: Get Complete IKNA Trend Analysis ➞ | |
 | WISH ContextLogic Inc. |
| Sector: Services & Goods | |
| SubSector: Internet Retail | |
| MarketCap: 165 Millions | |
| Recent Price: 5.13 Smart Investing & Trading Score: 5 | |
| Day Percent Change: -0.97% Day Change: -0.05 | |
| Week Change: -3.39% Year-to-date Change: -13.7% | |
| WISH Links: Profile News Message Board | |
| Charts:- Daily , Weekly | |
| Add WISH to Watchlist: View: Get Complete WISH Trend Analysis ➞ | |
 | ACRV Acrivon Therapeutics, Inc. |
| Sector: Health Care | |
| SubSector: Biotechnology | |
| MarketCap: 286 Millions | |
| Recent Price: 8.77 Smart Investing & Trading Score: 53 | |
| Day Percent Change: 7.74% Day Change: 0.63 | |
| Week Change: -3.41% Year-to-date Change: 76.5% | |
| ACRV Links: Profile News Message Board | |
| Charts:- Daily , Weekly | |
| Add ACRV to Watchlist: View: Get Complete ACRV Trend Analysis ➞ | |
 | EVEX Eve Holding, Inc. |
| Sector: Industrials | |
| SubSector: Aerospace & Defense | |
| MarketCap: 2830 Millions | |
| Recent Price: 5.23 Smart Investing & Trading Score: 20 | |
| Day Percent Change: -2.06% Day Change: -0.11 | |
| Week Change: -3.42% Year-to-date Change: -28.9% | |
| EVEX Links: Profile News Message Board | |
| Charts:- Daily , Weekly | |
| Add EVEX to Watchlist: View: Get Complete EVEX Trend Analysis ➞ | |
 | PD PagerDuty, Inc. |
| Sector: Technology | |
| SubSector: Application Software | |
| MarketCap: 1690.32 Millions | |
| Recent Price: 19.69 Smart Investing & Trading Score: 0 | |
| Day Percent Change: -0.76% Day Change: -0.15 | |
| Week Change: -3.43% Year-to-date Change: -15.0% | |
| PD Links: Profile News Message Board | |
| Charts:- Daily , Weekly | |
| Add PD to Watchlist: View: Get Complete PD Trend Analysis ➞ | |
 | INFN Infinera Corporation |
| Sector: Technology | |
| SubSector: Communication Equipment | |
| MarketCap: 943 Millions | |
| Recent Price: 5.06 Smart Investing & Trading Score: 45 | |
| Day Percent Change: 0.00% Day Change: 0.00 | |
| Week Change: -3.44% Year-to-date Change: 6.5% | |
| INFN Links: Profile News Message Board | |
| Charts:- Daily , Weekly | |
| Add INFN to Watchlist: View: Get Complete INFN Trend Analysis ➞ | |
 | LMNR Limoneira Company |
| Sector: Consumer Staples | |
| SubSector: Farm Products | |
| MarketCap: 324.987 Millions | |
| Recent Price: 21.23 Smart Investing & Trading Score: 90 | |
| Day Percent Change: 0.05% Day Change: 0.01 | |
| Week Change: -3.46% Year-to-date Change: 2.9% | |
| LMNR Links: Profile News Message Board | |
| Charts:- Daily , Weekly | |
| Add LMNR to Watchlist: View: Get Complete LMNR Trend Analysis ➞ | |
 | SGHC Super Group (SGHC) Limited |
| Sector: Services & Goods | |
| SubSector: Gambling | |
| MarketCap: 1390 Millions | |
| Recent Price: 3.35 Smart Investing & Trading Score: 61 | |
| Day Percent Change: -4.29% Day Change: -0.15 | |
| Week Change: -3.46% Year-to-date Change: 4.9% | |
| SGHC Links: Profile News Message Board | |
| Charts:- Daily , Weekly | |
| Add SGHC to Watchlist: View: Get Complete SGHC Trend Analysis ➞ | |
 | MSTR MicroStrategy Incorporated |
| Sector: Technology | |
| SubSector: Application Software | |
| MarketCap: 1164.52 Millions | |
| Recent Price: 1180.48 Smart Investing & Trading Score: 53 | |
| Day Percent Change: -6.58% Day Change: -83.16 | |
| Week Change: -3.48% Year-to-date Change: 86.9% | |
| MSTR Links: Profile News Message Board | |
| Charts:- Daily , Weekly | |
| Add MSTR to Watchlist: View: Get Complete MSTR Trend Analysis ➞ | |
 | EXTR Extreme Networks, Inc. |
| Sector: Technology | |
| SubSector: Communication Equipment | |
| MarketCap: 339.939 Millions | |
| Recent Price: 10.81 Smart Investing & Trading Score: 27 | |
| Day Percent Change: 2.17% Day Change: 0.23 | |
| Week Change: -3.48% Year-to-date Change: -38.7% | |
| EXTR Links: Profile News Message Board | |
| Charts:- Daily , Weekly | |
| Add EXTR to Watchlist: View: Get Complete EXTR Trend Analysis ➞ | |
 | HCC Warrior Met Coal, Inc. |
| Sector: Materials | |
| SubSector: Industrial Metals & Minerals | |
| MarketCap: 748.81 Millions | |
| Recent Price: 63.91 Smart Investing & Trading Score: 26 | |
| Day Percent Change: -3.24% Day Change: -2.14 | |
| Week Change: -3.5% Year-to-date Change: 4.8% | |
| HCC Links: Profile News Message Board | |
| Charts:- Daily , Weekly | |
| Add HCC to Watchlist: View: Get Complete HCC Trend Analysis ➞ | |
 | ANGO AngioDynamics, Inc. |
| Sector: Health Care | |
| SubSector: Medical Instruments & Supplies | |
| MarketCap: 370.86 Millions | |
| Recent Price: 6.05 Smart Investing & Trading Score: 60 | |
| Day Percent Change: -1.14% Day Change: -0.07 | |
| Week Change: -3.51% Year-to-date Change: -22.8% | |
| ANGO Links: Profile News Message Board | |
| Charts:- Daily , Weekly | |
| Add ANGO to Watchlist: View: Get Complete ANGO Trend Analysis ➞ | |
 | JAMF Jamf Holding Corp. |
| Sector: Technology | |
| SubSector: Software Application | |
| MarketCap: 36987 Millions | |
| Recent Price: 19.51 Smart Investing & Trading Score: 68 | |
| Day Percent Change: -2.21% Day Change: -0.44 | |
| Week Change: -3.51% Year-to-date Change: 8.0% | |
| JAMF Links: Profile News Message Board | |
| Charts:- Daily , Weekly | |
| Add JAMF to Watchlist: View: Get Complete JAMF Trend Analysis ➞ | |
 | RSVR Reservoir Media, Inc. |
| Sector: Services & Goods | |
| SubSector: Entertainment | |
| MarketCap: 389 Millions | |
| Recent Price: 8.38 Smart Investing & Trading Score: 46 | |
| Day Percent Change: -0.24% Day Change: -0.02 | |
| Week Change: -3.51% Year-to-date Change: 17.7% | |
| RSVR Links: Profile News Message Board | |
| Charts:- Daily , Weekly | |
| Add RSVR to Watchlist: View: Get Complete RSVR Trend Analysis ➞ | |
 | CHUY Chuy s Holdings, Inc. |
| Sector: Services & Goods | |
| SubSector: Restaurants | |
| MarketCap: 159.17 Millions | |
| Recent Price: 28.10 Smart Investing & Trading Score: 28 | |
| Day Percent Change: -5.45% Day Change: -1.62 | |
| Week Change: -3.54% Year-to-date Change: -26.5% | |
| CHUY Links: Profile News Message Board | |
| Charts:- Daily , Weekly | |
| Add CHUY to Watchlist: View: Get Complete CHUY Trend Analysis ➞ | |
 | KPTI Karyopharm Therapeutics Inc. |
| Sector: Health Care | |
| SubSector: Biotechnology | |
| MarketCap: 1471.85 Millions | |
| Recent Price: 1.09 Smart Investing & Trading Score: 20 | |
| Day Percent Change: 1.87% Day Change: 0.02 | |
| Week Change: -3.54% Year-to-date Change: 26.0% | |
| KPTI Links: Profile News Message Board | |
| Charts:- Daily , Weekly | |
| Add KPTI to Watchlist: View: Get Complete KPTI Trend Analysis ➞ | |
 | ASAN Asana, Inc. |
| Sector: Technology | |
| SubSector: Software Application | |
| MarketCap: 45087 Millions | |
| Recent Price: 15.16 Smart Investing & Trading Score: 32 | |
| Day Percent Change: 2.36% Day Change: 0.35 | |
| Week Change: -3.56% Year-to-date Change: -20.3% | |
| ASAN Links: Profile News Message Board | |
| Charts:- Daily , Weekly | |
| Add ASAN to Watchlist: View: Get Complete ASAN Trend Analysis ➞ | |
 | IRTC iRhythm Technologies, Inc. |
| Sector: Health Care | |
| SubSector: Medical Instruments & Supplies | |
| MarketCap: 2167.9 Millions | |
| Recent Price: 99.01 Smart Investing & Trading Score: 0 | |
| Day Percent Change: -0.87% Day Change: -0.87 | |
| Week Change: -3.57% Year-to-date Change: -7.5% | |
| IRTC Links: Profile News Message Board | |
| Charts:- Daily , Weekly | |
| Add IRTC to Watchlist: View: Get Complete IRTC Trend Analysis ➞ | |
 | GPOR Gulfport Energy Corporation |
| Sector: Energy | |
| SubSector: Oil & Gas E&P | |
| MarketCap: 1890 Millions | |
| Recent Price: 147.71 Smart Investing & Trading Score: 26 | |
| Day Percent Change: -3.44% Day Change: -5.26 | |
| Week Change: -3.58% Year-to-date Change: 10.9% | |
| GPOR Links: Profile News Message Board | |
| Charts:- Daily , Weekly | |
| Add GPOR to Watchlist: View: Get Complete GPOR Trend Analysis ➞ | |
| Too many stocks? View smallcap stocks filtered by marketcap & sector |
| Marketcap: All SmallCap Stocks (default-no microcap), Large, Mid-Range, Small & MicroCap |
| Sector: Tech, Finance, Energy, Staples, Retail, Industrial, Materials, Utilities & Medical |
|
Best Stocks Today 12Stocks.com |
© 2024 12Stocks.com Terms & Conditions Privacy Contact Us
All Information Provided Only For Education And Not To Be Used For Investing or Trading. See Terms & Conditions


One More Thing ... Get Best Stocks Delivered Daily!
Never Ever Miss A Move With Our Top Ten Stocks Lists
Find Best Stocks In Any Market - Bull or Bear Market
Take A Peek At Our Top Ten Stocks Lists: Daily, Weekly, Year-to-Date & Top Trends
Find Best Stocks In Any Market - Bull or Bear Market
Take A Peek At Our Top Ten Stocks Lists: Daily, Weekly, Year-to-Date & Top Trends
Smallcap Stocks With Best Up Trends [0-bearish to 100-bullish]: iTeos [100], CareDx [100], ADMA Biologics[100], Guardant Health[100], Nelnet [100], RE/MAX [100], BioLife Solutions[100], ProKidney [100], MRC Global[100], Redwire [100], Consensus Cloud[100]
Best Smallcap Stocks Year-to-Date:
CareMax [516.49%], Janux [355.28%], Bakkt [341.26%], Viking [295.78%], Alpine Immune[241.07%], Longboard [229.3%], Avidity Biosciences[187.17%], Super Micro[180.9%], Sweetgreen [176.46%], Vera [166.93%], Cullinan Oncology[160.62%] Best Smallcap Stocks This Week:
Novavax [80.12%], Innodata [61.16%], DASAN Zhone[59.62%], Consensus Cloud[53.8%], Perficient [52.98%], CareDx [52.57%], iTeos [49.76%], Bakkt [47.31%], Sweetgreen [41.36%], Children s[41.26%], Telephone and[40.25%] Best Smallcap Stocks Daily:
Novavax [98.66%], iTeos [43.07%], CareDx [34.09%], Organogenesis [32.89%], Sweetgreen [30.79%], ADMA Biologics[27.13%], TELA Bio[16.80%], SkyWater [14.89%], Integral Ad[13.72%], Sharecare [12.94%], Harrow Health[12.73%]