
 Login Sign Up


| |||||
 |  | ||||

| 12Stocks.com Market Intelligence |
Best SmallCap Stocks
|
| In a hurry? Small Cap Stock Lists: Performance Trends Table, Stock Charts
Sort Small Cap stocks: Daily, Weekly, Year-to-Date, Market Cap & Trends. Filter Small Cap stocks list by sector: Show all, Tech, Finance, Energy, Staples, Retail, Industrial, Materials, Utilities and HealthCare Filter Small Cap stocks list by size: All Large Medium Small and MicroCap |
| 12Stocks.com Small Cap Stocks Performances & Trends Daily | |||||||||
|
|  The overall Smart Investing & Trading Score is 63 (0-bearish to 100-bullish) which puts Small Cap index in short term neutral to bullish trend. The Smart Investing & Trading Score from previous trading session is 58 and an improvement of trend continues.
| ||||||||
Here are the Smart Investing & Trading Scores of the most requested small cap stocks at 12Stocks.com (click stock name for detailed review):
|


| 12Stocks.com: Investing in Smallcap Index with Stocks | |
|
The following table helps investors and traders sort through current performance and trends (as measured by Smart Investing & Trading Score) of various
stocks in the Smallcap Index. Quick View: Move mouse or cursor over stock symbol (ticker) to view short-term technical chart and over stock name to view long term chart. Click on  to add stock symbol to your watchlist and to add stock symbol to your watchlist and  to view watchlist. Click on any ticker or stock name for detailed market intelligence report for that stock. to view watchlist. Click on any ticker or stock name for detailed market intelligence report for that stock. |
12Stocks.com Performance of Stocks in Smallcap Index
| Ticker | Stock Name | Watchlist | Category | Recent Price | Smart Investing & Trading Score | Change % | Weekly Change% |
| ACCO | ACCO Brands |   | Consumer Staples | 4.89 | 35 | -1.71% | -0.51% |
| STEP | StepStone Group | | Financials | 35.23 | 36 | -1.56% | -0.51% |
| TRUE | TrueCar | | Technology | 2.90 | 49 | -3.50% | -0.52% |
| FARO | FARO | | Technology | 18.61 | 37 | -2.05% | -0.53% |
| IPI | Intrepid Potash | | Materials | 19.56 | 61 | -0.74% | -0.53% |
| ARTNA | Artesian Resources | | Utilities | 34.68 | 52 | -0.80% | -0.54% |
| TGNA | TEGNA | | Services & Goods | 13.74 | 52 | 0.18% | -0.54% |
| EQC | Equity Commonwealth | | Financials | 18.58 | 50 | -0.11% | -0.54% |
| EHTH | eHealth | | Financials | 4.46 | 27 | -1.87% | -0.56% |
| CNSL | Consolidated | | Technology | 4.25 | 5 | -0.12% | -0.59% |
| BCPC | Balchem | | Materials | 142.63 | 58 | -1.68% | -0.59% |
| BOH | Bank of Hawaii | | Financials | 58.05 | 28 | -0.26% | -0.60% |
| KRT | Karat Packaging | | Services & Goods | 26.67 | 51 | -1.91% | -0.60% |
| BHB | Bar Harbor | | Financials | 25.32 | 67 | 0.18% | -0.61% |
| SKIN | Beauty Health | | Consumer Staples | 3.25 | 46 | 0.62% | -0.61% |
| SMMF | Summit Financial | | Financials | 27.03 | 74 | -0.99% | -0.63% |
| FCCO | First Community | | Financials | 15.90 | 67 | -5.86% | -0.63% |
| ACRV | Acrivon | | Health Care | 9.33 | 56 | -4.99% | -0.64% |
| OMCL | Omnicell | | Technology | 27.65 | 74 | -2.74% | -0.65% |
| TBI | TrueBlue | | Services & Goods | 10.76 | 52 | -1.01% | -0.65% |
| BUSE | First Busey | | Financials | 22.66 | 67 | -2.62% | -0.66% |
| AGX | Argan | | Industrials | 61.51 | 90 | -0.19% | -0.66% |
| ATMU | Atmus Filtration | | Industrials | 30.66 | 46 | -1.11% | -0.66% |
| GNW | Genworth Financial | | Financials | 5.95 | 24 | -2.46% | -0.67% |
| ATSG | Air Transport | | Transports | 12.56 | 45 | -1.14% | -0.67% |
| For chart view version of above stock list: Chart View ➞ 0 - 25 , 25 - 50 , 50 - 75 , 75 - 100 , 100 - 125 , 125 - 150 , 150 - 175 , 175 - 200 , 200 - 225 , 225 - 250 , 250 - 275 , 275 - 300 , 300 - 325 , 325 - 350 , 350 - 375 , 375 - 400 , 400 - 425 , 425 - 450 , 450 - 475 , 475 - 500 , 500 - 525 , 525 - 550 , 550 - 575 , 575 - 600 , 600 - 625 , 625 - 650 , 650 - 675 , 675 - 700 , 700 - 725 , 725 - 750 , 750 - 775 , 775 - 800 , 800 - 825 , 825 - 850 , 850 - 875 , 875 - 900 , 900 - 925 , 925 - 950 , 950 - 975 , 975 - 1000 , 1000 - 1025 , 1025 - 1050 , 1050 - 1075 , 1075 - 1100 , 1100 - 1125 , 1125 - 1150 , 1150 - 1175 , 1175 - 1200 , 1200 - 1225 , 1225 - 1250 , 1250 - 1275 , 1275 - 1300 , 1300 - 1325 , 1325 - 1350 , 1350 - 1375 , 1375 - 1400 , 1400 - 1425 , 1425 - 1450 , 1450 - 1475 , 1475 - 1500 , 1500 - 1525 , 1525 - 1550 , 1550 - 1575 | ||
 | Click To Change The Sort Order: By Market Cap or Company Size Performance: Year-to-date, Week and Day |  |
| Too many stocks? View smallcap stocks filtered by marketcap & sector |
| Marketcap: All SmallCap Stocks (default-no microcap), Large, Mid-Range, Small |
| Smallcap Sector: Tech, Finance, Energy, Staples, Retail, Industrial, Materials, & Medical |
|
Get the most comprehensive stock market coverage daily at 12Stocks.com ➞ Best Stocks Today ➞ Best Stocks Weekly ➞ Best Stocks Year-to-Date ➞ Best Stocks Trends ➞  Best Stocks Today 12Stocks.com Best Nasdaq Stocks ➞ Best S&P 500 Stocks ➞ Best Tech Stocks ➞ Best Biotech Stocks ➞ |
| Detailed Overview of SmallCap Stocks |
| SmallCap Technical Overview, Leaders & Laggards, Top SmallCap ETF Funds & Detailed SmallCap Stocks List, Charts, Trends & More |
| Smallcap: Technical Analysis, Trends & YTD Performance | |
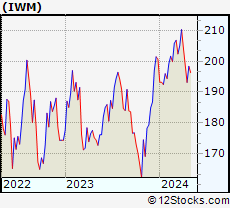
| SmallCap segment as represented by
IWM, an exchange-traded fund [ETF], holds basket of thousands of smallcap stocks from across all major sectors of the US stock market. The smallcap index (contains stocks like Riverbed & Sotheby's) is down by -1.75% and is currently underperforming the overall market by -7.09% year-to-date. Below is a quick view of technical charts and trends: | |
 IWM Weekly Chart |
|
| Long Term Trend: Good | |
| Medium Term Trend: Not Good | |
 IWM Daily Chart |
|
| Short Term Trend: Very Good | |
| Overall Trend Score: 63 | |
| YTD Performance: -1.75% | |
| **Trend Scores & Views Are Only For Educational Purposes And Not For Investing | |
| 12Stocks.com: Top Performing Small Cap Index Stocks | ||||||||||||||||||||||||||||||||||||||||||||||||
 The top performing Small Cap Index stocks year to date are
Now, more recently, over last week, the top performing Small Cap Index stocks on the move are


|
||||||||||||||||||||||||||||||||||||||||||||||||
| 12Stocks.com: Investing in Smallcap Index using Exchange Traded Funds | |
|
The following table shows list of key exchange traded funds (ETF) that
help investors track Smallcap index. The following list also includes leveraged ETF funds that track twice or thrice the daily returns of Smallcap indices. Short or inverse ETF funds move in the opposite direction to the index they track and are useful during market pullbacks or during bear markets. Quick View: Move mouse or cursor over ETF symbol (ticker) to view short-term technical chart and over ETF name to view long term chart. Click on ticker or stock name for detailed view. Click on to add stock symbol to your watchlist and to view watchlist. |
12Stocks.com List of ETFs that track Smallcap Index
| Ticker | ETF Name | Watchlist | Recent Price | Smart Investing & Trading Score | Change % | Week % | Year-to-date % |
| IWM | iShares Russell 2000 | | 197.19 | 63 | -0.69 | 2.1 | -1.75% |
| IJR | iShares Core S&P Small-Cap | | 105.72 | 85 | -0.23 | 2.42 | -2.34% |
| IWN | iShares Russell 2000 Value | | 151.29 | 75 | -0.30 | 2.38 | -2.6% |
| IWO | iShares Russell 2000 Growth | | 252.75 | 58 | 0.15 | 3.04 | 0.21% |
| 12Stocks.com: Charts, Trends, Fundamental Data and Performances of SmallCap Stocks | |
|
We now take in-depth look at all SmallCap stocks including charts, multi-period performances and overall trends (as measured by Smart Investing & Trading Score). One can sort SmallCap stocks (click link to choose) by Daily, Weekly and by Year-to-Date performances. Also, one can sort by size of the company or by market capitalization. |
| Select Your Default Chart Type: | |||||
| |||||
| Click on stock symbol or name for detailed view. Click on to add stock symbol to your watchlist and to view watchlist. Quick View: Move mouse or cursor over "Daily" to quickly view daily technical stock chart and over "Weekly" to view weekly technical stock chart. | |||||

 | ACCO ACCO Brands Corporation |
| Sector: Consumer Staples | |
| SubSector: Office Supplies | |
| MarketCap: 448.2 Millions | |
| Recent Price: 4.89 Smart Investing & Trading Score: 35 | |
| Day Percent Change: -1.71% Day Change: -0.09 | |
| Week Change: -0.51% Year-to-date Change: -19.5% | |
| ACCO Links: Profile News Message Board | |
| Charts:- Daily , Weekly | |
| Add ACCO to Watchlist: View: Get Complete ACCO Trend Analysis ➞ | |
 | STEP StepStone Group Inc. |
| Sector: Financials | |
| SubSector: Asset Management | |
| MarketCap: 30757 Millions | |
| Recent Price: 35.23 Smart Investing & Trading Score: 36 | |
| Day Percent Change: -1.56% Day Change: -0.56 | |
| Week Change: -0.51% Year-to-date Change: 10.7% | |
| STEP Links: Profile News Message Board | |
| Charts:- Daily , Weekly | |
| Add STEP to Watchlist: View: Get Complete STEP Trend Analysis ➞ | |
 | TRUE TrueCar, Inc. |
| Sector: Technology | |
| SubSector: Internet Service Providers | |
| MarketCap: 244.18 Millions | |
| Recent Price: 2.90 Smart Investing & Trading Score: 49 | |
| Day Percent Change: -3.50% Day Change: -0.10 | |
| Week Change: -0.52% Year-to-date Change: -16.3% | |
| TRUE Links: Profile News Message Board | |
| Charts:- Daily , Weekly | |
| Add TRUE to Watchlist: View: Get Complete TRUE Trend Analysis ➞ | |
 | FARO FARO Technologies, Inc. |
| Sector: Technology | |
| SubSector: Scientific & Technical Instruments | |
| MarketCap: 721.953 Millions | |
| Recent Price: 18.61 Smart Investing & Trading Score: 37 | |
| Day Percent Change: -2.05% Day Change: -0.39 | |
| Week Change: -0.53% Year-to-date Change: -17.4% | |
| FARO Links: Profile News Message Board | |
| Charts:- Daily , Weekly | |
| Add FARO to Watchlist: View: Get Complete FARO Trend Analysis ➞ | |
 | IPI Intrepid Potash, Inc. |
| Sector: Materials | |
| SubSector: Agricultural Chemicals | |
| MarketCap: 160.329 Millions | |
| Recent Price: 19.56 Smart Investing & Trading Score: 61 | |
| Day Percent Change: -0.74% Day Change: -0.14 | |
| Week Change: -0.53% Year-to-date Change: -18.2% | |
| IPI Links: Profile News Message Board | |
| Charts:- Daily , Weekly | |
| Add IPI to Watchlist: View: Get Complete IPI Trend Analysis ➞ | |
 | ARTNA Artesian Resources Corporation |
| Sector: Utilities | |
| SubSector: Water Utilities | |
| MarketCap: 299.402 Millions | |
| Recent Price: 34.68 Smart Investing & Trading Score: 52 | |
| Day Percent Change: -0.80% Day Change: -0.28 | |
| Week Change: -0.54% Year-to-date Change: -16.3% | |
| ARTNA Links: Profile News Message Board | |
| Charts:- Daily , Weekly | |
| Add ARTNA to Watchlist: View: Get Complete ARTNA Trend Analysis ➞ | |
 | TGNA TEGNA Inc. |
| Sector: Services & Goods | |
| SubSector: Broadcasting - TV | |
| MarketCap: 2791.83 Millions | |
| Recent Price: 13.74 Smart Investing & Trading Score: 52 | |
| Day Percent Change: 0.18% Day Change: 0.02 | |
| Week Change: -0.54% Year-to-date Change: -10.2% | |
| TGNA Links: Profile News Message Board | |
| Charts:- Daily , Weekly | |
| Add TGNA to Watchlist: View: Get Complete TGNA Trend Analysis ➞ | |
 | EQC Equity Commonwealth |
| Sector: Financials | |
| SubSector: REIT - Office | |
| MarketCap: 3659.36 Millions | |
| Recent Price: 18.58 Smart Investing & Trading Score: 50 | |
| Day Percent Change: -0.11% Day Change: -0.02 | |
| Week Change: -0.54% Year-to-date Change: -3.2% | |
| EQC Links: Profile News Message Board | |
| Charts:- Daily , Weekly | |
| Add EQC to Watchlist: View: Get Complete EQC Trend Analysis ➞ | |
 | EHTH eHealth, Inc. |
| Sector: Financials | |
| SubSector: Insurance Brokers | |
| MarketCap: 2813.57 Millions | |
| Recent Price: 4.46 Smart Investing & Trading Score: 27 | |
| Day Percent Change: -1.87% Day Change: -0.08 | |
| Week Change: -0.56% Year-to-date Change: -48.8% | |
| EHTH Links: Profile News Message Board | |
| Charts:- Daily , Weekly | |
| Add EHTH to Watchlist: View: Get Complete EHTH Trend Analysis ➞ | |
 | CNSL Consolidated Communications Holdings, Inc. |
| Sector: Technology | |
| SubSector: Telecom Services - Domestic | |
| MarketCap: 319.677 Millions | |
| Recent Price: 4.25 Smart Investing & Trading Score: 5 | |
| Day Percent Change: -0.12% Day Change: 0.00 | |
| Week Change: -0.59% Year-to-date Change: -2.4% | |
| CNSL Links: Profile News Message Board | |
| Charts:- Daily , Weekly | |
| Add CNSL to Watchlist: View: Get Complete CNSL Trend Analysis ➞ | |
 | BCPC Balchem Corporation |
| Sector: Materials | |
| SubSector: Specialty Chemicals | |
| MarketCap: 3330.17 Millions | |
| Recent Price: 142.63 Smart Investing & Trading Score: 58 | |
| Day Percent Change: -1.68% Day Change: -2.44 | |
| Week Change: -0.59% Year-to-date Change: -4.1% | |
| BCPC Links: Profile News Message Board | |
| Charts:- Daily , Weekly | |
| Add BCPC to Watchlist: View: Get Complete BCPC Trend Analysis ➞ | |
 | BOH Bank of Hawaii Corporation |
| Sector: Financials | |
| SubSector: Regional - Pacific Banks | |
| MarketCap: 2305.19 Millions | |
| Recent Price: 58.05 Smart Investing & Trading Score: 28 | |
| Day Percent Change: -0.26% Day Change: -0.15 | |
| Week Change: -0.6% Year-to-date Change: -19.9% | |
| BOH Links: Profile News Message Board | |
| Charts:- Daily , Weekly | |
| Add BOH to Watchlist: View: Get Complete BOH Trend Analysis ➞ | |
 | KRT Karat Packaging Inc. |
| Sector: Services & Goods | |
| SubSector: Packaging & Containers | |
| MarketCap: 357 Millions | |
| Recent Price: 26.67 Smart Investing & Trading Score: 51 | |
| Day Percent Change: -1.91% Day Change: -0.52 | |
| Week Change: -0.6% Year-to-date Change: 7.1% | |
| KRT Links: Profile News Message Board | |
| Charts:- Daily , Weekly | |
| Add KRT to Watchlist: View: Get Complete KRT Trend Analysis ➞ | |
 | BHB Bar Harbor Bankshares |
| Sector: Financials | |
| SubSector: Regional - Northeast Banks | |
| MarketCap: 298.099 Millions | |
| Recent Price: 25.32 Smart Investing & Trading Score: 67 | |
| Day Percent Change: 0.18% Day Change: 0.04 | |
| Week Change: -0.61% Year-to-date Change: -13.7% | |
| BHB Links: Profile News Message Board | |
| Charts:- Daily , Weekly | |
| Add BHB to Watchlist: View: Get Complete BHB Trend Analysis ➞ | |
 | SKIN The Beauty Health Company |
| Sector: Consumer Staples | |
| SubSector: Household & Personal Products | |
| MarketCap: 1070 Millions | |
| Recent Price: 3.25 Smart Investing & Trading Score: 46 | |
| Day Percent Change: 0.62% Day Change: 0.02 | |
| Week Change: -0.61% Year-to-date Change: 2.7% | |
| SKIN Links: Profile News Message Board | |
| Charts:- Daily , Weekly | |
| Add SKIN to Watchlist: View: Get Complete SKIN Trend Analysis ➞ | |
 | SMMF Summit Financial Group, Inc. |
| Sector: Financials | |
| SubSector: Regional - Mid-Atlantic Banks | |
| MarketCap: 228.959 Millions | |
| Recent Price: 27.03 Smart Investing & Trading Score: 74 | |
| Day Percent Change: -0.99% Day Change: -0.27 | |
| Week Change: -0.63% Year-to-date Change: -11.9% | |
| SMMF Links: Profile News Message Board | |
| Charts:- Daily , Weekly | |
| Add SMMF to Watchlist: View: Get Complete SMMF Trend Analysis ➞ | |
 | FCCO First Community Corporation |
| Sector: Financials | |
| SubSector: Regional - Southwest Banks | |
| MarketCap: 123.865 Millions | |
| Recent Price: 15.90 Smart Investing & Trading Score: 67 | |
| Day Percent Change: -5.86% Day Change: -0.99 | |
| Week Change: -0.63% Year-to-date Change: -26.2% | |
| FCCO Links: Profile News Message Board | |
| Charts:- Daily , Weekly | |
| Add FCCO to Watchlist: View: Get Complete FCCO Trend Analysis ➞ | |
 | ACRV Acrivon Therapeutics, Inc. |
| Sector: Health Care | |
| SubSector: Biotechnology | |
| MarketCap: 286 Millions | |
| Recent Price: 9.33 Smart Investing & Trading Score: 56 | |
| Day Percent Change: -4.99% Day Change: -0.49 | |
| Week Change: -0.64% Year-to-date Change: 87.7% | |
| ACRV Links: Profile News Message Board | |
| Charts:- Daily , Weekly | |
| Add ACRV to Watchlist: View: Get Complete ACRV Trend Analysis ➞ | |
 | OMCL Omnicell, Inc. |
| Sector: Technology | |
| SubSector: Healthcare Information Services | |
| MarketCap: 2781.05 Millions | |
| Recent Price: 27.65 Smart Investing & Trading Score: 74 | |
| Day Percent Change: -2.74% Day Change: -0.78 | |
| Week Change: -0.65% Year-to-date Change: -26.5% | |
| OMCL Links: Profile News Message Board | |
| Charts:- Daily , Weekly | |
| Add OMCL to Watchlist: View: Get Complete OMCL Trend Analysis ➞ | |
 | TBI TrueBlue, Inc. |
| Sector: Services & Goods | |
| SubSector: Staffing & Outsourcing Services | |
| MarketCap: 563.228 Millions | |
| Recent Price: 10.76 Smart Investing & Trading Score: 52 | |
| Day Percent Change: -1.01% Day Change: -0.11 | |
| Week Change: -0.65% Year-to-date Change: -29.9% | |
| TBI Links: Profile News Message Board | |
| Charts:- Daily , Weekly | |
| Add TBI to Watchlist: View: Get Complete TBI Trend Analysis ➞ | |
 | BUSE First Busey Corporation |
| Sector: Financials | |
| SubSector: Regional - Midwest Banks | |
| MarketCap: 876.97 Millions | |
| Recent Price: 22.66 Smart Investing & Trading Score: 67 | |
| Day Percent Change: -2.62% Day Change: -0.61 | |
| Week Change: -0.66% Year-to-date Change: -8.7% | |
| BUSE Links: Profile News Message Board | |
| Charts:- Daily , Weekly | |
| Add BUSE to Watchlist: View: Get Complete BUSE Trend Analysis ➞ | |
 | AGX Argan, Inc. |
| Sector: Industrials | |
| SubSector: Heavy Construction | |
| MarketCap: 664.095 Millions | |
| Recent Price: 61.51 Smart Investing & Trading Score: 90 | |
| Day Percent Change: -0.19% Day Change: -0.12 | |
| Week Change: -0.66% Year-to-date Change: 31.5% | |
| AGX Links: Profile News Message Board | |
| Charts:- Daily , Weekly | |
| Add AGX to Watchlist: View: Get Complete AGX Trend Analysis ➞ | |
 | ATMU Atmus Filtration Technologies Inc. |
| Sector: Industrials | |
| SubSector: Pollution & Treatment Controls | |
| MarketCap: 1830 Millions | |
| Recent Price: 30.66 Smart Investing & Trading Score: 46 | |
| Day Percent Change: -1.11% Day Change: -0.35 | |
| Week Change: -0.66% Year-to-date Change: 31.2% | |
| ATMU Links: Profile News Message Board | |
| Charts:- Daily , Weekly | |
| Add ATMU to Watchlist: View: Get Complete ATMU Trend Analysis ➞ | |
 | GNW Genworth Financial, Inc. |
| Sector: Financials | |
| SubSector: Life Insurance | |
| MarketCap: 1719.76 Millions | |
| Recent Price: 5.95 Smart Investing & Trading Score: 24 | |
| Day Percent Change: -2.46% Day Change: -0.15 | |
| Week Change: -0.67% Year-to-date Change: -10.9% | |
| GNW Links: Profile News Message Board | |
| Charts:- Daily , Weekly | |
| Add GNW to Watchlist: View: Get Complete GNW Trend Analysis ➞ | |
 | ATSG Air Transport Services Group, Inc. |
| Sector: Transports | |
| SubSector: Air Delivery & Freight Services | |
| MarketCap: 1111.68 Millions | |
| Recent Price: 12.56 Smart Investing & Trading Score: 45 | |
| Day Percent Change: -1.14% Day Change: -0.14 | |
| Week Change: -0.67% Year-to-date Change: -28.7% | |
| ATSG Links: Profile News Message Board | |
| Charts:- Daily , Weekly | |
| Add ATSG to Watchlist: View: Get Complete ATSG Trend Analysis ➞ | |
| For tabular summary view of above stock list: Summary View ➞ 0 - 25 , 25 - 50 , 50 - 75 , 75 - 100 , 100 - 125 , 125 - 150 , 150 - 175 , 175 - 200 , 200 - 225 , 225 - 250 , 250 - 275 , 275 - 300 , 300 - 325 , 325 - 350 , 350 - 375 , 375 - 400 , 400 - 425 , 425 - 450 , 450 - 475 , 475 - 500 , 500 - 525 , 525 - 550 , 550 - 575 , 575 - 600 , 600 - 625 , 625 - 650 , 650 - 675 , 675 - 700 , 700 - 725 , 725 - 750 , 750 - 775 , 775 - 800 , 800 - 825 , 825 - 850 , 850 - 875 , 875 - 900 , 900 - 925 , 925 - 950 , 950 - 975 , 975 - 1000 , 1000 - 1025 , 1025 - 1050 , 1050 - 1075 , 1075 - 1100 , 1100 - 1125 , 1125 - 1150 , 1150 - 1175 , 1175 - 1200 , 1200 - 1225 , 1225 - 1250 , 1250 - 1275 , 1275 - 1300 , 1300 - 1325 , 1325 - 1350 , 1350 - 1375 , 1375 - 1400 , 1400 - 1425 , 1425 - 1450 , 1450 - 1475 , 1475 - 1500 , 1500 - 1525 , 1525 - 1550 , 1550 - 1575 | ||
| Click To Change The Sort Order: By Market Cap or Company Size Performance: Year-to-date, Week and Day | |
| Select Chart Type: | ||
| Too many stocks? View smallcap stocks filtered by marketcap & sector |
| Marketcap: All SmallCap Stocks (default-no microcap), Large, Mid-Range, Small & MicroCap |
| Sector: Tech, Finance, Energy, Staples, Retail, Industrial, Materials, Utilities & Medical |
|
Best Stocks Today 12Stocks.com |
© 2024 12Stocks.com Terms & Conditions Privacy Contact Us
All Information Provided Only For Education And Not To Be Used For Investing or Trading. See Terms & Conditions


One More Thing ... Get Best Stocks Delivered Daily!
Never Ever Miss A Move With Our Top Ten Stocks Lists
Find Best Stocks In Any Market - Bull or Bear Market
Take A Peek At Our Top Ten Stocks Lists: Daily, Weekly, Year-to-Date & Top Trends
Find Best Stocks In Any Market - Bull or Bear Market
Take A Peek At Our Top Ten Stocks Lists: Daily, Weekly, Year-to-Date & Top Trends
Smallcap Stocks With Best Up Trends [0-bearish to 100-bullish]: Trustmark [100], Mueller Industries[100], Glaukos [100], Uniti Group[100], Wolverine World[100], Jamf Holding[100], Jackson Financial[100], NextNav [100], Napco Security[100], Central Pacific[100], Reservoir Media[100]
Best Smallcap Stocks Year-to-Date:
Janux [352.07%], Viking [259.7%], Alpine Immune[239.18%], Longboard [230.61%], Avidity Biosciences[176.77%], Super Micro[166.58%], Vera [149.61%], Hippo [131.72%], MicroStrategy [104.08%], SoundHound AI[103.27%], Trevi [101.87%] Best Smallcap Stocks This Week:
Matterport [166.09%], B. Riley[39.52%], Riot Blockchain[30.12%], Seres [30.01%], Ribbon [29.84%], ProKidney [23.28%], SoundHound AI[22.54%], Cipher Mining[22.14%], Babcock & Wilcox Enterprises[21.24%], Hibbett Sports[21.01%], Marathon Patent[20.06%] Best Smallcap Stocks Daily:
Ribbon [30.35%], B. Riley[28.41%], Babcock & Wilcox Enterprises[22.66%], Innodata [12.20%], Navitas Semiconductor[8.83%], K12 [8.21%], Cullinan Oncology[8.11%], Sage [8.03%], Vigil Neuroscience[7.92%], Annexon [7.66%], Group 1[5.92%]