
 Login Sign Up


| |||||
 |  | ||||

| 12Stocks.com Market Intelligence |
Best SmallCap Stocks
|
| In a hurry? Small Cap Stock Lists: Performance Trends Table, Stock Charts
Sort Small Cap stocks: Daily, Weekly, Year-to-Date, Market Cap & Trends. Filter Small Cap stocks list by sector: Show all, Tech, Finance, Energy, Staples, Retail, Industrial, Materials, Utilities and HealthCare Filter Small Cap stocks list by size: All Large Medium Small and MicroCap |
| 12Stocks.com Small Cap Stocks Performances & Trends Daily | |||||||||
|
|  The overall Smart Investing & Trading Score is 44 (0-bearish to 100-bullish) which puts Small Cap index in short term neutral trend. The Smart Investing & Trading Score from previous trading session is 58 and hence a deterioration of trend.
| ||||||||
Here are the Smart Investing & Trading Scores of the most requested small cap stocks at 12Stocks.com (click stock name for detailed review):
|


| 12Stocks.com: Investing in Smallcap Index with Stocks | |
|
The following table helps investors and traders sort through current performance and trends (as measured by Smart Investing & Trading Score) of various
stocks in the Smallcap Index. Quick View: Move mouse or cursor over stock symbol (ticker) to view short-term technical chart and over stock name to view long term chart. Click on  to add stock symbol to your watchlist and to add stock symbol to your watchlist and  to view watchlist. Click on any ticker or stock name for detailed market intelligence report for that stock. to view watchlist. Click on any ticker or stock name for detailed market intelligence report for that stock. |
12Stocks.com Performance of Stocks in Smallcap Index
| Ticker | Stock Name | Watchlist | Category | Recent Price | Smart Investing & Trading Score | Change % | Weekly Change% |
| CRNC | Cerence |   | Technology | 9.39 | 10 | -6.57% | -9.45% |
| LOB | Live Oak | | Financials | 34.28 | 66 | -14.02% | -9.55% |
| BEAM | Beam | | Health Care | 21.61 | 0 | -4.95% | -9.56% |
| NRIX | Nurix | | Health Care | 12.81 | 46 | -6.70% | -9.57% |
| OPFI | OppFi | | Financials | 2.70 | 25 | -5.92% | -9.70% |
| RYAM | Rayonier Advanced | | Materials | 3.88 | 10 | -5.83% | -9.77% |
| ACRV | Acrivon | | Health Care | 8.47 | 78 | -10.47% | -9.80% |
| IE | Ivanhoe Electric | | Materials | 9.55 | 36 | 1.92% | -9.91% |
| AMSF | Amerisafe | | Financials | 45.82 | 74 | -10.02% | -9.94% |
| LESL | Leslies | | Services & Goods | 3.99 | 0 | -6.23% | -10.03% |
| ULCC | Frontier Group | | Industrials | 6.25 | 36 | -2.11% | -10.20% |
| BRKL | Brookline Bancorp | | Financials | 8.42 | 45 | -11.74% | -10.23% |
| TRVI | Trevi | | Health Care | 2.53 | 38 | -5.60% | -10.28% |
| AVXL | Anavex Life | | Health Care | 3.39 | 0 | -0.59% | -10.32% |
| COGT | Cogint | | Technology | 6.01 | 5 | -8.10% | -10.43% |
| CUE | Cue Biopharma | | Health Care | 1.41 | 0 | -1.06% | -10.51% |
| BLUE | bluebird bio | | Health Care | 0.91 | 10 | -1.13% | -10.54% |
| THRD | Third Harmonic | | Health Care | 10.42 | 61 | -8.27% | -10.79% |
| RLYB | Rallybio | | Health Care | 1.57 | 36 | -1.26% | -10.80% |
| TPIC | TPI Composites | | Industrials | 2.39 | 20 | -3.24% | -10.82% |
| ONEW | OneWater Marine | | Services & Goods | 21.24 | 28 | -8.92% | -10.87% |
| SST | System1 | | Industrials | 1.79 | 36 | -4.79% | -10.95% |
| PACB | Pacific Biosciences | | Health Care | 1.38 | 10 | 1.47% | -10.97% |
| FHTX | Foghorn | | Health Care | 5.15 | 46 | -1.15% | -11.28% |
| FGEN | FibroGen | | Health Care | 1.02 | 20 | 3.63% | -11.30% |


| Too many stocks? View smallcap stocks filtered by marketcap & sector |
| Marketcap: All SmallCap Stocks (default-no microcap), Large, Mid-Range, Small |
| Smallcap Sector: Tech, Finance, Energy, Staples, Retail, Industrial, Materials, & Medical |
|
Get the most comprehensive stock market coverage daily at 12Stocks.com ➞ Best Stocks Today ➞ Best Stocks Weekly ➞ Best Stocks Year-to-Date ➞ Best Stocks Trends ➞  Best Stocks Today 12Stocks.com Best Nasdaq Stocks ➞ Best S&P 500 Stocks ➞ Best Tech Stocks ➞ Best Biotech Stocks ➞ |
| Detailed Overview of SmallCap Stocks |
| SmallCap Technical Overview, Leaders & Laggards, Top SmallCap ETF Funds & Detailed SmallCap Stocks List, Charts, Trends & More |
| Smallcap: Technical Analysis, Trends & YTD Performance | |
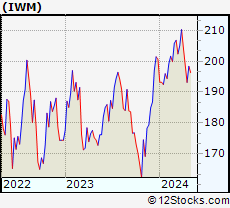
| SmallCap segment as represented by
IWM, an exchange-traded fund [ETF], holds basket of thousands of smallcap stocks from across all major sectors of the US stock market. The smallcap index (contains stocks like Riverbed & Sotheby's) is down by -2.11% and is currently underperforming the overall market by -7.27% year-to-date. Below is a quick view of technical charts and trends: | |
 IWM Weekly Chart |
|
| Long Term Trend: Good | |
| Medium Term Trend: Not Good | |
 IWM Daily Chart |
|
| Short Term Trend: Very Good | |
| Overall Trend Score: 44 | |
| YTD Performance: -2.11% | |
| **Trend Scores & Views Are Only For Educational Purposes And Not For Investing | |
| 12Stocks.com: Top Performing Small Cap Index Stocks | ||||||||||||||||||||||||||||||||||||||||||||||||
 The top performing Small Cap Index stocks year to date are
Now, more recently, over last week, the top performing Small Cap Index stocks on the move are


|
||||||||||||||||||||||||||||||||||||||||||||||||
| 12Stocks.com: Investing in Smallcap Index using Exchange Traded Funds | |
|
The following table shows list of key exchange traded funds (ETF) that
help investors track Smallcap index. The following list also includes leveraged ETF funds that track twice or thrice the daily returns of Smallcap indices. Short or inverse ETF funds move in the opposite direction to the index they track and are useful during market pullbacks or during bear markets. Quick View: Move mouse or cursor over ETF symbol (ticker) to view short-term technical chart and over ETF name to view long term chart. Click on ticker or stock name for detailed view. Click on to add stock symbol to your watchlist and to view watchlist. |
12Stocks.com List of ETFs that track Smallcap Index
| Ticker | ETF Name | Watchlist | Recent Price | Smart Investing & Trading Score | Change % | Week % | Year-to-date % |
| IWM | iShares Russell 2000 | | 196.48 | 44 | -0.61 | 1.73 | -2.11% |
| IJR | iShares Core S&P Small-Cap | | 104.86 | 78 | -0.80 | 1.59 | -3.13% |
| VTWO | Vanguard Russell 2000 ETF | | 79.45 | 63 | -0.60 | 1.75 | -2.03% |
| IWN | iShares Russell 2000 Value | | 150.18 | 68 | -0.73 | 1.62 | -3.32% |
| IWO | iShares Russell 2000 Growth | | 249.86 | 51 | -0.56 | 1.86 | -0.94% |
| IJS | iShares S&P Small-Cap 600 Value | | 96.69 | 60 | -1.04 | 1.13 | -6.19% |
| IJT | iShares S&P Small-Cap 600 Growth | | 125.06 | 63 | -0.25 | 2.33 | -0.06% |
| XSLV | PowerShares S&P SmallCap Low Volatil ETF | | 42.54 | 73 | -0.93 | 0.85 | -3.65% |
| SDD | ProShares UltraShort SmallCap600 | | 19.58 | 42 | 0.46 | -3.74 | 6.26% |
| SBB | ProShares Short SmallCap600 | | 16.50 | 40 | 0.79 | -2.02 | 3.58% |
| SMLV | SPDR SSGA US Small Cap Low Volatil ETF | | 107.33 | 73 | -1.01 | 1.17 | -4.61% |
| SAA | ProShares Ultra SmallCap600 | | 22.66 | 58 | -1.52 | 3.94 | -9.18% |
| 12Stocks.com: Charts, Trends, Fundamental Data and Performances of SmallCap Stocks | |
|
We now take in-depth look at all SmallCap stocks including charts, multi-period performances and overall trends (as measured by Smart Investing & Trading Score). One can sort SmallCap stocks (click link to choose) by Daily, Weekly and by Year-to-Date performances. Also, one can sort by size of the company or by market capitalization. |
| Select Your Default Chart Type: | |||||
| |||||
| Click on stock symbol or name for detailed view. Click on to add stock symbol to your watchlist and to view watchlist. Quick View: Move mouse or cursor over "Daily" to quickly view daily technical stock chart and over "Weekly" to view weekly technical stock chart. | |||||

 | CRNC Cerence Inc. |
| Sector: Technology | |
| SubSector: Application Software | |
| MarketCap: 640.662 Millions | |
| Recent Price: 9.39 Smart Investing & Trading Score: 10 | |
| Day Percent Change: -6.57% Day Change: -0.66 | |
| Week Change: -9.45% Year-to-date Change: -52.2% | |
| CRNC Links: Profile News Message Board | |
| Charts:- Daily , Weekly | |
| Add CRNC to Watchlist: View: Get Complete CRNC Trend Analysis ➞ | |
 | LOB Live Oak Bancshares, Inc. |
| Sector: Financials | |
| SubSector: Savings & Loans | |
| MarketCap: 394.23 Millions | |
| Recent Price: 34.28 Smart Investing & Trading Score: 66 | |
| Day Percent Change: -14.02% Day Change: -5.59 | |
| Week Change: -9.55% Year-to-date Change: -24.7% | |
| LOB Links: Profile News Message Board | |
| Charts:- Daily , Weekly | |
| Add LOB to Watchlist: View: Get Complete LOB Trend Analysis ➞ | |
 | BEAM Beam Therapeutics Inc. |
| Sector: Health Care | |
| SubSector: Biotechnology | |
| MarketCap: 44987 Millions | |
| Recent Price: 21.61 Smart Investing & Trading Score: 0 | |
| Day Percent Change: -4.95% Day Change: -1.13 | |
| Week Change: -9.56% Year-to-date Change: -20.6% | |
| BEAM Links: Profile News Message Board | |
| Charts:- Daily , Weekly | |
| Add BEAM to Watchlist: View: Get Complete BEAM Trend Analysis ➞ | |
 | NRIX Nurix Therapeutics, Inc. |
| Sector: Health Care | |
| SubSector: Biotechnology | |
| MarketCap: 16787 Millions | |
| Recent Price: 12.81 Smart Investing & Trading Score: 46 | |
| Day Percent Change: -6.70% Day Change: -0.92 | |
| Week Change: -9.57% Year-to-date Change: 24.0% | |
| NRIX Links: Profile News Message Board | |
| Charts:- Daily , Weekly | |
| Add NRIX to Watchlist: View: Get Complete NRIX Trend Analysis ➞ | |
 | OPFI OppFi Inc. |
| Sector: Financials | |
| SubSector: Credit Services | |
| MarketCap: 226 Millions | |
| Recent Price: 2.70 Smart Investing & Trading Score: 25 | |
| Day Percent Change: -5.92% Day Change: -0.17 | |
| Week Change: -9.7% Year-to-date Change: -47.2% | |
| OPFI Links: Profile News Message Board | |
| Charts:- Daily , Weekly | |
| Add OPFI to Watchlist: View: Get Complete OPFI Trend Analysis ➞ | |
 | RYAM Rayonier Advanced Materials Inc. |
| Sector: Materials | |
| SubSector: Chemicals - Major Diversified | |
| MarketCap: 116.736 Millions | |
| Recent Price: 3.88 Smart Investing & Trading Score: 10 | |
| Day Percent Change: -5.83% Day Change: -0.24 | |
| Week Change: -9.77% Year-to-date Change: -4.2% | |
| RYAM Links: Profile News Message Board | |
| Charts:- Daily , Weekly | |
| Add RYAM to Watchlist: View: Get Complete RYAM Trend Analysis ➞ | |
 | ACRV Acrivon Therapeutics, Inc. |
| Sector: Health Care | |
| SubSector: Biotechnology | |
| MarketCap: 286 Millions | |
| Recent Price: 8.47 Smart Investing & Trading Score: 78 | |
| Day Percent Change: -10.47% Day Change: -0.99 | |
| Week Change: -9.8% Year-to-date Change: 70.4% | |
| ACRV Links: Profile News Message Board | |
| Charts:- Daily , Weekly | |
| Add ACRV to Watchlist: View: Get Complete ACRV Trend Analysis ➞ | |
 | IE Ivanhoe Electric Inc. |
| Sector: Materials | |
| SubSector: Copper | |
| MarketCap: 1200 Millions | |
| Recent Price: 9.55 Smart Investing & Trading Score: 36 | |
| Day Percent Change: 1.92% Day Change: 0.18 | |
| Week Change: -9.91% Year-to-date Change: -5.8% | |
| IE Links: Profile News Message Board | |
| Charts:- Daily , Weekly | |
| Add IE to Watchlist: View: Get Complete IE Trend Analysis ➞ | |
 | AMSF Amerisafe, Inc. |
| Sector: Financials | |
| SubSector: Property & Casualty Insurance | |
| MarketCap: 1159.32 Millions | |
| Recent Price: 45.82 Smart Investing & Trading Score: 74 | |
| Day Percent Change: -10.02% Day Change: -5.10 | |
| Week Change: -9.94% Year-to-date Change: -2.1% | |
| AMSF Links: Profile News Message Board | |
| Charts:- Daily , Weekly | |
| Add AMSF to Watchlist: View: Get Complete AMSF Trend Analysis ➞ | |
 | LESL Leslies, Inc. |
| Sector: Services & Goods | |
| SubSector: Home Improvement Retail | |
| MarketCap: 37927 Millions | |
| Recent Price: 3.99 Smart Investing & Trading Score: 0 | |
| Day Percent Change: -6.23% Day Change: -0.26 | |
| Week Change: -10.03% Year-to-date Change: -42.3% | |
| LESL Links: Profile News Message Board | |
| Charts:- Daily , Weekly | |
| Add LESL to Watchlist: View: Get Complete LESL Trend Analysis ➞ | |
 | ULCC Frontier Group Holdings, Inc. |
| Sector: Industrials | |
| SubSector: Airlines | |
| MarketCap: 2160 Millions | |
| Recent Price: 6.25 Smart Investing & Trading Score: 36 | |
| Day Percent Change: -2.11% Day Change: -0.13 | |
| Week Change: -10.2% Year-to-date Change: 15.1% | |
| ULCC Links: Profile News Message Board | |
| Charts:- Daily , Weekly | |
| Add ULCC to Watchlist: View: Get Complete ULCC Trend Analysis ➞ | |
 | BRKL Brookline Bancorp, Inc. |
| Sector: Financials | |
| SubSector: Savings & Loans | |
| MarketCap: 894.43 Millions | |
| Recent Price: 8.42 Smart Investing & Trading Score: 45 | |
| Day Percent Change: -11.74% Day Change: -1.12 | |
| Week Change: -10.23% Year-to-date Change: -22.8% | |
| BRKL Links: Profile News Message Board | |
| Charts:- Daily , Weekly | |
| Add BRKL to Watchlist: View: Get Complete BRKL Trend Analysis ➞ | |
 | TRVI Trevi Therapeutics, Inc. |
| Sector: Health Care | |
| SubSector: Biotechnology | |
| MarketCap: 50.6785 Millions | |
| Recent Price: 2.53 Smart Investing & Trading Score: 38 | |
| Day Percent Change: -5.60% Day Change: -0.15 | |
| Week Change: -10.28% Year-to-date Change: 88.8% | |
| TRVI Links: Profile News Message Board | |
| Charts:- Daily , Weekly | |
| Add TRVI to Watchlist: View: Get Complete TRVI Trend Analysis ➞ | |
 | AVXL Anavex Life Sciences Corp. |
| Sector: Health Care | |
| SubSector: Biotechnology | |
| MarketCap: 175.985 Millions | |
| Recent Price: 3.39 Smart Investing & Trading Score: 0 | |
| Day Percent Change: -0.59% Day Change: -0.02 | |
| Week Change: -10.32% Year-to-date Change: -63.6% | |
| AVXL Links: Profile News Message Board | |
| Charts:- Daily , Weekly | |
| Add AVXL to Watchlist: View: Get Complete AVXL Trend Analysis ➞ | |
 | COGT Cogint, Inc. |
| Sector: Technology | |
| SubSector: Business Software & Services | |
| MarketCap: 214.55 Millions | |
| Recent Price: 6.01 Smart Investing & Trading Score: 5 | |
| Day Percent Change: -8.10% Day Change: -0.53 | |
| Week Change: -10.43% Year-to-date Change: 2.2% | |
| COGT Links: Profile News Message Board | |
| Charts:- Daily , Weekly | |
| Add COGT to Watchlist: View: Get Complete COGT Trend Analysis ➞ | |
 | CUE Cue Biopharma, Inc. |
| Sector: Health Care | |
| SubSector: Biotechnology | |
| MarketCap: 352.785 Millions | |
| Recent Price: 1.41 Smart Investing & Trading Score: 0 | |
| Day Percent Change: -1.06% Day Change: -0.01 | |
| Week Change: -10.51% Year-to-date Change: -46.8% | |
| CUE Links: Profile News Message Board | |
| Charts:- Daily , Weekly | |
| Add CUE to Watchlist: View: Get Complete CUE Trend Analysis ➞ | |
 | BLUE bluebird bio, Inc. |
| Sector: Health Care | |
| SubSector: Biotechnology | |
| MarketCap: 3365.05 Millions | |
| Recent Price: 0.91 Smart Investing & Trading Score: 10 | |
| Day Percent Change: -1.13% Day Change: -0.01 | |
| Week Change: -10.54% Year-to-date Change: -33.9% | |
| BLUE Links: Profile News Message Board | |
| Charts:- Daily , Weekly | |
| Add BLUE to Watchlist: View: Get Complete BLUE Trend Analysis ➞ | |
 | THRD Third Harmonic Bio, Inc. |
| Sector: Health Care | |
| SubSector: Biotechnology | |
| MarketCap: 190 Millions | |
| Recent Price: 10.42 Smart Investing & Trading Score: 61 | |
| Day Percent Change: -8.27% Day Change: -0.94 | |
| Week Change: -10.79% Year-to-date Change: -5.4% | |
| THRD Links: Profile News Message Board | |
| Charts:- Daily , Weekly | |
| Add THRD to Watchlist: View: Get Complete THRD Trend Analysis ➞ | |
 | RLYB Rallybio Corporation |
| Sector: Health Care | |
| SubSector: Biotechnology | |
| MarketCap: 226 Millions | |
| Recent Price: 1.57 Smart Investing & Trading Score: 36 | |
| Day Percent Change: -1.26% Day Change: -0.02 | |
| Week Change: -10.8% Year-to-date Change: -33.5% | |
| RLYB Links: Profile News Message Board | |
| Charts:- Daily , Weekly | |
| Add RLYB to Watchlist: View: Get Complete RLYB Trend Analysis ➞ | |
 | TPIC TPI Composites, Inc. |
| Sector: Industrials | |
| SubSector: Diversified Machinery | |
| MarketCap: 451.016 Millions | |
| Recent Price: 2.39 Smart Investing & Trading Score: 20 | |
| Day Percent Change: -3.24% Day Change: -0.08 | |
| Week Change: -10.82% Year-to-date Change: -42.3% | |
| TPIC Links: Profile News Message Board | |
| Charts:- Daily , Weekly | |
| Add TPIC to Watchlist: View: Get Complete TPIC Trend Analysis ➞ | |
 | ONEW OneWater Marine Inc. |
| Sector: Services & Goods | |
| SubSector: Recreational Vehicles | |
| MarketCap: 42027 Millions | |
| Recent Price: 21.24 Smart Investing & Trading Score: 28 | |
| Day Percent Change: -8.92% Day Change: -2.08 | |
| Week Change: -10.87% Year-to-date Change: -37.1% | |
| ONEW Links: Profile News Message Board | |
| Charts:- Daily , Weekly | |
| Add ONEW to Watchlist: View: Get Complete ONEW Trend Analysis ➞ | |
 | SST System1, Inc. |
| Sector: Industrials | |
| SubSector: Specialty Business Services | |
| MarketCap: 504 Millions | |
| Recent Price: 1.79 Smart Investing & Trading Score: 36 | |
| Day Percent Change: -4.79% Day Change: -0.09 | |
| Week Change: -10.95% Year-to-date Change: -25.7% | |
| SST Links: Profile News Message Board | |
| Charts:- Daily , Weekly | |
| Add SST to Watchlist: View: Get Complete SST Trend Analysis ➞ | |
 | PACB Pacific Biosciences of California, Inc. |
| Sector: Health Care | |
| SubSector: Biotechnology | |
| MarketCap: 470.685 Millions | |
| Recent Price: 1.38 Smart Investing & Trading Score: 10 | |
| Day Percent Change: 1.47% Day Change: 0.02 | |
| Week Change: -10.97% Year-to-date Change: -85.9% | |
| PACB Links: Profile News Message Board | |
| Charts:- Daily , Weekly | |
| Add PACB to Watchlist: View: Get Complete PACB Trend Analysis ➞ | |
 | FHTX Foghorn Therapeutics Inc. |
| Sector: Health Care | |
| SubSector: Biotechnology | |
| MarketCap: 74487 Millions | |
| Recent Price: 5.15 Smart Investing & Trading Score: 46 | |
| Day Percent Change: -1.15% Day Change: -0.06 | |
| Week Change: -11.28% Year-to-date Change: -19.7% | |
| FHTX Links: Profile News Message Board | |
| Charts:- Daily , Weekly | |
| Add FHTX to Watchlist: View: Get Complete FHTX Trend Analysis ➞ | |
 | FGEN FibroGen, Inc. |
| Sector: Health Care | |
| SubSector: Biotechnology | |
| MarketCap: 2502.95 Millions | |
| Recent Price: 1.02 Smart Investing & Trading Score: 20 | |
| Day Percent Change: 3.63% Day Change: 0.04 | |
| Week Change: -11.3% Year-to-date Change: 15.1% | |
| FGEN Links: Profile News Message Board | |
| Charts:- Daily , Weekly | |
| Add FGEN to Watchlist: View: Get Complete FGEN Trend Analysis ➞ | |
| Too many stocks? View smallcap stocks filtered by marketcap & sector |
| Marketcap: All SmallCap Stocks (default-no microcap), Large, Mid-Range, Small & MicroCap |
| Sector: Tech, Finance, Energy, Staples, Retail, Industrial, Materials, Utilities & Medical |
|
Best Stocks Today 12Stocks.com |
© 2024 12Stocks.com Terms & Conditions Privacy Contact Us
All Information Provided Only For Education And Not To Be Used For Investing or Trading. See Terms & Conditions


One More Thing ... Get Best Stocks Delivered Daily!
Never Ever Miss A Move With Our Top Ten Stocks Lists
Find Best Stocks In Any Market - Bull or Bear Market
Take A Peek At Our Top Ten Stocks Lists: Daily, Weekly, Year-to-Date & Top Trends
Find Best Stocks In Any Market - Bull or Bear Market
Take A Peek At Our Top Ten Stocks Lists: Daily, Weekly, Year-to-Date & Top Trends
Smallcap Stocks With Best Up Trends [0-bearish to 100-bullish]: B. Riley[100], Central Pacific[100], California Water[100], Cricut [100], Carpenter [100], Haemonetics [100], Sanmina [100], Trustmark [100], Comstock Resources[100], EchoStar [100], Mueller Industries[100]
Best Smallcap Stocks Year-to-Date:
CareMax [490.72%], Janux [338.34%], Viking [270.02%], Alpine Immune[239.52%], Longboard [218%], Super Micro[177%], Arcutis Bio[166.56%], Avidity Biosciences[159.79%], Vera [149.94%], Hippo [128.87%], Stoke [122.15%] Best Smallcap Stocks This Week:
Matterport [168.97%], B. Riley[73.54%], Impinj [33.73%], ProKidney [32.84%], Seres [32.65%], Riot Blockchain[32.64%], Ribbon [25.58%], Cullinan Oncology[22.92%], P.A.M. Transportation[22.85%], NuScale Power[21.44%], Hibbett Sports[21.03%] Best Smallcap Stocks Daily:
Impinj [28.65%], P.A.M. Transportation[17.95%], B. Riley[16.61%], Strategic Education[16.28%], OptiNose [14.56%], JELD-WEN Holding[11.54%], Sonic Automotive[10.86%], Intevac [10.54%], SiTime [8.84%], Noodles & [8.08%], ProKidney [7.75%]