
 Login Sign Up


| |||||
 |  | ||||

| 12Stocks.com Market Intelligence |
Best SmallCap Stocks
|
| In a hurry? Small Cap Stock Lists: Performance Trends Table, Stock Charts
Sort Small Cap stocks: Daily, Weekly, Year-to-Date, Market Cap & Trends. Filter Small Cap stocks list by sector: Show all, Tech, Finance, Energy, Staples, Retail, Industrial, Materials, Utilities and HealthCare Filter Small Cap stocks list by size: All Large Medium Small and MicroCap |
| 12Stocks.com Small Cap Stocks Performances & Trends Daily | |||||||||
|
|  The overall Smart Investing & Trading Score is 44 (0-bearish to 100-bullish) which puts Small Cap index in short term neutral trend. The Smart Investing & Trading Score from previous trading session is 58 and hence a deterioration of trend.
| ||||||||
Here are the Smart Investing & Trading Scores of the most requested small cap stocks at 12Stocks.com (click stock name for detailed review):
|


| 12Stocks.com: Investing in Smallcap Index with Stocks | |
|
The following table helps investors and traders sort through current performance and trends (as measured by Smart Investing & Trading Score) of various
stocks in the Smallcap Index. Quick View: Move mouse or cursor over stock symbol (ticker) to view short-term technical chart and over stock name to view long term chart. Click on  to add stock symbol to your watchlist and to add stock symbol to your watchlist and  to view watchlist. Click on any ticker or stock name for detailed market intelligence report for that stock. to view watchlist. Click on any ticker or stock name for detailed market intelligence report for that stock. |
12Stocks.com Performance of Stocks in Smallcap Index
| Ticker | Stock Name | Watchlist | Category | Recent Price | Smart Investing & Trading Score | Change % | Weekly Change% |
| DIN | Dine Brands |   | Services & Goods | 46.03 | 74 | 1.64% | 6.19% |
| AI | C3.ai | | Financials | 22.00 | 32 | -1.57% | 6.18% |
| BWMN | Bowman Consulting | | Industrials | 32.12 | 65 | 0.58% | 6.17% |
| HAE | Haemonetics | | Health Care | 86.20 | 100 | -0.02% | 6.11% |
| LMND | Lemonade | | Financials | 17.06 | 83 | -2.01% | 6.09% |
| ZUO | Zuora | | Technology | 9.81 | 73 | -2.19% | 6.05% |
| ARRY | Array | | Technology | 11.95 | 83 | -2.29% | 6.03% |
| APOG | Apogee Enterprises | | Industrials | 61.44 | 86 | -1.32% | 6.02% |
| BIRD | Allbirds | | Services & Goods | 0.63 | 45 | -0.49% | 6.02% |
| RGCO | RGC Resources | | Utilities | 20.38 | 80 | 0.59% | 5.98% |
| FORM | FormFactor | | Technology | 43.19 | 58 | 3.51% | 5.95% |
| VKTX | Viking | | Health Care | 67.19 | 56 | 3.26% | 5.94% |
| CRDO | Credo | | Technology | 17.91 | 25 | -0.22% | 5.85% |
| GDOT | Green Dot | | Financials | 9.01 | 87 | 0.28% | 5.82% |
| SMPL | Simply Good | | Consumer Staples | 35.10 | 44 | 2.21% | 5.79% |
| WWW | Wolverine World | | Consumer Staples | 10.35 | 93 | -2.59% | 5.78% |
| VITL | Vital Farms | | Consumer Staples | 26.59 | 88 | -0.11% | 5.77% |
| BLFS | BioLife Solutions | | Health Care | 16.77 | 86 | -2.41% | 5.77% |
| FN | Fabrinet | | Technology | 171.61 | 35 | 0.99% | 5.72% |
| AMRX | Amneal | | Health Care | 5.73 | 37 | -5.29% | 5.72% |
| OII | Oceaneering | | Energy | 23.89 | 73 | 3.64% | 5.71% |
| JOE | St. Joe | | Financials | 57.99 | 83 | 2.00% | 5.68% |
| MCB | Metropolitan Bank | | Financials | 41.27 | 67 | -2.31% | 5.67% |
| AMKR | Amkor | | Technology | 30.10 | 32 | 0.80% | 5.61% |
| GBIO | Generation Bio | | Health Care | 2.92 | 61 | -2.34% | 5.60% |


| Too many stocks? View smallcap stocks filtered by marketcap & sector |
| Marketcap: All SmallCap Stocks (default-no microcap), Large, Mid-Range, Small |
| Smallcap Sector: Tech, Finance, Energy, Staples, Retail, Industrial, Materials, & Medical |
|
Get the most comprehensive stock market coverage daily at 12Stocks.com ➞ Best Stocks Today ➞ Best Stocks Weekly ➞ Best Stocks Year-to-Date ➞ Best Stocks Trends ➞  Best Stocks Today 12Stocks.com Best Nasdaq Stocks ➞ Best S&P 500 Stocks ➞ Best Tech Stocks ➞ Best Biotech Stocks ➞ |
| Detailed Overview of SmallCap Stocks |
| SmallCap Technical Overview, Leaders & Laggards, Top SmallCap ETF Funds & Detailed SmallCap Stocks List, Charts, Trends & More |
| Smallcap: Technical Analysis, Trends & YTD Performance | |
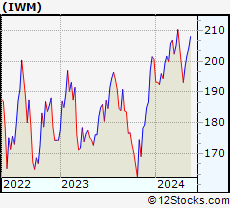
| SmallCap segment as represented by
IWM, an exchange-traded fund [ETF], holds basket of thousands of smallcap stocks from across all major sectors of the US stock market. The smallcap index (contains stocks like Riverbed & Sotheby's) is down by -2.41% and is currently underperforming the overall market by -7.26% year-to-date. Below is a quick view of technical charts and trends: | |
 IWM Weekly Chart |
|
| Long Term Trend: Good | |
| Medium Term Trend: Not Good | |
 IWM Daily Chart |
|
| Short Term Trend: Very Good | |
| Overall Trend Score: 44 | |
| YTD Performance: -2.41% | |
| **Trend Scores & Views Are Only For Educational Purposes And Not For Investing | |
| 12Stocks.com: Top Performing Small Cap Index Stocks | ||||||||||||||||||||||||||||||||||||||||||||||||
 The top performing Small Cap Index stocks year to date are
Now, more recently, over last week, the top performing Small Cap Index stocks on the move are


|
||||||||||||||||||||||||||||||||||||||||||||||||
| 12Stocks.com: Investing in Smallcap Index using Exchange Traded Funds | |
|
The following table shows list of key exchange traded funds (ETF) that
help investors track Smallcap index. The following list also includes leveraged ETF funds that track twice or thrice the daily returns of Smallcap indices. Short or inverse ETF funds move in the opposite direction to the index they track and are useful during market pullbacks or during bear markets. Quick View: Move mouse or cursor over ETF symbol (ticker) to view short-term technical chart and over ETF name to view long term chart. Click on ticker or stock name for detailed view. Click on to add stock symbol to your watchlist and to view watchlist. |
12Stocks.com List of ETFs that track Smallcap Index
| Ticker | ETF Name | Watchlist | Recent Price | Smart Investing & Trading Score | Change % | Week % | Year-to-date % |
| IWM | iShares Russell 2000 | | 195.88 | 44 | -0.91 | 1.42 | -2.41% |
| IJR | iShares Core S&P Small-Cap | | 104.62 | 78 | -1.03 | 1.36 | -3.35% |
| VTWO | Vanguard Russell 2000 ETF | | 79.21 | 63 | -0.90 | 1.45 | -2.33% |
| IWN | iShares Russell 2000 Value | | 149.73 | 68 | -1.02 | 1.32 | -3.61% |
| IWO | iShares Russell 2000 Growth | | 249.49 | 51 | -0.71 | 1.71 | -1.08% |
| IJS | iShares S&P Small-Cap 600 Value | | 96.25 | 60 | -1.49 | 0.67 | -6.62% |
| IJT | iShares S&P Small-Cap 600 Growth | | 124.73 | 63 | -0.51 | 2.06 | -0.33% |
| XSLV | PowerShares S&P SmallCap Low Volatil ETF | | 42.49 | 73 | -1.05 | 0.73 | -3.77% |
| SMLV | SPDR SSGA US Small Cap Low Volatil ETF | | 106.85 | 73 | -1.46 | 0.72 | -5.04% |
| SBB | ProShares Short SmallCap600 | | 16.65 | 40 | 1.71 | -1.13 | 4.52% |
| SDD | ProShares UltraShort SmallCap600 | | 19.60 | 42 | 0.56 | -3.64 | 6.37% |
| SAA | ProShares Ultra SmallCap600 | | 22.34 | 58 | -2.91 | 2.48 | -10.46% |
| 12Stocks.com: Charts, Trends, Fundamental Data and Performances of SmallCap Stocks | |
|
We now take in-depth look at all SmallCap stocks including charts, multi-period performances and overall trends (as measured by Smart Investing & Trading Score). One can sort SmallCap stocks (click link to choose) by Daily, Weekly and by Year-to-Date performances. Also, one can sort by size of the company or by market capitalization. |
| Select Your Default Chart Type: | |||||
| |||||
| Click on stock symbol or name for detailed view. Click on to add stock symbol to your watchlist and to view watchlist. Quick View: Move mouse or cursor over "Daily" to quickly view daily technical stock chart and over "Weekly" to view weekly technical stock chart. | |||||

 | DIN Dine Brands Global, Inc. |
| Sector: Services & Goods | |
| SubSector: Restaurants | |
| MarketCap: 421.17 Millions | |
| Recent Price: 46.03 Smart Investing & Trading Score: 74 | |
| Day Percent Change: 1.64% Day Change: 0.74 | |
| Week Change: 6.19% Year-to-date Change: -7.3% | |
| DIN Links: Profile News Message Board | |
| Charts:- Daily , Weekly | |
| Add DIN to Watchlist: View: Get Complete DIN Trend Analysis ➞ | |
 | AI C3.ai, Inc. |
| Sector: Financials | |
| SubSector: REIT Mortgage | |
| MarketCap: 12467 Millions | |
| Recent Price: 22.00 Smart Investing & Trading Score: 32 | |
| Day Percent Change: -1.57% Day Change: -0.35 | |
| Week Change: 6.18% Year-to-date Change: -23.4% | |
| AI Links: Profile News Message Board | |
| Charts:- Daily , Weekly | |
| Add AI to Watchlist: View: Get Complete AI Trend Analysis ➞ | |
 | BWMN Bowman Consulting Group Ltd. |
| Sector: Industrials | |
| SubSector: Engineering & Construction | |
| MarketCap: 443 Millions | |
| Recent Price: 32.12 Smart Investing & Trading Score: 65 | |
| Day Percent Change: 0.58% Day Change: 0.19 | |
| Week Change: 6.17% Year-to-date Change: -8.8% | |
| BWMN Links: Profile News Message Board | |
| Charts:- Daily , Weekly | |
| Add BWMN to Watchlist: View: Get Complete BWMN Trend Analysis ➞ | |
 | HAE Haemonetics Corporation |
| Sector: Health Care | |
| SubSector: Medical Instruments & Supplies | |
| MarketCap: 4500.7 Millions | |
| Recent Price: 86.20 Smart Investing & Trading Score: 100 | |
| Day Percent Change: -0.02% Day Change: -0.02 | |
| Week Change: 6.11% Year-to-date Change: 0.8% | |
| HAE Links: Profile News Message Board | |
| Charts:- Daily , Weekly | |
| Add HAE to Watchlist: View: Get Complete HAE Trend Analysis ➞ | |
 | LMND Lemonade, Inc. |
| Sector: Financials | |
| SubSector: Insurance Property & Casualty | |
| MarketCap: 56457 Millions | |
| Recent Price: 17.06 Smart Investing & Trading Score: 83 | |
| Day Percent Change: -2.01% Day Change: -0.35 | |
| Week Change: 6.09% Year-to-date Change: 5.8% | |
| LMND Links: Profile News Message Board | |
| Charts:- Daily , Weekly | |
| Add LMND to Watchlist: View: Get Complete LMND Trend Analysis ➞ | |
 | ZUO Zuora, Inc. |
| Sector: Technology | |
| SubSector: Application Software | |
| MarketCap: 1063.22 Millions | |
| Recent Price: 9.81 Smart Investing & Trading Score: 73 | |
| Day Percent Change: -2.19% Day Change: -0.22 | |
| Week Change: 6.05% Year-to-date Change: 4.4% | |
| ZUO Links: Profile News Message Board | |
| Charts:- Daily , Weekly | |
| Add ZUO to Watchlist: View: Get Complete ZUO Trend Analysis ➞ | |
 | ARRY Array Technologies, Inc. |
| Sector: Technology | |
| SubSector: Solar | |
| MarketCap: 45887 Millions | |
| Recent Price: 11.95 Smart Investing & Trading Score: 83 | |
| Day Percent Change: -2.29% Day Change: -0.28 | |
| Week Change: 6.03% Year-to-date Change: -28.9% | |
| ARRY Links: Profile News Message Board | |
| Charts:- Daily , Weekly | |
| Add ARRY to Watchlist: View: Get Complete ARRY Trend Analysis ➞ | |
 | APOG Apogee Enterprises, Inc. |
| Sector: Industrials | |
| SubSector: General Building Materials | |
| MarketCap: 510.653 Millions | |
| Recent Price: 61.44 Smart Investing & Trading Score: 86 | |
| Day Percent Change: -1.32% Day Change: -0.82 | |
| Week Change: 6.02% Year-to-date Change: 15.0% | |
| APOG Links: Profile News Message Board | |
| Charts:- Daily , Weekly | |
| Add APOG to Watchlist: View: Get Complete APOG Trend Analysis ➞ | |
 | BIRD Allbirds, Inc. |
| Sector: Services & Goods | |
| SubSector: Apparel Retail | |
| MarketCap: 184 Millions | |
| Recent Price: 0.63 Smart Investing & Trading Score: 45 | |
| Day Percent Change: -0.49% Day Change: 0.00 | |
| Week Change: 6.02% Year-to-date Change: -48.5% | |
| BIRD Links: Profile News Message Board | |
| Charts:- Daily , Weekly | |
| Add BIRD to Watchlist: View: Get Complete BIRD Trend Analysis ➞ | |
 | RGCO RGC Resources, Inc. |
| Sector: Utilities | |
| SubSector: Gas Utilities | |
| MarketCap: 215.277 Millions | |
| Recent Price: 20.38 Smart Investing & Trading Score: 80 | |
| Day Percent Change: 0.59% Day Change: 0.12 | |
| Week Change: 5.98% Year-to-date Change: 0.2% | |
| RGCO Links: Profile News Message Board | |
| Charts:- Daily , Weekly | |
| Add RGCO to Watchlist: View: Get Complete RGCO Trend Analysis ➞ | |
 | FORM FormFactor, Inc. |
| Sector: Technology | |
| SubSector: Semiconductor - Broad Line | |
| MarketCap: 1426.42 Millions | |
| Recent Price: 43.19 Smart Investing & Trading Score: 58 | |
| Day Percent Change: 3.51% Day Change: 1.47 | |
| Week Change: 5.95% Year-to-date Change: 3.5% | |
| FORM Links: Profile News Message Board | |
| Charts:- Daily , Weekly | |
| Add FORM to Watchlist: View: Get Complete FORM Trend Analysis ➞ | |
 | VKTX Viking Therapeutics, Inc. |
| Sector: Health Care | |
| SubSector: Biotechnology | |
| MarketCap: 388.585 Millions | |
| Recent Price: 67.19 Smart Investing & Trading Score: 56 | |
| Day Percent Change: 3.26% Day Change: 2.12 | |
| Week Change: 5.94% Year-to-date Change: 261.0% | |
| VKTX Links: Profile News Message Board | |
| Charts:- Daily , Weekly | |
| Add VKTX to Watchlist: View: Get Complete VKTX Trend Analysis ➞ | |
 | CRDO Credo Technology Group Holding Ltd |
| Sector: Technology | |
| SubSector: Communication Equipment | |
| MarketCap: 2590 Millions | |
| Recent Price: 17.91 Smart Investing & Trading Score: 25 | |
| Day Percent Change: -0.22% Day Change: -0.04 | |
| Week Change: 5.85% Year-to-date Change: -8.4% | |
| CRDO Links: Profile News Message Board | |
| Charts:- Daily , Weekly | |
| Add CRDO to Watchlist: View: Get Complete CRDO Trend Analysis ➞ | |
 | GDOT Green Dot Corporation |
| Sector: Financials | |
| SubSector: Credit Services | |
| MarketCap: 1320.08 Millions | |
| Recent Price: 9.01 Smart Investing & Trading Score: 87 | |
| Day Percent Change: 0.28% Day Change: 0.03 | |
| Week Change: 5.82% Year-to-date Change: -9.0% | |
| GDOT Links: Profile News Message Board | |
| Charts:- Daily , Weekly | |
| Add GDOT to Watchlist: View: Get Complete GDOT Trend Analysis ➞ | |
 | SMPL The Simply Good Foods Company |
| Sector: Consumer Staples | |
| SubSector: Food - Major Diversified | |
| MarketCap: 1501.63 Millions | |
| Recent Price: 35.10 Smart Investing & Trading Score: 44 | |
| Day Percent Change: 2.21% Day Change: 0.76 | |
| Week Change: 5.79% Year-to-date Change: -11.4% | |
| SMPL Links: Profile News Message Board | |
| Charts:- Daily , Weekly | |
| Add SMPL to Watchlist: View: Get Complete SMPL Trend Analysis ➞ | |
 | WWW Wolverine World Wide, Inc. |
| Sector: Consumer Staples | |
| SubSector: Textile - Apparel Footwear & Accessories | |
| MarketCap: 1390.7 Millions | |
| Recent Price: 10.35 Smart Investing & Trading Score: 93 | |
| Day Percent Change: -2.59% Day Change: -0.27 | |
| Week Change: 5.78% Year-to-date Change: 16.4% | |
| WWW Links: Profile News Message Board | |
| Charts:- Daily , Weekly | |
| Add WWW to Watchlist: View: Get Complete WWW Trend Analysis ➞ | |
 | VITL Vital Farms, Inc. |
| Sector: Consumer Staples | |
| SubSector: Farm Products | |
| MarketCap: 10347 Millions | |
| Recent Price: 26.59 Smart Investing & Trading Score: 88 | |
| Day Percent Change: -0.11% Day Change: -0.03 | |
| Week Change: 5.77% Year-to-date Change: 69.4% | |
| VITL Links: Profile News Message Board | |
| Charts:- Daily , Weekly | |
| Add VITL to Watchlist: View: Get Complete VITL Trend Analysis ➞ | |
 | BLFS BioLife Solutions, Inc. |
| Sector: Health Care | |
| SubSector: Medical Instruments & Supplies | |
| MarketCap: 264.36 Millions | |
| Recent Price: 16.77 Smart Investing & Trading Score: 86 | |
| Day Percent Change: -2.41% Day Change: -0.42 | |
| Week Change: 5.77% Year-to-date Change: 3.2% | |
| BLFS Links: Profile News Message Board | |
| Charts:- Daily , Weekly | |
| Add BLFS to Watchlist: View: Get Complete BLFS Trend Analysis ➞ | |
 | FN Fabrinet |
| Sector: Technology | |
| SubSector: Electronic Equipment | |
| MarketCap: 1876 Millions | |
| Recent Price: 171.61 Smart Investing & Trading Score: 35 | |
| Day Percent Change: 0.99% Day Change: 1.68 | |
| Week Change: 5.72% Year-to-date Change: -9.8% | |
| FN Links: Profile News Message Board | |
| Charts:- Daily , Weekly | |
| Add FN to Watchlist: View: Get Complete FN Trend Analysis ➞ | |
 | AMRX Amneal Pharmaceuticals, Inc. |
| Sector: Health Care | |
| SubSector: Drug Related Products | |
| MarketCap: 1218.13 Millions | |
| Recent Price: 5.73 Smart Investing & Trading Score: 37 | |
| Day Percent Change: -5.29% Day Change: -0.32 | |
| Week Change: 5.72% Year-to-date Change: -5.6% | |
| AMRX Links: Profile News Message Board | |
| Charts:- Daily , Weekly | |
| Add AMRX to Watchlist: View: Get Complete AMRX Trend Analysis ➞ | |
 | OII Oceaneering International, Inc. |
| Sector: Energy | |
| SubSector: Oil & Gas Equipment & Services | |
| MarketCap: 324.061 Millions | |
| Recent Price: 23.89 Smart Investing & Trading Score: 73 | |
| Day Percent Change: 3.64% Day Change: 0.84 | |
| Week Change: 5.71% Year-to-date Change: 12.3% | |
| OII Links: Profile News Message Board | |
| Charts:- Daily , Weekly | |
| Add OII to Watchlist: View: Get Complete OII Trend Analysis ➞ | |
 | JOE The St. Joe Company |
| Sector: Financials | |
| SubSector: Real Estate Development | |
| MarketCap: 1029.39 Millions | |
| Recent Price: 57.99 Smart Investing & Trading Score: 83 | |
| Day Percent Change: 2.00% Day Change: 1.13 | |
| Week Change: 5.68% Year-to-date Change: -3.6% | |
| JOE Links: Profile News Message Board | |
| Charts:- Daily , Weekly | |
| Add JOE to Watchlist: View: Get Complete JOE Trend Analysis ➞ | |
 | MCB Metropolitan Bank Holding Corp. |
| Sector: Financials | |
| SubSector: Regional - Northeast Banks | |
| MarketCap: 212.999 Millions | |
| Recent Price: 41.27 Smart Investing & Trading Score: 67 | |
| Day Percent Change: -2.31% Day Change: -0.98 | |
| Week Change: 5.67% Year-to-date Change: -25.5% | |
| MCB Links: Profile News Message Board | |
| Charts:- Daily , Weekly | |
| Add MCB to Watchlist: View: Get Complete MCB Trend Analysis ➞ | |
 | AMKR Amkor Technology, Inc. |
| Sector: Technology | |
| SubSector: Semiconductor - Integrated Circuits | |
| MarketCap: 1966.2 Millions | |
| Recent Price: 30.10 Smart Investing & Trading Score: 32 | |
| Day Percent Change: 0.80% Day Change: 0.24 | |
| Week Change: 5.61% Year-to-date Change: -9.5% | |
| AMKR Links: Profile News Message Board | |
| Charts:- Daily , Weekly | |
| Add AMKR to Watchlist: View: Get Complete AMKR Trend Analysis ➞ | |
 | GBIO Generation Bio Co. |
| Sector: Health Care | |
| SubSector: Biotechnology | |
| MarketCap: 17487 Millions | |
| Recent Price: 2.92 Smart Investing & Trading Score: 61 | |
| Day Percent Change: -2.34% Day Change: -0.07 | |
| Week Change: 5.6% Year-to-date Change: 77.3% | |
| GBIO Links: Profile News Message Board | |
| Charts:- Daily , Weekly | |
| Add GBIO to Watchlist: View: Get Complete GBIO Trend Analysis ➞ | |
| Too many stocks? View smallcap stocks filtered by marketcap & sector |
| Marketcap: All SmallCap Stocks (default-no microcap), Large, Mid-Range, Small & MicroCap |
| Sector: Tech, Finance, Energy, Staples, Retail, Industrial, Materials, Utilities & Medical |
|
Best Stocks Today 12Stocks.com |
© 2024 12Stocks.com Terms & Conditions Privacy Contact Us
All Information Provided Only For Education And Not To Be Used For Investing or Trading. See Terms & Conditions


One More Thing ... Get Best Stocks Delivered Daily!
Never Ever Miss A Move With Our Top Ten Stocks Lists
Find Best Stocks In Any Market - Bull or Bear Market
Take A Peek At Our Top Ten Stocks Lists: Daily, Weekly, Year-to-Date & Top Trends
Find Best Stocks In Any Market - Bull or Bear Market
Take A Peek At Our Top Ten Stocks Lists: Daily, Weekly, Year-to-Date & Top Trends
Smallcap Stocks With Best Up Trends [0-bearish to 100-bullish]: B. Riley[100], Ribbon [100], Cricut [100], Central Pacific[100], California Water[100], Diodes [100], Carpenter [100], Sanmina [100], Agios [100], Comstock Resources[100], Excelerate Energy[100]
Best Smallcap Stocks Year-to-Date:
CareMax [572.16%], Janux [333.88%], Viking [261.04%], Alpine Immune[239.52%], Longboard [218%], Super Micro[175.94%], Avidity Biosciences[159.79%], Arcutis Bio[156.19%], Vera [154.33%], Hippo [126.07%], Y-mAbs [121.85%] Best Smallcap Stocks This Week:
Matterport [169.25%], B. Riley[65.73%], Seres [33.67%], Impinj [31.96%], Ribbon [30.81%], Riot Blockchain[30.23%], ProKidney [27.45%], CareMax [26.85%], P.A.M. Transportation[26.15%], Cullinan Oncology[21.1%], Hibbett Sports[20.85%] Best Smallcap Stocks Daily:
Impinj [26.95%], P.A.M. Transportation[21.11%], Strategic Education[14.81%], OptiNose [14.56%], Sonic Automotive[12.75%], Intevac [11.89%], B. Riley[11.36%], Noodles & [8.08%], Red Robin[7.69%], JELD-WEN Holding[7.31%], Community Health[6.77%]