
 Login Sign Up


| |||||
 |  | ||||

| 12Stocks.com Market Intelligence |
Best SmallCap Stocks
|
| In a hurry? Small Cap Stock Lists: Performance Trends Table, Stock Charts
Sort Small Cap stocks: Daily, Weekly, Year-to-Date, Market Cap & Trends. Filter Small Cap stocks list by sector: Show all, Tech, Finance, Energy, Staples, Retail, Industrial, Materials, Utilities and HealthCare Filter Small Cap stocks list by size: All Large Medium Small and MicroCap |
| 12Stocks.com Small Cap Stocks Performances & Trends Daily | |||||||||
|
|  The overall Smart Investing & Trading Score is 44 (0-bearish to 100-bullish) which puts Small Cap index in short term neutral trend. The Smart Investing & Trading Score from previous trading session is 13 and hence an improvement of trend.
| ||||||||
Here are the Smart Investing & Trading Scores of the most requested small cap stocks at 12Stocks.com (click stock name for detailed review):
|


| 12Stocks.com: Investing in Smallcap Index with Stocks | |
|
The following table helps investors and traders sort through current performance and trends (as measured by Smart Investing & Trading Score) of various
stocks in the Smallcap Index. Quick View: Move mouse or cursor over stock symbol (ticker) to view short-term technical chart and over stock name to view long term chart. Click on  to add stock symbol to your watchlist and to add stock symbol to your watchlist and  to view watchlist. Click on any ticker or stock name for detailed market intelligence report for that stock. to view watchlist. Click on any ticker or stock name for detailed market intelligence report for that stock. |
12Stocks.com Performance of Stocks in Smallcap Index
| Ticker | Stock Name | Watchlist | Category | Recent Price | Smart Investing & Trading Score | Change % | Weekly Change% |
| LOB | Live Oak |   | Financials | 37.05 | 43 | 1.01% | -2.32% |
| CNXN | PC Connection | | Technology | 62.09 | 10 | 0.43% | -2.32% |
| STER | Sterling Check | | Technology | 15.13 | 48 | 0.40% | -2.32% |
| DGII | Digi | | Technology | 30.19 | 54 | 0.10% | -2.33% |
| RDN | Radian Group | | Financials | 29.54 | 43 | 0.72% | -2.35% |
| MTSI | MACOM | | Technology | 96.09 | 39 | -0.31% | -2.35% |
| FTAI | Fortress Transportation | | Transports | 70.06 | 58 | 0.22% | -2.35% |
| GMRE | Global Medical | | Industrials | 8.12 | 35 | 0.31% | -2.35% |
| DLTH | Duluth | | Services & Goods | 4.34 | 10 | -0.12% | -2.36% |
| MGRC | McGrath RentCorp | | Transports | 112.28 | 18 | 0.67% | -2.37% |
| VIAV | Viavi Solutions | | Technology | 8.25 | 18 | 0.98% | -2.37% |
| CCS | Century Communities | | Industrials | 81.29 | 10 | 2.51% | -2.38% |
| IRT | Independence Realty | | Financials | 15.62 | 36 | 0.39% | -2.38% |
| MYE | Myers Industries | | Consumer Staples | 21.22 | 54 | 1.19% | -2.39% |
| AMPX | Amprius | | Industrials | 1.84 | 52 | 6.07% | -2.39% |
| AIT | Applied Industrial | | Services & Goods | 186.50 | 36 | 1.14% | -2.40% |
| REI | Ring Energy | | Energy | 2.03 | 61 | 1.00% | -2.40% |
| PX | P10 | | Financials | 7.50 | 53 | 0.20% | -2.41% |
| ROCK | Gibraltar Industries | | Materials | 72.41 | 10 | 1.27% | -2.41% |
| PAX | Patria s | | Financials | 13.55 | 25 | 0.63% | -2.41% |
| TPC | Tutor Perini | | Industrials | 13.53 | 46 | 0.71% | -2.42% |
| NABL | N-able | | Technology | 12.26 | 18 | 0.95% | -2.43% |
| KN | Knowles | | Technology | 15.43 | 10 | -0.55% | -2.44% |
| BOH | Bank of Hawaii | | Financials | 56.85 | 10 | 1.07% | -2.45% |
| OBIO | Orchestra BioMed | | Health Care | 4.77 | 27 | 2.58% | -2.45% |
| For chart view version of above stock list: Chart View ➞ 0 - 25 , 25 - 50 , 50 - 75 , 75 - 100 , 100 - 125 , 125 - 150 , 150 - 175 , 175 - 200 , 200 - 225 , 225 - 250 , 250 - 275 , 275 - 300 , 300 - 325 , 325 - 350 , 350 - 375 , 375 - 400 , 400 - 425 , 425 - 450 , 450 - 475 , 475 - 500 , 500 - 525 , 525 - 550 , 550 - 575 , 575 - 600 , 600 - 625 , 625 - 650 , 650 - 675 , 675 - 700 , 700 - 725 , 725 - 750 , 750 - 775 , 775 - 800 , 800 - 825 , 825 - 850 , 850 - 875 , 875 - 900 , 900 - 925 , 925 - 950 , 950 - 975 , 975 - 1000 , 1000 - 1025 , 1025 - 1050 , 1050 - 1075 , 1075 - 1100 , 1100 - 1125 , 1125 - 1150 , 1150 - 1175 , 1175 - 1200 , 1200 - 1225 , 1225 - 1250 , 1250 - 1275 , 1275 - 1300 , 1300 - 1325 , 1325 - 1350 , 1350 - 1375 , 1375 - 1400 , 1400 - 1425 , 1425 - 1450 , 1450 - 1475 , 1475 - 1500 | ||
 | Click To Change The Sort Order: By Market Cap or Company Size Performance: Year-to-date, Week and Day |  |
| Too many stocks? View smallcap stocks filtered by marketcap & sector |
| Marketcap: All SmallCap Stocks (default-no microcap), Large, Mid-Range, Small |
| Smallcap Sector: Tech, Finance, Energy, Staples, Retail, Industrial, Materials, & Medical |
|
Get the most comprehensive stock market coverage daily at 12Stocks.com ➞ Best Stocks Today ➞ Best Stocks Weekly ➞ Best Stocks Year-to-Date ➞ Best Stocks Trends ➞  Best Stocks Today 12Stocks.com Best Nasdaq Stocks ➞ Best S&P 500 Stocks ➞ Best Tech Stocks ➞ Best Biotech Stocks ➞ |
| Detailed Overview of SmallCap Stocks |
| SmallCap Technical Overview, Leaders & Laggards, Top SmallCap ETF Funds & Detailed SmallCap Stocks List, Charts, Trends & More |
| Smallcap: Technical Analysis, Trends & YTD Performance | |
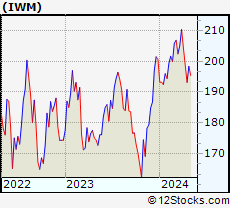
| SmallCap segment as represented by
IWM, an exchange-traded fund [ETF], holds basket of thousands of smallcap stocks from across all major sectors of the US stock market. The smallcap index (contains stocks like Riverbed & Sotheby's) is down by -2.78% and is currently underperforming the overall market by -7.83% year-to-date. Below is a quick view of technical charts and trends: | |
 IWM Weekly Chart |
|
| Long Term Trend: Good | |
| Medium Term Trend: Not Good | |
 IWM Daily Chart |
|
| Short Term Trend: Deteriorating | |
| Overall Trend Score: 44 | |
| YTD Performance: -2.78% | |
| **Trend Scores & Views Are Only For Educational Purposes And Not For Investing | |
| 12Stocks.com: Top Performing Small Cap Index Stocks | ||||||||||||||||||||||||||||||||||||||||||||||||
 The top performing Small Cap Index stocks year to date are
Now, more recently, over last week, the top performing Small Cap Index stocks on the move are


|
||||||||||||||||||||||||||||||||||||||||||||||||
| 12Stocks.com: Investing in Smallcap Index using Exchange Traded Funds | |
|
The following table shows list of key exchange traded funds (ETF) that
help investors track Smallcap index. The following list also includes leveraged ETF funds that track twice or thrice the daily returns of Smallcap indices. Short or inverse ETF funds move in the opposite direction to the index they track and are useful during market pullbacks or during bear markets. Quick View: Move mouse or cursor over ETF symbol (ticker) to view short-term technical chart and over ETF name to view long term chart. Click on ticker or stock name for detailed view. Click on to add stock symbol to your watchlist and to view watchlist. |
12Stocks.com List of ETFs that track Smallcap Index
| Ticker | ETF Name | Watchlist | Recent Price | Smart Investing & Trading Score | Change % | Week % | Year-to-date % |
| IWM | iShares Russell 2000 | | 195.14 | 44 | 1.11 | -1.79 | -2.78% |
| IJR | iShares Core S&P Small-Cap | | 103.30 | 38 | 1.15 | -1.16 | -4.57% |
| IWN | iShares Russell 2000 Value | | 146.73 | 10 | 0.48 | -2.43 | -5.54% |
| IWO | iShares Russell 2000 Growth | | 248.39 | 36 | 0.15 | -2.73 | -1.52% |
| IJS | iShares S&P Small-Cap 600 Value | | 94.21 | 10 | 0.10 | -2.04 | -8.6% |
| XSLV | PowerShares S&P SmallCap Low Volatil ETF | | 41.58 | 18 | 0.39 | -1.21 | -5.82% |
| 12Stocks.com: Charts, Trends, Fundamental Data and Performances of SmallCap Stocks | |
|
We now take in-depth look at all SmallCap stocks including charts, multi-period performances and overall trends (as measured by Smart Investing & Trading Score). One can sort SmallCap stocks (click link to choose) by Daily, Weekly and by Year-to-Date performances. Also, one can sort by size of the company or by market capitalization. |
| Select Your Default Chart Type: | |||||
| |||||
| Click on stock symbol or name for detailed view. Click on to add stock symbol to your watchlist and to view watchlist. Quick View: Move mouse or cursor over "Daily" to quickly view daily technical stock chart and over "Weekly" to view weekly technical stock chart. | |||||

 | LOB Live Oak Bancshares, Inc. |
| Sector: Financials | |
| SubSector: Savings & Loans | |
| MarketCap: 394.23 Millions | |
| Recent Price: 37.05 Smart Investing & Trading Score: 43 | |
| Day Percent Change: 1.01% Day Change: 0.37 | |
| Week Change: -2.32% Year-to-date Change: -18.6% | |
| LOB Links: Profile News Message Board | |
| Charts:- Daily , Weekly | |
| Add LOB to Watchlist: View: Get Complete LOB Trend Analysis ➞ | |
 | CNXN PC Connection, Inc. |
| Sector: Technology | |
| SubSector: Computers Wholesale | |
| MarketCap: 1020.19 Millions | |
| Recent Price: 62.09 Smart Investing & Trading Score: 10 | |
| Day Percent Change: 0.43% Day Change: 0.27 | |
| Week Change: -2.32% Year-to-date Change: -7.6% | |
| CNXN Links: Profile News Message Board | |
| Charts:- Daily , Weekly | |
| Add CNXN to Watchlist: View: Get Complete CNXN Trend Analysis ➞ | |
 | STER Sterling Check Corp. |
| Sector: Technology | |
| SubSector: Software - Infrastructure | |
| MarketCap: 1180 Millions | |
| Recent Price: 15.13 Smart Investing & Trading Score: 48 | |
| Day Percent Change: 0.40% Day Change: 0.06 | |
| Week Change: -2.32% Year-to-date Change: 8.6% | |
| STER Links: Profile News Message Board | |
| Charts:- Daily , Weekly | |
| Add STER to Watchlist: View: Get Complete STER Trend Analysis ➞ | |
 | DGII Digi International Inc. |
| Sector: Technology | |
| SubSector: Communication Equipment | |
| MarketCap: 257.339 Millions | |
| Recent Price: 30.19 Smart Investing & Trading Score: 54 | |
| Day Percent Change: 0.10% Day Change: 0.03 | |
| Week Change: -2.33% Year-to-date Change: 16.1% | |
| DGII Links: Profile News Message Board | |
| Charts:- Daily , Weekly | |
| Add DGII to Watchlist: View: Get Complete DGII Trend Analysis ➞ | |
 | RDN Radian Group Inc. |
| Sector: Financials | |
| SubSector: Property & Casualty Insurance | |
| MarketCap: 2950.12 Millions | |
| Recent Price: 29.54 Smart Investing & Trading Score: 43 | |
| Day Percent Change: 0.72% Day Change: 0.21 | |
| Week Change: -2.35% Year-to-date Change: 3.5% | |
| RDN Links: Profile News Message Board | |
| Charts:- Daily , Weekly | |
| Add RDN to Watchlist: View: Get Complete RDN Trend Analysis ➞ | |
 | MTSI MACOM Technology Solutions Holdings, Inc. |
| Sector: Technology | |
| SubSector: Semiconductor - Broad Line | |
| MarketCap: 1214.42 Millions | |
| Recent Price: 96.09 Smart Investing & Trading Score: 39 | |
| Day Percent Change: -0.31% Day Change: -0.30 | |
| Week Change: -2.35% Year-to-date Change: 3.4% | |
| MTSI Links: Profile News Message Board | |
| Charts:- Daily , Weekly | |
| Add MTSI to Watchlist: View: Get Complete MTSI Trend Analysis ➞ | |
 | FTAI Fortress Transportation and Infrastructure Investors LLC |
| Sector: Transports | |
| SubSector: Rental & Leasing Services | |
| MarketCap: 758.344 Millions | |
| Recent Price: 70.06 Smart Investing & Trading Score: 58 | |
| Day Percent Change: 0.22% Day Change: 0.16 | |
| Week Change: -2.35% Year-to-date Change: 51.0% | |
| FTAI Links: Profile News Message Board | |
| Charts:- Daily , Weekly | |
| Add FTAI to Watchlist: View: Get Complete FTAI Trend Analysis ➞ | |
 | GMRE Global Medical REIT Inc. |
| Sector: Industrials | |
| SubSector: Conglomerates | |
| MarketCap: 529.748 Millions | |
| Recent Price: 8.12 Smart Investing & Trading Score: 35 | |
| Day Percent Change: 0.31% Day Change: 0.03 | |
| Week Change: -2.35% Year-to-date Change: -26.9% | |
| GMRE Links: Profile News Message Board | |
| Charts:- Daily , Weekly | |
| Add GMRE to Watchlist: View: Get Complete GMRE Trend Analysis ➞ | |
 | DLTH Duluth Holdings Inc. |
| Sector: Services & Goods | |
| SubSector: Apparel Stores | |
| MarketCap: 180.008 Millions | |
| Recent Price: 4.34 Smart Investing & Trading Score: 10 | |
| Day Percent Change: -0.12% Day Change: 0.00 | |
| Week Change: -2.36% Year-to-date Change: -19.4% | |
| DLTH Links: Profile News Message Board | |
| Charts:- Daily , Weekly | |
| Add DLTH to Watchlist: View: Get Complete DLTH Trend Analysis ➞ | |
 | MGRC McGrath RentCorp |
| Sector: Transports | |
| SubSector: Rental & Leasing Services | |
| MarketCap: 1289.04 Millions | |
| Recent Price: 112.28 Smart Investing & Trading Score: 18 | |
| Day Percent Change: 0.67% Day Change: 0.75 | |
| Week Change: -2.37% Year-to-date Change: -6.1% | |
| MGRC Links: Profile News Message Board | |
| Charts:- Daily , Weekly | |
| Add MGRC to Watchlist: View: Get Complete MGRC Trend Analysis ➞ | |
 | VIAV Viavi Solutions Inc. |
| Sector: Technology | |
| SubSector: Communication Equipment | |
| MarketCap: 2653.29 Millions | |
| Recent Price: 8.25 Smart Investing & Trading Score: 18 | |
| Day Percent Change: 0.98% Day Change: 0.08 | |
| Week Change: -2.37% Year-to-date Change: -18.1% | |
| VIAV Links: Profile News Message Board | |
| Charts:- Daily , Weekly | |
| Add VIAV to Watchlist: View: Get Complete VIAV Trend Analysis ➞ | |
 | CCS Century Communities, Inc. |
| Sector: Industrials | |
| SubSector: Residential Construction | |
| MarketCap: 459.206 Millions | |
| Recent Price: 81.29 Smart Investing & Trading Score: 10 | |
| Day Percent Change: 2.51% Day Change: 1.99 | |
| Week Change: -2.38% Year-to-date Change: -10.8% | |
| CCS Links: Profile News Message Board | |
| Charts:- Daily , Weekly | |
| Add CCS to Watchlist: View: Get Complete CCS Trend Analysis ➞ | |
 | IRT Independence Realty Trust, Inc. |
| Sector: Financials | |
| SubSector: REIT - Residential | |
| MarketCap: 980.161 Millions | |
| Recent Price: 15.62 Smart Investing & Trading Score: 36 | |
| Day Percent Change: 0.39% Day Change: 0.06 | |
| Week Change: -2.38% Year-to-date Change: 2.1% | |
| IRT Links: Profile News Message Board | |
| Charts:- Daily , Weekly | |
| Add IRT to Watchlist: View: Get Complete IRT Trend Analysis ➞ | |
 | MYE Myers Industries, Inc. |
| Sector: Consumer Staples | |
| SubSector: Rubber & Plastics | |
| MarketCap: 347.57 Millions | |
| Recent Price: 21.22 Smart Investing & Trading Score: 54 | |
| Day Percent Change: 1.19% Day Change: 0.25 | |
| Week Change: -2.39% Year-to-date Change: 8.5% | |
| MYE Links: Profile News Message Board | |
| Charts:- Daily , Weekly | |
| Add MYE to Watchlist: View: Get Complete MYE Trend Analysis ➞ | |
 | AMPX Amprius Technologies, Inc. |
| Sector: Industrials | |
| SubSector: Electrical Equipment & Parts | |
| MarketCap: 608 Millions | |
| Recent Price: 1.84 Smart Investing & Trading Score: 52 | |
| Day Percent Change: 6.07% Day Change: 0.10 | |
| Week Change: -2.39% Year-to-date Change: -63.4% | |
| AMPX Links: Profile News Message Board | |
| Charts:- Daily , Weekly | |
| Add AMPX to Watchlist: View: Get Complete AMPX Trend Analysis ➞ | |
 | AIT Applied Industrial Technologies, Inc. |
| Sector: Services & Goods | |
| SubSector: Industrial Equipment Wholesale | |
| MarketCap: 1531.58 Millions | |
| Recent Price: 186.50 Smart Investing & Trading Score: 36 | |
| Day Percent Change: 1.14% Day Change: 2.09 | |
| Week Change: -2.4% Year-to-date Change: 8.0% | |
| AIT Links: Profile News Message Board | |
| Charts:- Daily , Weekly | |
| Add AIT to Watchlist: View: Get Complete AIT Trend Analysis ➞ | |
 | REI Ring Energy, Inc. |
| Sector: Energy | |
| SubSector: Oil & Gas Drilling & Exploration | |
| MarketCap: 50.8139 Millions | |
| Recent Price: 2.03 Smart Investing & Trading Score: 61 | |
| Day Percent Change: 1.00% Day Change: 0.02 | |
| Week Change: -2.4% Year-to-date Change: 39.0% | |
| REI Links: Profile News Message Board | |
| Charts:- Daily , Weekly | |
| Add REI to Watchlist: View: Get Complete REI Trend Analysis ➞ | |
 | PX P10, Inc. |
| Sector: Financials | |
| SubSector: Asset Management | |
| MarketCap: 1300 Millions | |
| Recent Price: 7.50 Smart Investing & Trading Score: 53 | |
| Day Percent Change: 0.20% Day Change: 0.01 | |
| Week Change: -2.41% Year-to-date Change: -26.6% | |
| PX Links: Profile News Message Board | |
| Charts:- Daily , Weekly | |
| Add PX to Watchlist: View: Get Complete PX Trend Analysis ➞ | |
 | ROCK Gibraltar Industries, Inc. |
| Sector: Materials | |
| SubSector: Steel & Iron | |
| MarketCap: 1341.08 Millions | |
| Recent Price: 72.41 Smart Investing & Trading Score: 10 | |
| Day Percent Change: 1.27% Day Change: 0.91 | |
| Week Change: -2.41% Year-to-date Change: -8.3% | |
| ROCK Links: Profile News Message Board | |
| Charts:- Daily , Weekly | |
| Add ROCK to Watchlist: View: Get Complete ROCK Trend Analysis ➞ | |
 | PAX Patria Investments Limited |
| Sector: Financials | |
| SubSector: Asset Management | |
| MarketCap: 2130 Millions | |
| Recent Price: 13.55 Smart Investing & Trading Score: 25 | |
| Day Percent Change: 0.63% Day Change: 0.08 | |
| Week Change: -2.41% Year-to-date Change: -13.7% | |
| PAX Links: Profile News Message Board | |
| Charts:- Daily , Weekly | |
| Add PAX to Watchlist: View: Get Complete PAX Trend Analysis ➞ | |
 | TPC Tutor Perini Corporation |
| Sector: Industrials | |
| SubSector: Heavy Construction | |
| MarketCap: 382.595 Millions | |
| Recent Price: 13.53 Smart Investing & Trading Score: 46 | |
| Day Percent Change: 0.71% Day Change: 0.10 | |
| Week Change: -2.42% Year-to-date Change: 48.6% | |
| TPC Links: Profile News Message Board | |
| Charts:- Daily , Weekly | |
| Add TPC to Watchlist: View: Get Complete TPC Trend Analysis ➞ | |
 | NABL N-able, Inc. |
| Sector: Technology | |
| SubSector: Information Technology Services | |
| MarketCap: 2590 Millions | |
| Recent Price: 12.26 Smart Investing & Trading Score: 18 | |
| Day Percent Change: 0.95% Day Change: 0.12 | |
| Week Change: -2.43% Year-to-date Change: -7.9% | |
| NABL Links: Profile News Message Board | |
| Charts:- Daily , Weekly | |
| Add NABL to Watchlist: View: Get Complete NABL Trend Analysis ➞ | |
 | KN Knowles Corporation |
| Sector: Technology | |
| SubSector: Communication Equipment | |
| MarketCap: 1231.39 Millions | |
| Recent Price: 15.43 Smart Investing & Trading Score: 10 | |
| Day Percent Change: -0.55% Day Change: -0.08 | |
| Week Change: -2.44% Year-to-date Change: -13.9% | |
| KN Links: Profile News Message Board | |
| Charts:- Daily , Weekly | |
| Add KN to Watchlist: View: Get Complete KN Trend Analysis ➞ | |
 | BOH Bank of Hawaii Corporation |
| Sector: Financials | |
| SubSector: Regional - Pacific Banks | |
| MarketCap: 2305.19 Millions | |
| Recent Price: 56.85 Smart Investing & Trading Score: 10 | |
| Day Percent Change: 1.07% Day Change: 0.60 | |
| Week Change: -2.45% Year-to-date Change: -21.5% | |
| BOH Links: Profile News Message Board | |
| Charts:- Daily , Weekly | |
| Add BOH to Watchlist: View: Get Complete BOH Trend Analysis ➞ | |
 | OBIO Orchestra BioMed Holdings, Inc. |
| Sector: Health Care | |
| SubSector: Biotechnology | |
| MarketCap: 271 Millions | |
| Recent Price: 4.77 Smart Investing & Trading Score: 27 | |
| Day Percent Change: 2.58% Day Change: 0.12 | |
| Week Change: -2.45% Year-to-date Change: -47.6% | |
| OBIO Links: Profile News Message Board | |
| Charts:- Daily , Weekly | |
| Add OBIO to Watchlist: View: Get Complete OBIO Trend Analysis ➞ | |
| For tabular summary view of above stock list: Summary View ➞ 0 - 25 , 25 - 50 , 50 - 75 , 75 - 100 , 100 - 125 , 125 - 150 , 150 - 175 , 175 - 200 , 200 - 225 , 225 - 250 , 250 - 275 , 275 - 300 , 300 - 325 , 325 - 350 , 350 - 375 , 375 - 400 , 400 - 425 , 425 - 450 , 450 - 475 , 475 - 500 , 500 - 525 , 525 - 550 , 550 - 575 , 575 - 600 , 600 - 625 , 625 - 650 , 650 - 675 , 675 - 700 , 700 - 725 , 725 - 750 , 750 - 775 , 775 - 800 , 800 - 825 , 825 - 850 , 850 - 875 , 875 - 900 , 900 - 925 , 925 - 950 , 950 - 975 , 975 - 1000 , 1000 - 1025 , 1025 - 1050 , 1050 - 1075 , 1075 - 1100 , 1100 - 1125 , 1125 - 1150 , 1150 - 1175 , 1175 - 1200 , 1200 - 1225 , 1225 - 1250 , 1250 - 1275 , 1275 - 1300 , 1300 - 1325 , 1325 - 1350 , 1350 - 1375 , 1375 - 1400 , 1400 - 1425 , 1425 - 1450 , 1450 - 1475 , 1475 - 1500 | ||
| Click To Change The Sort Order: By Market Cap or Company Size Performance: Year-to-date, Week and Day | |
| Select Chart Type: | ||
| Too many stocks? View smallcap stocks filtered by marketcap & sector |
| Marketcap: All SmallCap Stocks (default-no microcap), Large, Mid-Range, Small & MicroCap |
| Sector: Tech, Finance, Energy, Staples, Retail, Industrial, Materials, Utilities & Medical |
|
Best Stocks Today 12Stocks.com |
© 2024 12Stocks.com Terms & Conditions Privacy Contact Us
All Information Provided Only For Education And Not To Be Used For Investing or Trading. See Terms & Conditions


One More Thing ... Get Best Stocks Delivered Daily!
Never Ever Miss A Move With Our Top Ten Stocks Lists
Find Best Stocks In Any Market - Bull or Bear Market
Take A Peek At Our Top Ten Stocks Lists: Daily, Weekly, Year-to-Date & Top Trends
Find Best Stocks In Any Market - Bull or Bear Market
Take A Peek At Our Top Ten Stocks Lists: Daily, Weekly, Year-to-Date & Top Trends
Smallcap Stocks With Best Up Trends [0-bearish to 100-bullish]: Badger Meter[100], Apogee Enterprises[100], Cullinan Oncology[100], Oscar Health[100], Richardson Electronics[100], NextNav [100], Lantheus [100], Envestnet [100], Geron [100], Seneca Foods[100], IMAX [100]
Best Smallcap Stocks Year-to-Date:
Agenus [522.66%], CareMax [417.53%], Janux [348.12%], Viking [251.48%], Super Micro[239.3%], Alpine Immune[238.6%], Longboard [184.12%], Vera [161.3%], Avidity Biosciences[159.18%], Hippo [128.32%], Acrivon [118.61%] Best Smallcap Stocks This Week:
Macatawa Bank[45.05%], 23andMe Holding[33.3%], ProKidney [32%], Snap One[29.73%], Vertex Energy[25.96%], ALX Oncology[22.79%], Vanda [21.84%], Expensify [18.37%], E.W. Scripps[15%], Cullinan Oncology[13.89%], Humacyte [12.67%] Best Smallcap Stocks Daily:
23andMe Holding[65.91%], Vertex Energy[33.78%], Expensify [15.23%], Vuzix [13.73%], Badger Meter[12.03%], E.W. Scripps[11.68%], Zura Bio[10.99%], Vaxxinity [10.05%], Barnes Group[9.70%], eHealth [9.68%], Montrose Environmental[8.91%]