
 Login Sign Up


| |||||
 |  | ||||

| 12Stocks.com Market Intelligence |
Best SmallCap Stocks
|
| In a hurry? Small Cap Stock Lists: Performance Trends Table, Stock Charts
Sort Small Cap stocks: Daily, Weekly, Year-to-Date, Market Cap & Trends. Filter Small Cap stocks list by sector: Show all, Tech, Finance, Energy, Staples, Retail, Industrial, Materials, Utilities and HealthCare Filter Small Cap stocks list by size: All Large Medium Small and MicroCap |
| 12Stocks.com Small Cap Stocks Performances & Trends Daily | |||||||||
|
|  The overall Smart Investing & Trading Score is 44 (0-bearish to 100-bullish) which puts Small Cap index in short term neutral trend. The Smart Investing & Trading Score from previous trading session is 58 and hence a deterioration of trend.
| ||||||||
Here are the Smart Investing & Trading Scores of the most requested small cap stocks at 12Stocks.com (click stock name for detailed review):
|


| 12Stocks.com: Investing in Smallcap Index with Stocks | |
|
The following table helps investors and traders sort through current performance and trends (as measured by Smart Investing & Trading Score) of various
stocks in the Smallcap Index. Quick View: Move mouse or cursor over stock symbol (ticker) to view short-term technical chart and over stock name to view long term chart. Click on  to add stock symbol to your watchlist and to add stock symbol to your watchlist and  to view watchlist. Click on any ticker or stock name for detailed market intelligence report for that stock. to view watchlist. Click on any ticker or stock name for detailed market intelligence report for that stock. |
12Stocks.com Performance of Stocks in Smallcap Index
| Ticker | Stock Name | Watchlist | Category | Recent Price | Smart Investing & Trading Score | Change % | Weekly Change% |
| ATKR | Atkore |   | Industrials | 181.21 | 68 | 1.17% | 5.47% |
| OM | Outset Medical | | Health Care | 2.41 | 67 | -5.49% | 5.47% |
| SLVM | Sylvamo | | Materials | 61.63 | 93 | -0.90% | 5.42% |
| TPH | TRI Pointe | | Industrials | 36.82 | 63 | 1.80% | 5.41% |
| HUMA | Humacyte | | Health Care | 3.90 | 76 | 2.09% | 5.41% |
| CMRE | Costamare | | Transports | 11.52 | 85 | 1.41% | 5.40% |
| DIN | Dine Brands | | Services & Goods | 45.68 | 74 | 0.86% | 5.37% |
| UNIT | Uniti Group | | Financials | 5.59 | 93 | -2.01% | 5.37% |
| JOE | St. Joe | | Financials | 57.81 | 83 | 1.67% | 5.34% |
| AXSM | Axsome | | Health Care | 71.52 | 57 | 0.49% | 5.33% |
| KBH | KB Home | | Industrials | 64.27 | 58 | -0.80% | 5.31% |
| INFN | Infinera | | Technology | 4.97 | 62 | -0.20% | 5.30% |
| PRK | Park National | | Financials | 134.78 | 93 | -1.97% | 5.29% |
| XMTR | Xometry | | Industrials | 16.92 | 44 | 0.89% | 5.29% |
| LBAI | Lakeland Bancorp | | Financials | 12.58 | 67 | -2.02% | 5.27% |
| FIBK | First Interstate | | Financials | 26.95 | 74 | 1.43% | 5.27% |
| GOGO | Gogo | | Technology | 8.79 | 74 | 0.69% | 5.27% |
| NUVL | Nuvalent | | Health Care | 66.07 | 42 | -3.09% | 5.27% |
| AAON | AAON | | Industrials | 89.90 | 83 | 0.26% | 5.26% |
| PGEN | Precigen | | Health Care | 1.40 | 55 | -1.41% | 5.26% |
| ITRI | Itron | | Technology | 94.39 | 88 | -0.03% | 5.25% |
| AX | Axos Financial | | Financials | 52.94 | 49 | 0.23% | 5.25% |
| MXL | MaxLinear | | Technology | 20.68 | 60 | -1.19% | 5.24% |
| LIVN | LivaNova | | Health Care | 55.04 | 78 | -1.61% | 5.22% |
| TTMI | TTM | | Technology | 14.78 | 86 | 1.09% | 5.20% |


| Too many stocks? View smallcap stocks filtered by marketcap & sector |
| Marketcap: All SmallCap Stocks (default-no microcap), Large, Mid-Range, Small |
| Smallcap Sector: Tech, Finance, Energy, Staples, Retail, Industrial, Materials, & Medical |
|
Get the most comprehensive stock market coverage daily at 12Stocks.com ➞ Best Stocks Today ➞ Best Stocks Weekly ➞ Best Stocks Year-to-Date ➞ Best Stocks Trends ➞  Best Stocks Today 12Stocks.com Best Nasdaq Stocks ➞ Best S&P 500 Stocks ➞ Best Tech Stocks ➞ Best Biotech Stocks ➞ |
| Detailed Overview of SmallCap Stocks |
| SmallCap Technical Overview, Leaders & Laggards, Top SmallCap ETF Funds & Detailed SmallCap Stocks List, Charts, Trends & More |
| Smallcap: Technical Analysis, Trends & YTD Performance | |
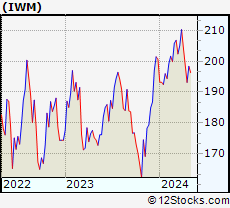
| SmallCap segment as represented by
IWM, an exchange-traded fund [ETF], holds basket of thousands of smallcap stocks from across all major sectors of the US stock market. The smallcap index (contains stocks like Riverbed & Sotheby's) is down by -2.11% and is currently underperforming the overall market by -7.27% year-to-date. Below is a quick view of technical charts and trends: | |
 IWM Weekly Chart |
|
| Long Term Trend: Good | |
| Medium Term Trend: Not Good | |
 IWM Daily Chart |
|
| Short Term Trend: Very Good | |
| Overall Trend Score: 44 | |
| YTD Performance: -2.11% | |
| **Trend Scores & Views Are Only For Educational Purposes And Not For Investing | |
| 12Stocks.com: Top Performing Small Cap Index Stocks | ||||||||||||||||||||||||||||||||||||||||||||||||
 The top performing Small Cap Index stocks year to date are
Now, more recently, over last week, the top performing Small Cap Index stocks on the move are


|
||||||||||||||||||||||||||||||||||||||||||||||||
| 12Stocks.com: Investing in Smallcap Index using Exchange Traded Funds | |
|
The following table shows list of key exchange traded funds (ETF) that
help investors track Smallcap index. The following list also includes leveraged ETF funds that track twice or thrice the daily returns of Smallcap indices. Short or inverse ETF funds move in the opposite direction to the index they track and are useful during market pullbacks or during bear markets. Quick View: Move mouse or cursor over ETF symbol (ticker) to view short-term technical chart and over ETF name to view long term chart. Click on ticker or stock name for detailed view. Click on to add stock symbol to your watchlist and to view watchlist. |
12Stocks.com List of ETFs that track Smallcap Index
| Ticker | ETF Name | Watchlist | Recent Price | Smart Investing & Trading Score | Change % | Week % | Year-to-date % |
| IWM | iShares Russell 2000 | | 196.48 | 44 | -0.61 | 1.73 | -2.11% |
| IJR | iShares Core S&P Small-Cap | | 104.86 | 78 | -0.80 | 1.59 | -3.13% |
| VTWO | Vanguard Russell 2000 ETF | | 79.45 | 63 | -0.60 | 1.75 | -2.03% |
| IWN | iShares Russell 2000 Value | | 150.18 | 68 | -0.73 | 1.62 | -3.32% |
| IWO | iShares Russell 2000 Growth | | 249.86 | 51 | -0.56 | 1.86 | -0.94% |
| IJS | iShares S&P Small-Cap 600 Value | | 96.69 | 60 | -1.04 | 1.13 | -6.19% |
| IJT | iShares S&P Small-Cap 600 Growth | | 125.06 | 63 | -0.25 | 2.33 | -0.06% |
| XSLV | PowerShares S&P SmallCap Low Volatil ETF | | 42.54 | 73 | -0.93 | 0.85 | -3.65% |
| SDD | ProShares UltraShort SmallCap600 | | 19.58 | 42 | 0.46 | -3.74 | 6.26% |
| SBB | ProShares Short SmallCap600 | | 16.50 | 40 | 0.79 | -2.02 | 3.58% |
| SMLV | SPDR SSGA US Small Cap Low Volatil ETF | | 107.33 | 73 | -1.01 | 1.17 | -4.61% |
| SAA | ProShares Ultra SmallCap600 | | 22.66 | 58 | -1.52 | 3.94 | -9.18% |
| 12Stocks.com: Charts, Trends, Fundamental Data and Performances of SmallCap Stocks | |
|
We now take in-depth look at all SmallCap stocks including charts, multi-period performances and overall trends (as measured by Smart Investing & Trading Score). One can sort SmallCap stocks (click link to choose) by Daily, Weekly and by Year-to-Date performances. Also, one can sort by size of the company or by market capitalization. |
| Select Your Default Chart Type: | |||||
| |||||
| Click on stock symbol or name for detailed view. Click on to add stock symbol to your watchlist and to view watchlist. Quick View: Move mouse or cursor over "Daily" to quickly view daily technical stock chart and over "Weekly" to view weekly technical stock chart. | |||||

 | ATKR Atkore International Group Inc. |
| Sector: Industrials | |
| SubSector: Industrial Electrical Equipment | |
| MarketCap: 1086.79 Millions | |
| Recent Price: 181.21 Smart Investing & Trading Score: 68 | |
| Day Percent Change: 1.17% Day Change: 2.10 | |
| Week Change: 5.47% Year-to-date Change: 13.3% | |
| ATKR Links: Profile News Message Board | |
| Charts:- Daily , Weekly | |
| Add ATKR to Watchlist: View: Get Complete ATKR Trend Analysis ➞ | |
 | OM Outset Medical, Inc. |
| Sector: Health Care | |
| SubSector: Medical Devices | |
| MarketCap: 21787 Millions | |
| Recent Price: 2.41 Smart Investing & Trading Score: 67 | |
| Day Percent Change: -5.49% Day Change: -0.14 | |
| Week Change: 5.47% Year-to-date Change: -55.5% | |
| OM Links: Profile News Message Board | |
| Charts:- Daily , Weekly | |
| Add OM to Watchlist: View: Get Complete OM Trend Analysis ➞ | |
 | SLVM Sylvamo Corporation |
| Sector: Materials | |
| SubSector: Paper & Paper Products | |
| MarketCap: 1710 Millions | |
| Recent Price: 61.63 Smart Investing & Trading Score: 93 | |
| Day Percent Change: -0.90% Day Change: -0.56 | |
| Week Change: 5.42% Year-to-date Change: 25.5% | |
| SLVM Links: Profile News Message Board | |
| Charts:- Daily , Weekly | |
| Add SLVM to Watchlist: View: Get Complete SLVM Trend Analysis ➞ | |
 | TPH TRI Pointe Group, Inc. |
| Sector: Industrials | |
| SubSector: Residential Construction | |
| MarketCap: 1140.06 Millions | |
| Recent Price: 36.82 Smart Investing & Trading Score: 63 | |
| Day Percent Change: 1.80% Day Change: 0.65 | |
| Week Change: 5.41% Year-to-date Change: 4.0% | |
| TPH Links: Profile News Message Board | |
| Charts:- Daily , Weekly | |
| Add TPH to Watchlist: View: Get Complete TPH Trend Analysis ➞ | |
 | HUMA Humacyte, Inc. |
| Sector: Health Care | |
| SubSector: Biotechnology | |
| MarketCap: 297 Millions | |
| Recent Price: 3.90 Smart Investing & Trading Score: 76 | |
| Day Percent Change: 2.09% Day Change: 0.08 | |
| Week Change: 5.41% Year-to-date Change: 37.3% | |
| HUMA Links: Profile News Message Board | |
| Charts:- Daily , Weekly | |
| Add HUMA to Watchlist: View: Get Complete HUMA Trend Analysis ➞ | |
 | CMRE Costamare Inc. |
| Sector: Transports | |
| SubSector: Shipping | |
| MarketCap: 492.214 Millions | |
| Recent Price: 11.52 Smart Investing & Trading Score: 85 | |
| Day Percent Change: 1.41% Day Change: 0.16 | |
| Week Change: 5.4% Year-to-date Change: 10.7% | |
| CMRE Links: Profile News Message Board | |
| Charts:- Daily , Weekly | |
| Add CMRE to Watchlist: View: Get Complete CMRE Trend Analysis ➞ | |
 | DIN Dine Brands Global, Inc. |
| Sector: Services & Goods | |
| SubSector: Restaurants | |
| MarketCap: 421.17 Millions | |
| Recent Price: 45.68 Smart Investing & Trading Score: 74 | |
| Day Percent Change: 0.86% Day Change: 0.39 | |
| Week Change: 5.37% Year-to-date Change: -8.0% | |
| DIN Links: Profile News Message Board | |
| Charts:- Daily , Weekly | |
| Add DIN to Watchlist: View: Get Complete DIN Trend Analysis ➞ | |
 | UNIT Uniti Group Inc. |
| Sector: Financials | |
| SubSector: REIT - Industrial | |
| MarketCap: 1363.09 Millions | |
| Recent Price: 5.59 Smart Investing & Trading Score: 93 | |
| Day Percent Change: -2.01% Day Change: -0.12 | |
| Week Change: 5.37% Year-to-date Change: -3.2% | |
| UNIT Links: Profile News Message Board | |
| Charts:- Daily , Weekly | |
| Add UNIT to Watchlist: View: Get Complete UNIT Trend Analysis ➞ | |
 | JOE The St. Joe Company |
| Sector: Financials | |
| SubSector: Real Estate Development | |
| MarketCap: 1029.39 Millions | |
| Recent Price: 57.81 Smart Investing & Trading Score: 83 | |
| Day Percent Change: 1.67% Day Change: 0.95 | |
| Week Change: 5.34% Year-to-date Change: -3.9% | |
| JOE Links: Profile News Message Board | |
| Charts:- Daily , Weekly | |
| Add JOE to Watchlist: View: Get Complete JOE Trend Analysis ➞ | |
 | AXSM Axsome Therapeutics, Inc. |
| Sector: Health Care | |
| SubSector: Biotechnology | |
| MarketCap: 2284.25 Millions | |
| Recent Price: 71.52 Smart Investing & Trading Score: 57 | |
| Day Percent Change: 0.49% Day Change: 0.35 | |
| Week Change: 5.33% Year-to-date Change: -10.1% | |
| AXSM Links: Profile News Message Board | |
| Charts:- Daily , Weekly | |
| Add AXSM to Watchlist: View: Get Complete AXSM Trend Analysis ➞ | |
 | KBH KB Home |
| Sector: Industrials | |
| SubSector: Residential Construction | |
| MarketCap: 1249.66 Millions | |
| Recent Price: 64.27 Smart Investing & Trading Score: 58 | |
| Day Percent Change: -0.80% Day Change: -0.52 | |
| Week Change: 5.31% Year-to-date Change: 2.9% | |
| KBH Links: Profile News Message Board | |
| Charts:- Daily , Weekly | |
| Add KBH to Watchlist: View: Get Complete KBH Trend Analysis ➞ | |
 | INFN Infinera Corporation |
| Sector: Technology | |
| SubSector: Communication Equipment | |
| MarketCap: 943 Millions | |
| Recent Price: 4.97 Smart Investing & Trading Score: 62 | |
| Day Percent Change: -0.20% Day Change: -0.01 | |
| Week Change: 5.3% Year-to-date Change: 4.6% | |
| INFN Links: Profile News Message Board | |
| Charts:- Daily , Weekly | |
| Add INFN to Watchlist: View: Get Complete INFN Trend Analysis ➞ | |
 | PRK Park National Corporation |
| Sector: Financials | |
| SubSector: Regional - Midwest Banks | |
| MarketCap: 1416.6 Millions | |
| Recent Price: 134.78 Smart Investing & Trading Score: 93 | |
| Day Percent Change: -1.97% Day Change: -2.71 | |
| Week Change: 5.29% Year-to-date Change: 1.5% | |
| PRK Links: Profile News Message Board | |
| Charts:- Daily , Weekly | |
| Add PRK to Watchlist: View: Get Complete PRK Trend Analysis ➞ | |
 | XMTR Xometry, Inc. |
| Sector: Industrials | |
| SubSector: Specialty Industrial Machinery | |
| MarketCap: 1050 Millions | |
| Recent Price: 16.92 Smart Investing & Trading Score: 44 | |
| Day Percent Change: 0.89% Day Change: 0.15 | |
| Week Change: 5.29% Year-to-date Change: -53.9% | |
| XMTR Links: Profile News Message Board | |
| Charts:- Daily , Weekly | |
| Add XMTR to Watchlist: View: Get Complete XMTR Trend Analysis ➞ | |
 | LBAI Lakeland Bancorp, Inc. |
| Sector: Financials | |
| SubSector: Regional - Northeast Banks | |
| MarketCap: 534.599 Millions | |
| Recent Price: 12.58 Smart Investing & Trading Score: 67 | |
| Day Percent Change: -2.02% Day Change: -0.26 | |
| Week Change: 5.27% Year-to-date Change: -14.9% | |
| LBAI Links: Profile News Message Board | |
| Charts:- Daily , Weekly | |
| Add LBAI to Watchlist: View: Get Complete LBAI Trend Analysis ➞ | |
 | FIBK First Interstate BancSystem, Inc. |
| Sector: Financials | |
| SubSector: Regional - Pacific Banks | |
| MarketCap: 1797.69 Millions | |
| Recent Price: 26.95 Smart Investing & Trading Score: 74 | |
| Day Percent Change: 1.43% Day Change: 0.38 | |
| Week Change: 5.27% Year-to-date Change: -12.4% | |
| FIBK Links: Profile News Message Board | |
| Charts:- Daily , Weekly | |
| Add FIBK to Watchlist: View: Get Complete FIBK Trend Analysis ➞ | |
 | GOGO Gogo Inc. |
| Sector: Technology | |
| SubSector: Diversified Communication Services | |
| MarketCap: 307.064 Millions | |
| Recent Price: 8.79 Smart Investing & Trading Score: 74 | |
| Day Percent Change: 0.69% Day Change: 0.06 | |
| Week Change: 5.27% Year-to-date Change: -13.2% | |
| GOGO Links: Profile News Message Board | |
| Charts:- Daily , Weekly | |
| Add GOGO to Watchlist: View: Get Complete GOGO Trend Analysis ➞ | |
 | NUVL Nuvalent, Inc. |
| Sector: Health Care | |
| SubSector: Biotechnology | |
| MarketCap: 2400 Millions | |
| Recent Price: 66.07 Smart Investing & Trading Score: 42 | |
| Day Percent Change: -3.09% Day Change: -2.11 | |
| Week Change: 5.27% Year-to-date Change: -10.1% | |
| NUVL Links: Profile News Message Board | |
| Charts:- Daily , Weekly | |
| Add NUVL to Watchlist: View: Get Complete NUVL Trend Analysis ➞ | |
 | AAON AAON, Inc. |
| Sector: Industrials | |
| SubSector: General Building Materials | |
| MarketCap: 2533.63 Millions | |
| Recent Price: 89.90 Smart Investing & Trading Score: 83 | |
| Day Percent Change: 0.26% Day Change: 0.23 | |
| Week Change: 5.26% Year-to-date Change: 21.7% | |
| AAON Links: Profile News Message Board | |
| Charts:- Daily , Weekly | |
| Add AAON to Watchlist: View: Get Complete AAON Trend Analysis ➞ | |
 | PGEN Precigen, Inc. |
| Sector: Health Care | |
| SubSector: Biotechnology | |
| MarketCap: 564.785 Millions | |
| Recent Price: 1.40 Smart Investing & Trading Score: 55 | |
| Day Percent Change: -1.41% Day Change: -0.02 | |
| Week Change: 5.26% Year-to-date Change: 4.5% | |
| PGEN Links: Profile News Message Board | |
| Charts:- Daily , Weekly | |
| Add PGEN to Watchlist: View: Get Complete PGEN Trend Analysis ➞ | |
 | ITRI Itron, Inc. |
| Sector: Technology | |
| SubSector: Scientific & Technical Instruments | |
| MarketCap: 2222.23 Millions | |
| Recent Price: 94.39 Smart Investing & Trading Score: 88 | |
| Day Percent Change: -0.03% Day Change: -0.03 | |
| Week Change: 5.25% Year-to-date Change: 25.0% | |
| ITRI Links: Profile News Message Board | |
| Charts:- Daily , Weekly | |
| Add ITRI to Watchlist: View: Get Complete ITRI Trend Analysis ➞ | |
 | AX Axos Financial, Inc. |
| Sector: Financials | |
| SubSector: Savings & Loans | |
| MarketCap: 1037.3 Millions | |
| Recent Price: 52.94 Smart Investing & Trading Score: 49 | |
| Day Percent Change: 0.23% Day Change: 0.12 | |
| Week Change: 5.25% Year-to-date Change: -3.0% | |
| AX Links: Profile News Message Board | |
| Charts:- Daily , Weekly | |
| Add AX to Watchlist: View: Get Complete AX Trend Analysis ➞ | |
 | MXL MaxLinear, Inc. |
| Sector: Technology | |
| SubSector: Semiconductor - Integrated Circuits | |
| MarketCap: 751.31 Millions | |
| Recent Price: 20.68 Smart Investing & Trading Score: 60 | |
| Day Percent Change: -1.19% Day Change: -0.25 | |
| Week Change: 5.24% Year-to-date Change: -13.0% | |
| MXL Links: Profile News Message Board | |
| Charts:- Daily , Weekly | |
| Add MXL to Watchlist: View: Get Complete MXL Trend Analysis ➞ | |
 | LIVN LivaNova PLC |
| Sector: Health Care | |
| SubSector: Medical Appliances & Equipment | |
| MarketCap: 2060.5 Millions | |
| Recent Price: 55.04 Smart Investing & Trading Score: 78 | |
| Day Percent Change: -1.61% Day Change: -0.90 | |
| Week Change: 5.22% Year-to-date Change: 6.4% | |
| LIVN Links: Profile News Message Board | |
| Charts:- Daily , Weekly | |
| Add LIVN to Watchlist: View: Get Complete LIVN Trend Analysis ➞ | |
 | TTMI TTM Technologies, Inc. |
| Sector: Technology | |
| SubSector: Printed Circuit Boards | |
| MarketCap: 1028.35 Millions | |
| Recent Price: 14.78 Smart Investing & Trading Score: 86 | |
| Day Percent Change: 1.09% Day Change: 0.16 | |
| Week Change: 5.2% Year-to-date Change: -6.5% | |
| TTMI Links: Profile News Message Board | |
| Charts:- Daily , Weekly | |
| Add TTMI to Watchlist: View: Get Complete TTMI Trend Analysis ➞ | |
| Too many stocks? View smallcap stocks filtered by marketcap & sector |
| Marketcap: All SmallCap Stocks (default-no microcap), Large, Mid-Range, Small & MicroCap |
| Sector: Tech, Finance, Energy, Staples, Retail, Industrial, Materials, Utilities & Medical |
|
Best Stocks Today 12Stocks.com |
© 2024 12Stocks.com Terms & Conditions Privacy Contact Us
All Information Provided Only For Education And Not To Be Used For Investing or Trading. See Terms & Conditions


One More Thing ... Get Best Stocks Delivered Daily!
Never Ever Miss A Move With Our Top Ten Stocks Lists
Find Best Stocks In Any Market - Bull or Bear Market
Take A Peek At Our Top Ten Stocks Lists: Daily, Weekly, Year-to-Date & Top Trends
Find Best Stocks In Any Market - Bull or Bear Market
Take A Peek At Our Top Ten Stocks Lists: Daily, Weekly, Year-to-Date & Top Trends
Smallcap Stocks With Best Up Trends [0-bearish to 100-bullish]: B. Riley[100], Central Pacific[100], California Water[100], Cricut [100], Carpenter [100], Haemonetics [100], Sanmina [100], Trustmark [100], Comstock Resources[100], EchoStar [100], Mueller Industries[100]
Best Smallcap Stocks Year-to-Date:
CareMax [490.72%], Janux [338.34%], Viking [270.02%], Alpine Immune[239.52%], Longboard [218%], Super Micro[177%], Arcutis Bio[166.56%], Avidity Biosciences[159.79%], Vera [149.94%], Hippo [128.87%], Stoke [122.15%] Best Smallcap Stocks This Week:
Matterport [168.97%], B. Riley[73.54%], Impinj [33.73%], ProKidney [32.84%], Seres [32.65%], Riot Blockchain[32.64%], Ribbon [25.58%], Cullinan Oncology[22.92%], P.A.M. Transportation[22.85%], NuScale Power[21.44%], Hibbett Sports[21.03%] Best Smallcap Stocks Daily:
Impinj [28.65%], P.A.M. Transportation[17.95%], B. Riley[16.61%], Strategic Education[16.28%], OptiNose [14.56%], JELD-WEN Holding[11.54%], Sonic Automotive[10.86%], Intevac [10.54%], SiTime [8.84%], Noodles & [8.08%], ProKidney [7.75%]