
 Login Sign Up


| |||||
 |  | ||||

| 12Stocks.com Market Intelligence |
Best SmallCap Stocks
|
| In a hurry? Small Cap Stock Lists: Performance Trends Table, Stock Charts
Sort Small Cap stocks: Daily, Weekly, Year-to-Date, Market Cap & Trends. Filter Small Cap stocks list by sector: Show all, Tech, Finance, Energy, Staples, Retail, Industrial, Materials, Utilities and HealthCare Filter Small Cap stocks list by size: All Large Medium Small and MicroCap |
| 12Stocks.com Small Cap Stocks Performances & Trends Daily | |||||||||
|
|  The overall Smart Investing & Trading Score is 23 (0-bearish to 100-bullish) which puts Small Cap index in short term bearish to neutral trend. The Smart Investing & Trading Score from previous trading session is 13 and hence an improvement of trend.
| ||||||||
Here are the Smart Investing & Trading Scores of the most requested small cap stocks at 12Stocks.com (click stock name for detailed review):
|


| 12Stocks.com: Investing in Smallcap Index with Stocks | |
|
The following table helps investors and traders sort through current performance and trends (as measured by Smart Investing & Trading Score) of various
stocks in the Smallcap Index. Quick View: Move mouse or cursor over stock symbol (ticker) to view short-term technical chart and over stock name to view long term chart. Click on  to add stock symbol to your watchlist and to add stock symbol to your watchlist and  to view watchlist. Click on any ticker or stock name for detailed market intelligence report for that stock. to view watchlist. Click on any ticker or stock name for detailed market intelligence report for that stock. |
12Stocks.com Performance of Stocks in Smallcap Index
| Ticker | Stock Name | Watchlist | Category | Recent Price | Smart Investing & Trading Score | Change % | Weekly Change% |
| JACK | Jack in |   | Services & Goods | 58.16 | 10 | -1.24% | -2.33% |
| SBRA | Sabra Health | | Financials | 13.43 | 23 | -0.22% | -2.33% |
| KODK | Eastman Kodak | | Technology | 4.61 | 68 | 1.10% | -2.33% |
| RCKY | Rocky Brands | | Consumer Staples | 25.89 | 13 | -2.71% | -2.34% |
| ENSG | Ensign Group | | Health Care | 116.48 | 26 | -1.14% | -2.35% |
| ALCO | Alico | | Consumer Staples | 26.86 | 18 | 0.79% | -2.36% |
| GNL | Global Net | | Financials | 6.62 | 20 | 0.61% | -2.36% |
| CARS | Cars.com | | Services & Goods | 16.17 | 25 | 0.06% | -2.36% |
| KNSA | Kiniksa | | Health Care | 16.88 | 10 | -0.41% | -2.37% |
| DORM | Dorman Products | | Consumer Staples | 87.91 | 46 | -0.10% | -2.38% |
| GSHD | Goosehead Insurance | | Financials | 56.70 | 18 | 0.35% | -2.38% |
| REPL | Replimune Group | | Health Care | 6.97 | 20 | -3.33% | -2.38% |
| RYI | Ryerson Holding | | Industrials | 31.85 | 10 | -0.31% | -2.39% |
| RYI | Ryerson Holding | | Industrials | 9.45 | 10 | 0.64% | -2.39% |
| CNX | CNX Resources | | Energy | 23.70 | 58 | -0.63% | -2.39% |
| BNL | Broadstone Net | | Financials | 14.32 | 20 | 0.21% | -2.39% |
| AMPX | Amprius | | Industrials | 1.84 | 52 | 6.07% | -2.39% |
| EGRX | Eagle | | Health Care | 4.48 | 10 | 2.05% | -2.40% |
| LBAI | Lakeland Bancorp | | Financials | 11.36 | 20 | 0.89% | -2.41% |
| WEYS | Weyco Group | | Consumer Staples | 28.39 | 10 | -0.70% | -2.41% |
| PAX | Patria s | | Financials | 13.55 | 25 | 0.63% | -2.41% |
| EEX | Emerald Holding | | Services & Goods | 6.07 | 5 | -2.41% | -2.41% |
| EGAN | eGain | | Technology | 6.06 | 10 | -1.14% | -2.42% |
| SFNC | Simmons First | | Financials | 17.69 | 28 | 1.32% | -2.43% |
| SCL | Stepan | | Materials | 82.06 | 10 | 0.55% | -2.43% |


| Too many stocks? View smallcap stocks filtered by marketcap & sector |
| Marketcap: All SmallCap Stocks (default-no microcap), Large, Mid-Range, Small |
| Smallcap Sector: Tech, Finance, Energy, Staples, Retail, Industrial, Materials, & Medical |
|
Get the most comprehensive stock market coverage daily at 12Stocks.com ➞ Best Stocks Today ➞ Best Stocks Weekly ➞ Best Stocks Year-to-Date ➞ Best Stocks Trends ➞  Best Stocks Today 12Stocks.com Best Nasdaq Stocks ➞ Best S&P 500 Stocks ➞ Best Tech Stocks ➞ Best Biotech Stocks ➞ |
| Detailed Overview of SmallCap Stocks |
| SmallCap Technical Overview, Leaders & Laggards, Top SmallCap ETF Funds & Detailed SmallCap Stocks List, Charts, Trends & More |
| Smallcap: Technical Analysis, Trends & YTD Performance | |
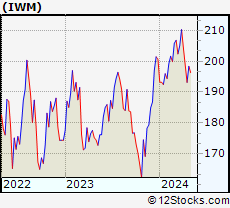
| SmallCap segment as represented by
IWM, an exchange-traded fund [ETF], holds basket of thousands of smallcap stocks from across all major sectors of the US stock market. The smallcap index (contains stocks like Riverbed & Sotheby's) is down by -3.92% and is currently underperforming the overall market by -8.11% year-to-date. Below is a quick view of technical charts and trends: | |
 IWM Weekly Chart |
|
| Long Term Trend: Not Good | |
| Medium Term Trend: Not Good | |
 IWM Daily Chart |
|
| Short Term Trend: Not Good | |
| Overall Trend Score: 23 | |
| YTD Performance: -3.92% | |
| **Trend Scores & Views Are Only For Educational Purposes And Not For Investing | |
| 12Stocks.com: Top Performing Small Cap Index Stocks | ||||||||||||||||||||||||||||||||||||||||||||||||
 The top performing Small Cap Index stocks year to date are
Now, more recently, over last week, the top performing Small Cap Index stocks on the move are


|
||||||||||||||||||||||||||||||||||||||||||||||||
| 12Stocks.com: Investing in Smallcap Index using Exchange Traded Funds | |
|
The following table shows list of key exchange traded funds (ETF) that
help investors track Smallcap index. The following list also includes leveraged ETF funds that track twice or thrice the daily returns of Smallcap indices. Short or inverse ETF funds move in the opposite direction to the index they track and are useful during market pullbacks or during bear markets. Quick View: Move mouse or cursor over ETF symbol (ticker) to view short-term technical chart and over ETF name to view long term chart. Click on ticker or stock name for detailed view. Click on to add stock symbol to your watchlist and to view watchlist. |
12Stocks.com List of ETFs that track Smallcap Index
| Ticker | ETF Name | Watchlist | Recent Price | Smart Investing & Trading Score | Change % | Week % | Year-to-date % |
| IWM | iShares Russell 2000 | | 192.84 | 23 | -0.08 | -2.94 | -3.92% |
| IJR | iShares Core S&P Small-Cap | | 102.34 | 10 | 0.21 | -2.08 | -5.46% |
| VTWO | Vanguard Russell 2000 ETF | | 77.95 | 23 | -0.13 | -2.95 | -3.88% |
| IWN | iShares Russell 2000 Value | | 146.33 | 10 | 0.21 | -2.69 | -5.79% |
| IJS | iShares S&P Small-Cap 600 Value | | 94.51 | 18 | 0.41 | -1.73 | -8.31% |
| IWO | iShares Russell 2000 Growth | | 246.94 | 36 | -0.44 | -3.3 | -2.09% |
| IJT | iShares S&P Small-Cap 600 Growth | | 121.57 | 13 | -0.22 | -2.57 | -2.85% |
| XSLV | PowerShares S&P SmallCap Low Volatil ETF | | 41.65 | 25 | 0.56 | -1.05 | -5.66% |
| SAA | ProShares Ultra SmallCap600 | | 21.62 | 10 | -0.18 | -4.17 | -13.35% |
| SMLV | SPDR SSGA US Small Cap Low Volatil ETF | | 103.83 | 10 | 0.16 | -1.13 | -7.72% |
| SBB | ProShares Short SmallCap600 | | 16.98 | 100 | 0.77 | 2.62 | 6.59% |
| SDD | ProShares UltraShort SmallCap600 | | 20.69 | 95 | 0.44 | 4.33 | 12.28% |
| 12Stocks.com: Charts, Trends, Fundamental Data and Performances of SmallCap Stocks | |
|
We now take in-depth look at all SmallCap stocks including charts, multi-period performances and overall trends (as measured by Smart Investing & Trading Score). One can sort SmallCap stocks (click link to choose) by Daily, Weekly and by Year-to-Date performances. Also, one can sort by size of the company or by market capitalization. |
| Select Your Default Chart Type: | |||||
| |||||
| Click on stock symbol or name for detailed view. Click on to add stock symbol to your watchlist and to view watchlist. Quick View: Move mouse or cursor over "Daily" to quickly view daily technical stock chart and over "Weekly" to view weekly technical stock chart. | |||||

 | JACK Jack in the Box Inc. |
| Sector: Services & Goods | |
| SubSector: Restaurants | |
| MarketCap: 633.87 Millions | |
| Recent Price: 58.16 Smart Investing & Trading Score: 10 | |
| Day Percent Change: -1.24% Day Change: -0.73 | |
| Week Change: -2.33% Year-to-date Change: -28.8% | |
| JACK Links: Profile News Message Board | |
| Charts:- Daily , Weekly | |
| Add JACK to Watchlist: View: Get Complete JACK Trend Analysis ➞ | |
 | SBRA Sabra Health Care REIT, Inc. |
| Sector: Financials | |
| SubSector: REIT - Healthcare Facilities | |
| MarketCap: 2576.54 Millions | |
| Recent Price: 13.43 Smart Investing & Trading Score: 23 | |
| Day Percent Change: -0.22% Day Change: -0.03 | |
| Week Change: -2.33% Year-to-date Change: -5.9% | |
| SBRA Links: Profile News Message Board | |
| Charts:- Daily , Weekly | |
| Add SBRA to Watchlist: View: Get Complete SBRA Trend Analysis ➞ | |
 | KODK Eastman Kodak Company |
| Sector: Technology | |
| SubSector: Electronic Equipment | |
| MarketCap: 78.47 Millions | |
| Recent Price: 4.61 Smart Investing & Trading Score: 68 | |
| Day Percent Change: 1.10% Day Change: 0.05 | |
| Week Change: -2.33% Year-to-date Change: 18.2% | |
| KODK Links: Profile News Message Board | |
| Charts:- Daily , Weekly | |
| Add KODK to Watchlist: View: Get Complete KODK Trend Analysis ➞ | |
 | RCKY Rocky Brands, Inc. |
| Sector: Consumer Staples | |
| SubSector: Textile - Apparel Footwear & Accessories | |
| MarketCap: 137.47 Millions | |
| Recent Price: 25.89 Smart Investing & Trading Score: 13 | |
| Day Percent Change: -2.71% Day Change: -0.72 | |
| Week Change: -2.34% Year-to-date Change: -14.2% | |
| RCKY Links: Profile News Message Board | |
| Charts:- Daily , Weekly | |
| Add RCKY to Watchlist: View: Get Complete RCKY Trend Analysis ➞ | |
 | ENSG The Ensign Group, Inc. |
| Sector: Health Care | |
| SubSector: Long-Term Care Facilities | |
| MarketCap: 2053.76 Millions | |
| Recent Price: 116.48 Smart Investing & Trading Score: 26 | |
| Day Percent Change: -1.14% Day Change: -1.34 | |
| Week Change: -2.35% Year-to-date Change: 3.8% | |
| ENSG Links: Profile News Message Board | |
| Charts:- Daily , Weekly | |
| Add ENSG to Watchlist: View: Get Complete ENSG Trend Analysis ➞ | |
 | ALCO Alico, Inc. |
| Sector: Consumer Staples | |
| SubSector: Farm Products | |
| MarketCap: 221.187 Millions | |
| Recent Price: 26.86 Smart Investing & Trading Score: 18 | |
| Day Percent Change: 0.79% Day Change: 0.21 | |
| Week Change: -2.36% Year-to-date Change: -7.6% | |
| ALCO Links: Profile News Message Board | |
| Charts:- Daily , Weekly | |
| Add ALCO to Watchlist: View: Get Complete ALCO Trend Analysis ➞ | |
 | GNL Global Net Lease, Inc. |
| Sector: Financials | |
| SubSector: REIT - Diversified | |
| MarketCap: 1362.73 Millions | |
| Recent Price: 6.62 Smart Investing & Trading Score: 20 | |
| Day Percent Change: 0.61% Day Change: 0.04 | |
| Week Change: -2.36% Year-to-date Change: -33.5% | |
| GNL Links: Profile News Message Board | |
| Charts:- Daily , Weekly | |
| Add GNL to Watchlist: View: Get Complete GNL Trend Analysis ➞ | |
 | CARS Cars.com Inc. |
| Sector: Services & Goods | |
| SubSector: Auto Dealerships | |
| MarketCap: 290.321 Millions | |
| Recent Price: 16.17 Smart Investing & Trading Score: 25 | |
| Day Percent Change: 0.06% Day Change: 0.01 | |
| Week Change: -2.36% Year-to-date Change: -14.8% | |
| CARS Links: Profile News Message Board | |
| Charts:- Daily , Weekly | |
| Add CARS to Watchlist: View: Get Complete CARS Trend Analysis ➞ | |
 | KNSA Kiniksa Pharmaceuticals, Ltd. |
| Sector: Health Care | |
| SubSector: Biotechnology | |
| MarketCap: 780.285 Millions | |
| Recent Price: 16.88 Smart Investing & Trading Score: 10 | |
| Day Percent Change: -0.41% Day Change: -0.07 | |
| Week Change: -2.37% Year-to-date Change: -3.8% | |
| KNSA Links: Profile News Message Board | |
| Charts:- Daily , Weekly | |
| Add KNSA to Watchlist: View: Get Complete KNSA Trend Analysis ➞ | |
 | DORM Dorman Products, Inc. |
| Sector: Consumer Staples | |
| SubSector: Auto Parts | |
| MarketCap: 2028.79 Millions | |
| Recent Price: 87.91 Smart Investing & Trading Score: 46 | |
| Day Percent Change: -0.10% Day Change: -0.09 | |
| Week Change: -2.38% Year-to-date Change: 5.4% | |
| DORM Links: Profile News Message Board | |
| Charts:- Daily , Weekly | |
| Add DORM to Watchlist: View: Get Complete DORM Trend Analysis ➞ | |
 | GSHD Goosehead Insurance, Inc |
| Sector: Financials | |
| SubSector: Insurance Brokers | |
| MarketCap: 1863.57 Millions | |
| Recent Price: 56.70 Smart Investing & Trading Score: 18 | |
| Day Percent Change: 0.35% Day Change: 0.20 | |
| Week Change: -2.38% Year-to-date Change: -25.2% | |
| GSHD Links: Profile News Message Board | |
| Charts:- Daily , Weekly | |
| Add GSHD to Watchlist: View: Get Complete GSHD Trend Analysis ➞ | |
 | REPL Replimune Group, Inc. |
| Sector: Health Care | |
| SubSector: Biotechnology | |
| MarketCap: 367.885 Millions | |
| Recent Price: 6.97 Smart Investing & Trading Score: 20 | |
| Day Percent Change: -3.33% Day Change: -0.24 | |
| Week Change: -2.38% Year-to-date Change: -17.3% | |
| REPL Links: Profile News Message Board | |
| Charts:- Daily , Weekly | |
| Add REPL to Watchlist: View: Get Complete REPL Trend Analysis ➞ | |
 | RYI Ryerson Holding Corporation |
| Sector: Industrials | |
| SubSector: Metal Fabrication | |
| MarketCap: 202.55 Millions | |
| Recent Price: 31.85 Smart Investing & Trading Score: 10 | |
| Day Percent Change: -0.31% Day Change: -0.10 | |
| Week Change: -2.39% Year-to-date Change: -8.2% | |
| RYI Links: Profile News Message Board | |
| Charts:- Daily , Weekly | |
| Add RYI to Watchlist: View: Get Complete RYI Trend Analysis ➞ | |
| RYI Ryerson Holding Corporation |
| Sector: Industrials | |
| SubSector: Metal Fabrication | |
| MarketCap: 202.55 Millions | |
| Recent Price: 9.45 Smart Investing & Trading Score: 10 | |
| Day Percent Change: 0.64% Day Change: 0.06 | |
| Week Change: -2.39% Year-to-date Change: -8.2% | |
| RYI Links: Profile News Message Board | |
| Charts:- Daily , Weekly | |
| Add RYI to Watchlist: View: Get Complete RYI Trend Analysis ➞ | |
 | CNX CNX Resources Corporation |
| Sector: Energy | |
| SubSector: Independent Oil & Gas | |
| MarketCap: 1344.33 Millions | |
| Recent Price: 23.70 Smart Investing & Trading Score: 58 | |
| Day Percent Change: -0.63% Day Change: -0.15 | |
| Week Change: -2.39% Year-to-date Change: 18.5% | |
| CNX Links: Profile News Message Board | |
| Charts:- Daily , Weekly | |
| Add CNX to Watchlist: View: Get Complete CNX Trend Analysis ➞ | |
 | BNL Broadstone Net Lease, Inc. |
| Sector: Financials | |
| SubSector: REIT Diversified | |
| MarketCap: 27267 Millions | |
| Recent Price: 14.32 Smart Investing & Trading Score: 20 | |
| Day Percent Change: 0.21% Day Change: 0.03 | |
| Week Change: -2.39% Year-to-date Change: -16.8% | |
| BNL Links: Profile News Message Board | |
| Charts:- Daily , Weekly | |
| Add BNL to Watchlist: View: Get Complete BNL Trend Analysis ➞ | |
 | AMPX Amprius Technologies, Inc. |
| Sector: Industrials | |
| SubSector: Electrical Equipment & Parts | |
| MarketCap: 608 Millions | |
| Recent Price: 1.84 Smart Investing & Trading Score: 52 | |
| Day Percent Change: 6.07% Day Change: 0.10 | |
| Week Change: -2.39% Year-to-date Change: -63.4% | |
| AMPX Links: Profile News Message Board | |
| Charts:- Daily , Weekly | |
| Add AMPX to Watchlist: View: Get Complete AMPX Trend Analysis ➞ | |
 | EGRX Eagle Pharmaceuticals, Inc. |
| Sector: Health Care | |
| SubSector: Drugs - Generic | |
| MarketCap: 573.385 Millions | |
| Recent Price: 4.48 Smart Investing & Trading Score: 10 | |
| Day Percent Change: 2.05% Day Change: 0.09 | |
| Week Change: -2.4% Year-to-date Change: -14.3% | |
| EGRX Links: Profile News Message Board | |
| Charts:- Daily , Weekly | |
| Add EGRX to Watchlist: View: Get Complete EGRX Trend Analysis ➞ | |
 | LBAI Lakeland Bancorp, Inc. |
| Sector: Financials | |
| SubSector: Regional - Northeast Banks | |
| MarketCap: 534.599 Millions | |
| Recent Price: 11.36 Smart Investing & Trading Score: 20 | |
| Day Percent Change: 0.89% Day Change: 0.10 | |
| Week Change: -2.41% Year-to-date Change: -23.2% | |
| LBAI Links: Profile News Message Board | |
| Charts:- Daily , Weekly | |
| Add LBAI to Watchlist: View: Get Complete LBAI Trend Analysis ➞ | |
 | WEYS Weyco Group, Inc. |
| Sector: Consumer Staples | |
| SubSector: Textile - Apparel Footwear & Accessories | |
| MarketCap: 198.87 Millions | |
| Recent Price: 28.39 Smart Investing & Trading Score: 10 | |
| Day Percent Change: -0.70% Day Change: -0.20 | |
| Week Change: -2.41% Year-to-date Change: -9.5% | |
| WEYS Links: Profile News Message Board | |
| Charts:- Daily , Weekly | |
| Add WEYS to Watchlist: View: Get Complete WEYS Trend Analysis ➞ | |
 | PAX Patria Investments Limited |
| Sector: Financials | |
| SubSector: Asset Management | |
| MarketCap: 2130 Millions | |
| Recent Price: 13.55 Smart Investing & Trading Score: 25 | |
| Day Percent Change: 0.63% Day Change: 0.08 | |
| Week Change: -2.41% Year-to-date Change: -13.7% | |
| PAX Links: Profile News Message Board | |
| Charts:- Daily , Weekly | |
| Add PAX to Watchlist: View: Get Complete PAX Trend Analysis ➞ | |
 | EEX Emerald Holding, Inc. |
| Sector: Services & Goods | |
| SubSector: Business Services | |
| MarketCap: 252.682 Millions | |
| Recent Price: 6.07 Smart Investing & Trading Score: 5 | |
| Day Percent Change: -2.41% Day Change: -0.15 | |
| Week Change: -2.41% Year-to-date Change: 1.5% | |
| EEX Links: Profile News Message Board | |
| Charts:- Daily , Weekly | |
| Add EEX to Watchlist: View: Get Complete EEX Trend Analysis ➞ | |
 | EGAN eGain Corporation |
| Sector: Technology | |
| SubSector: Business Software & Services | |
| MarketCap: 201.458 Millions | |
| Recent Price: 6.06 Smart Investing & Trading Score: 10 | |
| Day Percent Change: -1.14% Day Change: -0.07 | |
| Week Change: -2.42% Year-to-date Change: -27.3% | |
| EGAN Links: Profile News Message Board | |
| Charts:- Daily , Weekly | |
| Add EGAN to Watchlist: View: Get Complete EGAN Trend Analysis ➞ | |
 | SFNC Simmons First National Corporation |
| Sector: Financials | |
| SubSector: Money Center Banks | |
| MarketCap: 2125.49 Millions | |
| Recent Price: 17.69 Smart Investing & Trading Score: 28 | |
| Day Percent Change: 1.32% Day Change: 0.23 | |
| Week Change: -2.43% Year-to-date Change: -10.8% | |
| SFNC Links: Profile News Message Board | |
| Charts:- Daily , Weekly | |
| Add SFNC to Watchlist: View: Get Complete SFNC Trend Analysis ➞ | |
 | SCL Stepan Company |
| Sector: Materials | |
| SubSector: Specialty Chemicals | |
| MarketCap: 1812.97 Millions | |
| Recent Price: 82.06 Smart Investing & Trading Score: 10 | |
| Day Percent Change: 0.55% Day Change: 0.45 | |
| Week Change: -2.43% Year-to-date Change: -13.2% | |
| SCL Links: Profile News Message Board | |
| Charts:- Daily , Weekly | |
| Add SCL to Watchlist: View: Get Complete SCL Trend Analysis ➞ | |
| Too many stocks? View smallcap stocks filtered by marketcap & sector |
| Marketcap: All SmallCap Stocks (default-no microcap), Large, Mid-Range, Small & MicroCap |
| Sector: Tech, Finance, Energy, Staples, Retail, Industrial, Materials, Utilities & Medical |
|
Best Stocks Today 12Stocks.com |
© 2024 12Stocks.com Terms & Conditions Privacy Contact Us
All Information Provided Only For Education And Not To Be Used For Investing or Trading. See Terms & Conditions


One More Thing ... Get Best Stocks Delivered Daily!
Never Ever Miss A Move With Our Top Ten Stocks Lists
Find Best Stocks In Any Market - Bull or Bear Market
Take A Peek At Our Top Ten Stocks Lists: Daily, Weekly, Year-to-Date & Top Trends
Find Best Stocks In Any Market - Bull or Bear Market
Take A Peek At Our Top Ten Stocks Lists: Daily, Weekly, Year-to-Date & Top Trends
Smallcap Stocks With Best Up Trends [0-bearish to 100-bullish]: Badger Meter[100], Cullinan Oncology[100], Oscar Health[100], NextNav [100], EchoStar [100], Victory Capital[100], Macatawa Bank[100], IMAX [100], Envestnet [100], ALX Oncology[100], Argan [95]
Best Smallcap Stocks Year-to-Date:
Agenus [500.31%], CareMax [417.53%], Janux [348.12%], Viking [247.5%], Alpine Immune[238.5%], Super Micro[226.63%], Longboard [194.76%], Arcutis Bio[192.57%], Vera [161.3%], Avidity Biosciences[154.87%], Hippo [128.32%] Best Smallcap Stocks This Week:
Macatawa Bank[44.42%], 23andMe Holding[33.3%], ProKidney [32%], Snap One[29.73%], Vertex Energy[25.96%], ALX Oncology[20.64%], Vanda [20.63%], Expensify [18.37%], Badger Meter[16.72%], ContextLogic [15%], Cullinan Oncology[13.89%] Best Smallcap Stocks Daily:
23andMe Holding[65.91%], Vertex Energy[33.78%], Zura Bio[17.20%], Badger Meter[16.65%], ContextLogic [15.81%], Expensify [15.23%], Montrose Environmental[12.84%], Vaxxinity [10.05%], Cipher Mining[8.65%], FiscalNote [8.61%], Vuzix [8.15%]