
 Login Sign Up


| |||||
 |  | ||||

| 12Stocks.com Market Intelligence |
Best SmallCap Stocks
|
| In a hurry? Small Cap Stock Lists: Performance Trends Table, Stock Charts
Sort Small Cap stocks: Daily, Weekly, Year-to-Date, Market Cap & Trends. Filter Small Cap stocks list by sector: Show all, Tech, Finance, Energy, Staples, Retail, Industrial, Materials, Utilities and HealthCare Filter Small Cap stocks list by size: All Large Medium Small and MicroCap |
| 12Stocks.com Small Cap Stocks Performances & Trends Daily | |||||||||
|
|  The overall Smart Investing & Trading Score is 44 (0-bearish to 100-bullish) which puts Small Cap index in short term neutral trend. The Smart Investing & Trading Score from previous trading session is 58 and hence a deterioration of trend.
| ||||||||
Here are the Smart Investing & Trading Scores of the most requested small cap stocks at 12Stocks.com (click stock name for detailed review):
|


| 12Stocks.com: Investing in Smallcap Index with Stocks | |
|
The following table helps investors and traders sort through current performance and trends (as measured by Smart Investing & Trading Score) of various
stocks in the Smallcap Index. Quick View: Move mouse or cursor over stock symbol (ticker) to view short-term technical chart and over stock name to view long term chart. Click on  to add stock symbol to your watchlist and to add stock symbol to your watchlist and  to view watchlist. Click on any ticker or stock name for detailed market intelligence report for that stock. to view watchlist. Click on any ticker or stock name for detailed market intelligence report for that stock. |
12Stocks.com Performance of Stocks in Smallcap Index
| Ticker | Stock Name | Watchlist | Category | Recent Price | Smart Investing & Trading Score | Change % | Weekly Change% |
| OMCL | Omnicell |   | Technology | 27.13 | 30 | -1.09% | -2.52% |
| GTN | Gray Television | | Services & Goods | 5.77 | 45 | -4.15% | -2.53% |
| ATRC | AtriCure | | Health Care | 22.61 | 28 | -1.91% | -2.54% |
| WKHS | Workhorse Group | | Consumer Staples | 0.16 | 18 | -2.18% | -2.54% |
| ADTN | ADTRAN | | Technology | 4.57 | 45 | -3.79% | -2.56% |
| FNLC | First Bancorp | | Financials | 22.40 | 37 | -1.50% | -2.57% |
| CLAR | Clarus | | Consumer Staples | 6.07 | 54 | -3.65% | -2.57% |
| NFBK | Northfield Bancorp | | Financials | 8.29 | 42 | -7.68% | -2.59% |
| TBI | TrueBlue | | Services & Goods | 10.55 | 45 | -4.00% | -2.59% |
| INSE | Inspired Entertainment | | Services & Goods | 8.66 | 20 | -2.37% | -2.59% |
| OBIO | Orchestra BioMed | | Health Care | 4.52 | 17 | 0.67% | -2.59% |
| CRMT | America s | | Services & Goods | 56.72 | 35 | -2.89% | -2.61% |
| FLYW | Flywire | | Technology | 20.55 | 7 | -4.11% | -2.61% |
| ARDX | Ardelyx | | Health Care | 6.31 | 18 | -1.87% | -2.62% |
| VOR | Vor Biopharma | | Health Care | 1.67 | 30 | -4.58% | -2.63% |
| HLLY | Holley | | Services & Goods | 4.07 | 0 | -0.49% | -2.63% |
| GLRE | Greenlight Capital | | Financials | 12.15 | 31 | -1.30% | -2.64% |
| WVE | Wave Life | | Health Care | 4.74 | 51 | -5.39% | -2.67% |
| MC | Moelis & | | Financials | 50.26 | 35 | -6.91% | -2.69% |
| OMI | Owens & Minor | | Services & Goods | 24.12 | 54 | -2.51% | -2.70% |
| HEAR | Turtle Beach | | Technology | 14.05 | 41 | -0.92% | -2.70% |
| MCFT | MasterCraft Boat | | Consumer Staples | 20.53 | 54 | -3.66% | -2.70% |
| HLIO | Helios | | Industrials | 44.70 | 66 | -2.32% | -2.70% |
| TITN | Titan Machinery | | Services & Goods | 22.61 | 10 | -0.22% | -2.71% |
| CMC | Commercial Metals | | Materials | 53.71 | 36 | 0.02% | -2.72% |


| Too many stocks? View smallcap stocks filtered by marketcap & sector |
| Marketcap: All SmallCap Stocks (default-no microcap), Large, Mid-Range, Small |
| Smallcap Sector: Tech, Finance, Energy, Staples, Retail, Industrial, Materials, & Medical |
|
Get the most comprehensive stock market coverage daily at 12Stocks.com ➞ Best Stocks Today ➞ Best Stocks Weekly ➞ Best Stocks Year-to-Date ➞ Best Stocks Trends ➞  Best Stocks Today 12Stocks.com Best Nasdaq Stocks ➞ Best S&P 500 Stocks ➞ Best Tech Stocks ➞ Best Biotech Stocks ➞ |
| Detailed Overview of SmallCap Stocks |
| SmallCap Technical Overview, Leaders & Laggards, Top SmallCap ETF Funds & Detailed SmallCap Stocks List, Charts, Trends & More |
| Smallcap: Technical Analysis, Trends & YTD Performance | |
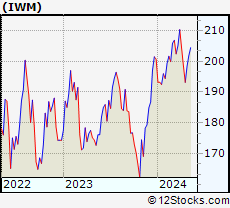
| SmallCap segment as represented by
IWM, an exchange-traded fund [ETF], holds basket of thousands of smallcap stocks from across all major sectors of the US stock market. The smallcap index (contains stocks like Riverbed & Sotheby's) is down by -2.11% and is currently underperforming the overall market by -7.27% year-to-date. Below is a quick view of technical charts and trends: | |
 IWM Weekly Chart |
|
| Long Term Trend: Good | |
| Medium Term Trend: Not Good | |
 IWM Daily Chart |
|
| Short Term Trend: Very Good | |
| Overall Trend Score: 44 | |
| YTD Performance: -2.11% | |
| **Trend Scores & Views Are Only For Educational Purposes And Not For Investing | |
| 12Stocks.com: Top Performing Small Cap Index Stocks | ||||||||||||||||||||||||||||||||||||||||||||||||
 The top performing Small Cap Index stocks year to date are
Now, more recently, over last week, the top performing Small Cap Index stocks on the move are


|
||||||||||||||||||||||||||||||||||||||||||||||||
| 12Stocks.com: Investing in Smallcap Index using Exchange Traded Funds | |
|
The following table shows list of key exchange traded funds (ETF) that
help investors track Smallcap index. The following list also includes leveraged ETF funds that track twice or thrice the daily returns of Smallcap indices. Short or inverse ETF funds move in the opposite direction to the index they track and are useful during market pullbacks or during bear markets. Quick View: Move mouse or cursor over ETF symbol (ticker) to view short-term technical chart and over ETF name to view long term chart. Click on ticker or stock name for detailed view. Click on to add stock symbol to your watchlist and to view watchlist. |
12Stocks.com List of ETFs that track Smallcap Index
| Ticker | ETF Name | Watchlist | Recent Price | Smart Investing & Trading Score | Change % | Week % | Year-to-date % |
| IWM | iShares Russell 2000 | | 196.48 | 44 | -0.61 | 1.73 | -2.11% |
| IJR | iShares Core S&P Small-Cap | | 104.86 | 78 | -0.80 | 1.59 | -3.13% |
| VTWO | Vanguard Russell 2000 ETF | | 79.45 | 63 | -0.60 | 1.75 | -2.03% |
| IWN | iShares Russell 2000 Value | | 150.18 | 68 | -0.73 | 1.62 | -3.32% |
| IWO | iShares Russell 2000 Growth | | 249.86 | 51 | -0.56 | 1.86 | -0.94% |
| IJS | iShares S&P Small-Cap 600 Value | | 96.69 | 60 | -1.04 | 1.13 | -6.19% |
| IJT | iShares S&P Small-Cap 600 Growth | | 125.06 | 63 | -0.25 | 2.33 | -0.06% |
| XSLV | PowerShares S&P SmallCap Low Volatil ETF | | 42.54 | 73 | -0.93 | 0.85 | -3.65% |
| SDD | ProShares UltraShort SmallCap600 | | 19.58 | 42 | 0.46 | -3.74 | 6.26% |
| SBB | ProShares Short SmallCap600 | | 16.50 | 40 | 0.79 | -2.02 | 3.58% |
| SMLV | SPDR SSGA US Small Cap Low Volatil ETF | | 107.33 | 73 | -1.01 | 1.17 | -4.61% |
| SAA | ProShares Ultra SmallCap600 | | 22.66 | 58 | -1.52 | 3.94 | -9.18% |
| 12Stocks.com: Charts, Trends, Fundamental Data and Performances of SmallCap Stocks | |
|
We now take in-depth look at all SmallCap stocks including charts, multi-period performances and overall trends (as measured by Smart Investing & Trading Score). One can sort SmallCap stocks (click link to choose) by Daily, Weekly and by Year-to-Date performances. Also, one can sort by size of the company or by market capitalization. |
| Select Your Default Chart Type: | |||||
| |||||
| Click on stock symbol or name for detailed view. Click on to add stock symbol to your watchlist and to view watchlist. Quick View: Move mouse or cursor over "Daily" to quickly view daily technical stock chart and over "Weekly" to view weekly technical stock chart. | |||||

 | OMCL Omnicell, Inc. |
| Sector: Technology | |
| SubSector: Healthcare Information Services | |
| MarketCap: 2781.05 Millions | |
| Recent Price: 27.13 Smart Investing & Trading Score: 30 | |
| Day Percent Change: -1.09% Day Change: -0.30 | |
| Week Change: -2.52% Year-to-date Change: -27.9% | |
| OMCL Links: Profile News Message Board | |
| Charts:- Daily , Weekly | |
| Add OMCL to Watchlist: View: Get Complete OMCL Trend Analysis ➞ | |
 | GTN Gray Television, Inc. |
| Sector: Services & Goods | |
| SubSector: Broadcasting - TV | |
| MarketCap: 1144.63 Millions | |
| Recent Price: 5.77 Smart Investing & Trading Score: 45 | |
| Day Percent Change: -4.15% Day Change: -0.25 | |
| Week Change: -2.53% Year-to-date Change: -35.6% | |
| GTN Links: Profile News Message Board | |
| Charts:- Daily , Weekly | |
| Add GTN to Watchlist: View: Get Complete GTN Trend Analysis ➞ | |
 | ATRC AtriCure, Inc. |
| Sector: Health Care | |
| SubSector: Medical Instruments & Supplies | |
| MarketCap: 1158.7 Millions | |
| Recent Price: 22.61 Smart Investing & Trading Score: 28 | |
| Day Percent Change: -1.91% Day Change: -0.44 | |
| Week Change: -2.54% Year-to-date Change: -36.7% | |
| ATRC Links: Profile News Message Board | |
| Charts:- Daily , Weekly | |
| Add ATRC to Watchlist: View: Get Complete ATRC Trend Analysis ➞ | |
 | WKHS Workhorse Group Inc. |
| Sector: Consumer Staples | |
| SubSector: Auto Parts | |
| MarketCap: 129.839 Millions | |
| Recent Price: 0.16 Smart Investing & Trading Score: 18 | |
| Day Percent Change: -2.18% Day Change: 0.00 | |
| Week Change: -2.54% Year-to-date Change: -56.3% | |
| WKHS Links: Profile News Message Board | |
| Charts:- Daily , Weekly | |
| Add WKHS to Watchlist: View: Get Complete WKHS Trend Analysis ➞ | |
 | ADTN ADTRAN, Inc. |
| Sector: Technology | |
| SubSector: Communication Equipment | |
| MarketCap: 303.539 Millions | |
| Recent Price: 4.57 Smart Investing & Trading Score: 45 | |
| Day Percent Change: -3.79% Day Change: -0.18 | |
| Week Change: -2.56% Year-to-date Change: -37.7% | |
| ADTN Links: Profile News Message Board | |
| Charts:- Daily , Weekly | |
| Add ADTN to Watchlist: View: Get Complete ADTN Trend Analysis ➞ | |
 | FNLC The First Bancorp, Inc. |
| Sector: Financials | |
| SubSector: Regional - Northeast Banks | |
| MarketCap: 264.799 Millions | |
| Recent Price: 22.40 Smart Investing & Trading Score: 37 | |
| Day Percent Change: -1.50% Day Change: -0.34 | |
| Week Change: -2.57% Year-to-date Change: -20.6% | |
| FNLC Links: Profile News Message Board | |
| Charts:- Daily , Weekly | |
| Add FNLC to Watchlist: View: Get Complete FNLC Trend Analysis ➞ | |
 | CLAR Clarus Corporation |
| Sector: Consumer Staples | |
| SubSector: Sporting Goods | |
| MarketCap: 290.144 Millions | |
| Recent Price: 6.07 Smart Investing & Trading Score: 54 | |
| Day Percent Change: -3.65% Day Change: -0.23 | |
| Week Change: -2.57% Year-to-date Change: -12.0% | |
| CLAR Links: Profile News Message Board | |
| Charts:- Daily , Weekly | |
| Add CLAR to Watchlist: View: Get Complete CLAR Trend Analysis ➞ | |
 | NFBK Northfield Bancorp, Inc. (Staten Island, NY) |
| Sector: Financials | |
| SubSector: Regional - Northeast Banks | |
| MarketCap: 540.699 Millions | |
| Recent Price: 8.29 Smart Investing & Trading Score: 42 | |
| Day Percent Change: -7.68% Day Change: -0.69 | |
| Week Change: -2.59% Year-to-date Change: -34.1% | |
| NFBK Links: Profile News Message Board | |
| Charts:- Daily , Weekly | |
| Add NFBK to Watchlist: View: Get Complete NFBK Trend Analysis ➞ | |
 | TBI TrueBlue, Inc. |
| Sector: Services & Goods | |
| SubSector: Staffing & Outsourcing Services | |
| MarketCap: 563.228 Millions | |
| Recent Price: 10.55 Smart Investing & Trading Score: 45 | |
| Day Percent Change: -4.00% Day Change: -0.44 | |
| Week Change: -2.59% Year-to-date Change: -31.2% | |
| TBI Links: Profile News Message Board | |
| Charts:- Daily , Weekly | |
| Add TBI to Watchlist: View: Get Complete TBI Trend Analysis ➞ | |
 | INSE Inspired Entertainment, Inc. |
| Sector: Services & Goods | |
| SubSector: Gaming Activities | |
| MarketCap: 80.9289 Millions | |
| Recent Price: 8.66 Smart Investing & Trading Score: 20 | |
| Day Percent Change: -2.37% Day Change: -0.21 | |
| Week Change: -2.59% Year-to-date Change: -12.4% | |
| INSE Links: Profile News Message Board | |
| Charts:- Daily , Weekly | |
| Add INSE to Watchlist: View: Get Complete INSE Trend Analysis ➞ | |
 | OBIO Orchestra BioMed Holdings, Inc. |
| Sector: Health Care | |
| SubSector: Biotechnology | |
| MarketCap: 271 Millions | |
| Recent Price: 4.52 Smart Investing & Trading Score: 17 | |
| Day Percent Change: 0.67% Day Change: 0.03 | |
| Week Change: -2.59% Year-to-date Change: -50.4% | |
| OBIO Links: Profile News Message Board | |
| Charts:- Daily , Weekly | |
| Add OBIO to Watchlist: View: Get Complete OBIO Trend Analysis ➞ | |
 | CRMT America s Car-Mart, Inc. |
| Sector: Services & Goods | |
| SubSector: Auto Dealerships | |
| MarketCap: 329.921 Millions | |
| Recent Price: 56.72 Smart Investing & Trading Score: 35 | |
| Day Percent Change: -2.89% Day Change: -1.69 | |
| Week Change: -2.61% Year-to-date Change: -25.1% | |
| CRMT Links: Profile News Message Board | |
| Charts:- Daily , Weekly | |
| Add CRMT to Watchlist: View: Get Complete CRMT Trend Analysis ➞ | |
 | FLYW Flywire Corporation |
| Sector: Technology | |
| SubSector: Software - Infrastructure | |
| MarketCap: 3390 Millions | |
| Recent Price: 20.55 Smart Investing & Trading Score: 7 | |
| Day Percent Change: -4.11% Day Change: -0.88 | |
| Week Change: -2.61% Year-to-date Change: -12.3% | |
| FLYW Links: Profile News Message Board | |
| Charts:- Daily , Weekly | |
| Add FLYW to Watchlist: View: Get Complete FLYW Trend Analysis ➞ | |
 | ARDX Ardelyx, Inc. |
| Sector: Health Care | |
| SubSector: Biotechnology | |
| MarketCap: 541.985 Millions | |
| Recent Price: 6.31 Smart Investing & Trading Score: 18 | |
| Day Percent Change: -1.87% Day Change: -0.12 | |
| Week Change: -2.62% Year-to-date Change: 1.8% | |
| ARDX Links: Profile News Message Board | |
| Charts:- Daily , Weekly | |
| Add ARDX to Watchlist: View: Get Complete ARDX Trend Analysis ➞ | |
 | VOR Vor Biopharma Inc. |
| Sector: Health Care | |
| SubSector: Biotechnology | |
| MarketCap: 224 Millions | |
| Recent Price: 1.67 Smart Investing & Trading Score: 30 | |
| Day Percent Change: -4.58% Day Change: -0.08 | |
| Week Change: -2.63% Year-to-date Change: -25.0% | |
| VOR Links: Profile News Message Board | |
| Charts:- Daily , Weekly | |
| Add VOR to Watchlist: View: Get Complete VOR Trend Analysis ➞ | |
 | HLLY Holley Inc. |
| Sector: Services & Goods | |
| SubSector: Auto Parts | |
| MarketCap: 469 Millions | |
| Recent Price: 4.07 Smart Investing & Trading Score: 0 | |
| Day Percent Change: -0.49% Day Change: -0.02 | |
| Week Change: -2.63% Year-to-date Change: -18.0% | |
| HLLY Links: Profile News Message Board | |
| Charts:- Daily , Weekly | |
| Add HLLY to Watchlist: View: Get Complete HLLY Trend Analysis ➞ | |
 | GLRE Greenlight Capital Re, Ltd. |
| Sector: Financials | |
| SubSector: Accident & Health Insurance | |
| MarketCap: 228.66 Millions | |
| Recent Price: 12.15 Smart Investing & Trading Score: 31 | |
| Day Percent Change: -1.30% Day Change: -0.16 | |
| Week Change: -2.64% Year-to-date Change: 6.4% | |
| GLRE Links: Profile News Message Board | |
| Charts:- Daily , Weekly | |
| Add GLRE to Watchlist: View: Get Complete GLRE Trend Analysis ➞ | |
 | WVE Wave Life Sciences Ltd. |
| Sector: Health Care | |
| SubSector: Biotechnology | |
| MarketCap: 452.785 Millions | |
| Recent Price: 4.74 Smart Investing & Trading Score: 51 | |
| Day Percent Change: -5.39% Day Change: -0.27 | |
| Week Change: -2.67% Year-to-date Change: -6.1% | |
| WVE Links: Profile News Message Board | |
| Charts:- Daily , Weekly | |
| Add WVE to Watchlist: View: Get Complete WVE Trend Analysis ➞ | |
 | MC Moelis & Company |
| Sector: Financials | |
| SubSector: Asset Management | |
| MarketCap: 1675.93 Millions | |
| Recent Price: 50.26 Smart Investing & Trading Score: 35 | |
| Day Percent Change: -6.91% Day Change: -3.73 | |
| Week Change: -2.69% Year-to-date Change: -10.5% | |
| MC Links: Profile News Message Board | |
| Charts:- Daily , Weekly | |
| Add MC to Watchlist: View: Get Complete MC Trend Analysis ➞ | |
 | OMI Owens & Minor, Inc. |
| Sector: Services & Goods | |
| SubSector: Medical Equipment Wholesale | |
| MarketCap: 403.92 Millions | |
| Recent Price: 24.12 Smart Investing & Trading Score: 54 | |
| Day Percent Change: -2.51% Day Change: -0.62 | |
| Week Change: -2.7% Year-to-date Change: 25.2% | |
| OMI Links: Profile News Message Board | |
| Charts:- Daily , Weekly | |
| Add OMI to Watchlist: View: Get Complete OMI Trend Analysis ➞ | |
 | HEAR Turtle Beach Corporation |
| Sector: Technology | |
| SubSector: Communication Equipment | |
| MarketCap: 73.0539 Millions | |
| Recent Price: 14.05 Smart Investing & Trading Score: 41 | |
| Day Percent Change: -0.92% Day Change: -0.13 | |
| Week Change: -2.7% Year-to-date Change: 28.3% | |
| HEAR Links: Profile News Message Board | |
| Charts:- Daily , Weekly | |
| Add HEAR to Watchlist: View: Get Complete HEAR Trend Analysis ➞ | |
 | MCFT MasterCraft Boat Holdings, Inc. |
| Sector: Consumer Staples | |
| SubSector: Recreational Vehicles | |
| MarketCap: 152.059 Millions | |
| Recent Price: 20.53 Smart Investing & Trading Score: 54 | |
| Day Percent Change: -3.66% Day Change: -0.78 | |
| Week Change: -2.7% Year-to-date Change: -9.3% | |
| MCFT Links: Profile News Message Board | |
| Charts:- Daily , Weekly | |
| Add MCFT to Watchlist: View: Get Complete MCFT Trend Analysis ➞ | |
 | HLIO Helios Technologies, Inc. |
| Sector: Industrials | |
| SubSector: Diversified Machinery | |
| MarketCap: 1455.66 Millions | |
| Recent Price: 44.70 Smart Investing & Trading Score: 66 | |
| Day Percent Change: -2.32% Day Change: -1.06 | |
| Week Change: -2.7% Year-to-date Change: -1.4% | |
| HLIO Links: Profile News Message Board | |
| Charts:- Daily , Weekly | |
| Add HLIO to Watchlist: View: Get Complete HLIO Trend Analysis ➞ | |
 | TITN Titan Machinery Inc. |
| Sector: Services & Goods | |
| SubSector: Industrial Equipment Wholesale | |
| MarketCap: 208.958 Millions | |
| Recent Price: 22.61 Smart Investing & Trading Score: 10 | |
| Day Percent Change: -0.22% Day Change: -0.05 | |
| Week Change: -2.71% Year-to-date Change: -21.7% | |
| TITN Links: Profile News Message Board | |
| Charts:- Daily , Weekly | |
| Add TITN to Watchlist: View: Get Complete TITN Trend Analysis ➞ | |
 | CMC Commercial Metals Company |
| Sector: Materials | |
| SubSector: Steel & Iron | |
| MarketCap: 1724.78 Millions | |
| Recent Price: 53.71 Smart Investing & Trading Score: 36 | |
| Day Percent Change: 0.02% Day Change: 0.01 | |
| Week Change: -2.72% Year-to-date Change: 7.3% | |
| CMC Links: Profile News Message Board | |
| Charts:- Daily , Weekly | |
| Add CMC to Watchlist: View: Get Complete CMC Trend Analysis ➞ | |
| Too many stocks? View smallcap stocks filtered by marketcap & sector |
| Marketcap: All SmallCap Stocks (default-no microcap), Large, Mid-Range, Small & MicroCap |
| Sector: Tech, Finance, Energy, Staples, Retail, Industrial, Materials, Utilities & Medical |
|
Best Stocks Today 12Stocks.com |
© 2024 12Stocks.com Terms & Conditions Privacy Contact Us
All Information Provided Only For Education And Not To Be Used For Investing or Trading. See Terms & Conditions


One More Thing ... Get Best Stocks Delivered Daily!
Never Ever Miss A Move With Our Top Ten Stocks Lists
Find Best Stocks In Any Market - Bull or Bear Market
Take A Peek At Our Top Ten Stocks Lists: Daily, Weekly, Year-to-Date & Top Trends
Find Best Stocks In Any Market - Bull or Bear Market
Take A Peek At Our Top Ten Stocks Lists: Daily, Weekly, Year-to-Date & Top Trends
Smallcap Stocks With Best Up Trends [0-bearish to 100-bullish]: B. Riley[100], Central Pacific[100], California Water[100], Cricut [100], Carpenter [100], Haemonetics [100], Sanmina [100], Trustmark [100], Comstock Resources[100], EchoStar [100], Mueller Industries[100]
Best Smallcap Stocks Year-to-Date:
CareMax [490.72%], Janux [338.34%], Viking [270.02%], Alpine Immune[239.52%], Longboard [218%], Super Micro[177%], Arcutis Bio[166.56%], Avidity Biosciences[159.79%], Vera [149.94%], Hippo [128.87%], Stoke [122.15%] Best Smallcap Stocks This Week:
Matterport [168.97%], B. Riley[73.54%], Impinj [33.73%], ProKidney [32.84%], Seres [32.65%], Riot Blockchain[32.64%], Ribbon [25.58%], Cullinan Oncology[22.92%], P.A.M. Transportation[22.85%], NuScale Power[21.44%], Hibbett Sports[21.03%] Best Smallcap Stocks Daily:
Impinj [28.65%], P.A.M. Transportation[17.95%], B. Riley[16.61%], Strategic Education[16.28%], OptiNose [14.56%], JELD-WEN Holding[11.54%], Sonic Automotive[10.86%], Intevac [10.54%], SiTime [8.84%], Noodles & [8.08%], ProKidney [7.75%]