
 Login Sign Up


| |||||
 |  | ||||

| 12Stocks.com Market Intelligence |
Best SmallCap Stocks
|
| In a hurry? Small Cap Stock Lists: Performance Trends Table, Stock Charts
Sort Small Cap stocks: Daily, Weekly, Year-to-Date, Market Cap & Trends. Filter Small Cap stocks list by sector: Show all, Tech, Finance, Energy, Staples, Retail, Industrial, Materials, Utilities and HealthCare Filter Small Cap stocks list by size: All Large Medium Small and MicroCap |
| 12Stocks.com Small Cap Stocks Performances & Trends Daily | |||||||||
|
|  The overall Smart Investing & Trading Score is 70 (0-bearish to 100-bullish) which puts Small Cap index in short term neutral to bullish trend. The Smart Investing & Trading Score from previous trading session is 87 and hence a deterioration of trend.
| ||||||||
Here are the Smart Investing & Trading Scores of the most requested small cap stocks at 12Stocks.com (click stock name for detailed review):
|


| 12Stocks.com: Investing in Smallcap Index with Stocks | |
|
The following table helps investors and traders sort through current performance and trends (as measured by Smart Investing & Trading Score) of various
stocks in the Smallcap Index. Quick View: Move mouse or cursor over stock symbol (ticker) to view short-term technical chart and over stock name to view long term chart. Click on  to add stock symbol to your watchlist and to add stock symbol to your watchlist and  to view watchlist. Click on any ticker or stock name for detailed market intelligence report for that stock. to view watchlist. Click on any ticker or stock name for detailed market intelligence report for that stock. |
12Stocks.com Performance of Stocks in Smallcap Index
| Ticker | Stock Name | Watchlist | Category | Recent Price | Smart Investing & Trading Score | Change % | YTD Change% |
| UVE | Universal Insurance |   | Financials | 20.34 | 82 | 0.79 | 27.28% |
| KW | Kennedy-Wilson | | Financials | 8.95 | 88 | 0.79 | -27.71% |
| TCBK | TriCo Bancshares | | Financials | 37.57 | 81 | 0.78 | -12.57% |
| PGC | Peapack-Gladstone Financial | | Financials | 23.27 | 45 | 0.78 | -21.97% |
| NTGR | NETGEAR | | Technology | 11.58 | 18 | 0.78 | -20.58% |
| SXC | SunCoke Energy | | Materials | 10.31 | 10 | 0.78 | -4.00% |
| BOOT | Boot Barn | | Services & Goods | 103.60 | 51 | 0.78 | 34.97% |
| IBEX | IBEX | | Technology | 14.23 | 74 | 0.78 | -25.03% |
| SANM | Sanmina | | Technology | 64.64 | 100 | 0.76 | 25.83% |
| ASGN | ASGN | | Services & Goods | 99.56 | 68 | 0.76 | 3.53% |
| TRS | TriMas | | Industrials | 26.45 | 95 | 0.76 | 4.42% |
| FIBK | First Interstate | | Financials | 27.86 | 76 | 0.76 | -9.40% |
| BSIG | BrightSphere | | Financials | 22.54 | 41 | 0.76 | 17.64% |
| TNGX | Tango | | Health Care | 7.91 | 52 | 0.76 | -20.10% |
| ONB | Old National | | Financials | 17.39 | 88 | 0.75 | 2.96% |
| UNF | UniFirst | | Consumer Staples | 164.27 | 57 | 0.75 | -10.19% |
| FIX | Comfort Systems | | Industrials | 346.21 | 100 | 0.75 | 68.33% |
| CMP | Compass Minerals | | Materials | 13.46 | 52 | 0.75 | -46.84% |
| ITRI | Itron | | Technology | 109.06 | 100 | 0.75 | 44.43% |
| LCNB | LCNB | | Financials | 14.71 | 68 | 0.75 | -6.72% |
| RAPT | RAPT | | Health Care | 8.13 | 39 | 0.74 | -67.28% |
| AKYA | Akoya Biosciences | | Health Care | 4.11 | 62 | 0.74 | -15.95% |
| CNS | Cohen & Steers | | Financials | 71.56 | 42 | 0.72 | -5.51% |
| EE | Excelerate Energy | | Utilities | 18.21 | 100 | 0.72 | 17.03% |
| BH | Biglari | | Services & Goods | 203.33 | 76 | 0.72 | 23.28% |


| Too many stocks? View smallcap stocks filtered by marketcap & sector |
| Marketcap: All SmallCap Stocks (default-no microcap), Large, Mid-Range, Small |
| Smallcap Sector: Tech, Finance, Energy, Staples, Retail, Industrial, Materials, & Medical |
|
Get the most comprehensive stock market coverage daily at 12Stocks.com ➞ Best Stocks Today ➞ Best Stocks Weekly ➞ Best Stocks Year-to-Date ➞ Best Stocks Trends ➞  Best Stocks Today 12Stocks.com Best Nasdaq Stocks ➞ Best S&P 500 Stocks ➞ Best Tech Stocks ➞ Best Biotech Stocks ➞ |
| Detailed Overview of SmallCap Stocks |
| SmallCap Technical Overview, Leaders & Laggards, Top SmallCap ETF Funds & Detailed SmallCap Stocks List, Charts, Trends & More |
| Smallcap: Technical Analysis, Trends & YTD Performance | |
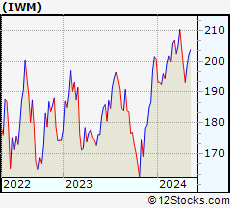
| SmallCap segment as represented by
IWM, an exchange-traded fund [ETF], holds basket of thousands of smallcap stocks from across all major sectors of the US stock market. The smallcap index (contains stocks like Riverbed & Sotheby's) is up by 1.53% and is currently underperforming the overall market by -6.51% year-to-date. Below is a quick view of technical charts and trends: | |
 IWM Weekly Chart |
|
| Long Term Trend: Very Good | |
| Medium Term Trend: Very Good | |
 IWM Daily Chart |
|
| Short Term Trend: Good | |
| Overall Trend Score: 70 | |
| YTD Performance: 1.53% | |
| **Trend Scores & Views Are Only For Educational Purposes And Not For Investing | |
| 12Stocks.com: Top Performing Small Cap Index Stocks | ||||||||||||||||||||||||||||||||||||||||||||||||
 The top performing Small Cap Index stocks year to date are
Now, more recently, over last week, the top performing Small Cap Index stocks on the move are


|
||||||||||||||||||||||||||||||||||||||||||||||||
| 12Stocks.com: Investing in Smallcap Index using Exchange Traded Funds | |
|
The following table shows list of key exchange traded funds (ETF) that
help investors track Smallcap index. The following list also includes leveraged ETF funds that track twice or thrice the daily returns of Smallcap indices. Short or inverse ETF funds move in the opposite direction to the index they track and are useful during market pullbacks or during bear markets. Quick View: Move mouse or cursor over ETF symbol (ticker) to view short-term technical chart and over ETF name to view long term chart. Click on ticker or stock name for detailed view. Click on to add stock symbol to your watchlist and to view watchlist. |
12Stocks.com List of ETFs that track Smallcap Index
| Ticker | ETF Name | Watchlist | Recent Price | Smart Investing & Trading Score | Change % | Week % | Year-to-date % |
| IWM | iShares Russell 2000 | | 203.78 | 70 | -0.58 | 0.93 | 1.53% |
| IJR | iShares Core S&P Small-Cap | | 108.26 | 88 | -0.33 | 1.05 | 0.01% |
| IWN | iShares Russell 2000 Value | | 155.37 | 88 | -0.17 | 0.75 | 0.03% |
| VTWO | Vanguard Russell 2000 ETF | | 82.40 | 57 | -0.53 | 0.97 | 1.6% |
| IWO | iShares Russell 2000 Growth | | 260.10 | 57 | -0.84 | 1.26 | 3.12% |
| IJS | iShares S&P Small-Cap 600 Value | | 99.80 | 70 | 0.12 | 1.09 | -3.17% |
| IJT | iShares S&P Small-Cap 600 Growth | | 129.03 | 83 | -0.62 | 0.99 | 3.11% |
| XSLV | PowerShares S&P SmallCap Low Volatil ETF | | 43.94 | 100 | -0.14 | 1.67 | -0.48% |
| SMLV | SPDR SSGA US Small Cap Low Volatil ETF | | 110.32 | 68 | -0.15 | 0.57 | -1.96% |
| SDD | ProShares UltraShort SmallCap600 | | 18.66 | 40 | 2.43 | -0.98 | 1.27% |
| SBB | ProShares Short SmallCap600 | | 16.08 | 38 | 0.69 | -0.5 | 0.94% |
| SAA | ProShares Ultra SmallCap600 | | 24.21 | 70 | -0.75 | 2.62 | -2.98% |
| 12Stocks.com: Charts, Trends, Fundamental Data and Performances of SmallCap Stocks | |
|
We now take in-depth look at all SmallCap stocks including charts, multi-period performances and overall trends (as measured by Smart Investing & Trading Score). One can sort SmallCap stocks (click link to choose) by Daily, Weekly and by Year-to-Date performances. Also, one can sort by size of the company or by market capitalization. |
| Select Your Default Chart Type: | |||||
| |||||
| Click on stock symbol or name for detailed view. Click on to add stock symbol to your watchlist and to view watchlist. Quick View: Move mouse or cursor over "Daily" to quickly view daily technical stock chart and over "Weekly" to view weekly technical stock chart. | |||||

 | UVE Universal Insurance Holdings, Inc. |
| Sector: Financials | |
| SubSector: Property & Casualty Insurance | |
| MarketCap: 616.212 Millions | |
| Recent Price: 20.34 Smart Investing & Trading Score: 82 | |
| Day Percent Change: 0.79% Day Change: 0.16 | |
| Week Change: 2.68% Year-to-date Change: 27.3% | |
| UVE Links: Profile News Message Board | |
| Charts:- Daily , Weekly | |
| Add UVE to Watchlist: View: Get Complete UVE Trend Analysis ➞ | |
 | KW Kennedy-Wilson Holdings, Inc. |
| Sector: Financials | |
| SubSector: Property Management | |
| MarketCap: 2025.42 Millions | |
| Recent Price: 8.95 Smart Investing & Trading Score: 88 | |
| Day Percent Change: 0.79% Day Change: 0.07 | |
| Week Change: 2.29% Year-to-date Change: -27.7% | |
| KW Links: Profile News Message Board | |
| Charts:- Daily , Weekly | |
| Add KW to Watchlist: View: Get Complete KW Trend Analysis ➞ | |
 | TCBK TriCo Bancshares |
| Sector: Financials | |
| SubSector: Regional - Pacific Banks | |
| MarketCap: 875.129 Millions | |
| Recent Price: 37.57 Smart Investing & Trading Score: 81 | |
| Day Percent Change: 0.78% Day Change: 0.29 | |
| Week Change: 0.27% Year-to-date Change: -12.6% | |
| TCBK Links: Profile News Message Board | |
| Charts:- Daily , Weekly | |
| Add TCBK to Watchlist: View: Get Complete TCBK Trend Analysis ➞ | |
 | PGC Peapack-Gladstone Financial Corporation |
| Sector: Financials | |
| SubSector: Regional - Northeast Banks | |
| MarketCap: 284.399 Millions | |
| Recent Price: 23.27 Smart Investing & Trading Score: 45 | |
| Day Percent Change: 0.78% Day Change: 0.18 | |
| Week Change: -0.17% Year-to-date Change: -22.0% | |
| PGC Links: Profile News Message Board | |
| Charts:- Daily , Weekly | |
| Add PGC to Watchlist: View: Get Complete PGC Trend Analysis ➞ | |
 | NTGR NETGEAR, Inc. |
| Sector: Technology | |
| SubSector: Communication Equipment | |
| MarketCap: 558.839 Millions | |
| Recent Price: 11.58 Smart Investing & Trading Score: 18 | |
| Day Percent Change: 0.78% Day Change: 0.09 | |
| Week Change: -0.43% Year-to-date Change: -20.6% | |
| NTGR Links: Profile News Message Board | |
| Charts:- Daily , Weekly | |
| Add NTGR to Watchlist: View: Get Complete NTGR Trend Analysis ➞ | |
 | SXC SunCoke Energy, Inc. |
| Sector: Materials | |
| SubSector: Nonmetallic Mineral Mining | |
| MarketCap: 306.5 Millions | |
| Recent Price: 10.31 Smart Investing & Trading Score: 10 | |
| Day Percent Change: 0.78% Day Change: 0.08 | |
| Week Change: 0% Year-to-date Change: -4.0% | |
| SXC Links: Profile News Message Board | |
| Charts:- Daily , Weekly | |
| Add SXC to Watchlist: View: Get Complete SXC Trend Analysis ➞ | |
 | BOOT Boot Barn Holdings, Inc. |
| Sector: Services & Goods | |
| SubSector: Apparel Stores | |
| MarketCap: 360.608 Millions | |
| Recent Price: 103.60 Smart Investing & Trading Score: 51 | |
| Day Percent Change: 0.78% Day Change: 0.80 | |
| Week Change: -1.61% Year-to-date Change: 35.0% | |
| BOOT Links: Profile News Message Board | |
| Charts:- Daily , Weekly | |
| Add BOOT to Watchlist: View: Get Complete BOOT Trend Analysis ➞ | |
 | IBEX IBEX Limited |
| Sector: Technology | |
| SubSector: Software Application | |
| MarketCap: 37787 Millions | |
| Recent Price: 14.23 Smart Investing & Trading Score: 74 | |
| Day Percent Change: 0.78% Day Change: 0.11 | |
| Week Change: 4.71% Year-to-date Change: -25.0% | |
| IBEX Links: Profile News Message Board | |
| Charts:- Daily , Weekly | |
| Add IBEX to Watchlist: View: Get Complete IBEX Trend Analysis ➞ | |
 | SANM Sanmina Corporation |
| Sector: Technology | |
| SubSector: Diversified Electronics | |
| MarketCap: 1790.36 Millions | |
| Recent Price: 64.64 Smart Investing & Trading Score: 100 | |
| Day Percent Change: 0.76% Day Change: 0.49 | |
| Week Change: 4.66% Year-to-date Change: 25.8% | |
| SANM Links: Profile News Message Board | |
| Charts:- Daily , Weekly | |
| Add SANM to Watchlist: View: Get Complete SANM Trend Analysis ➞ | |
 | ASGN ASGN Incorporated |
| Sector: Services & Goods | |
| SubSector: Staffing & Outsourcing Services | |
| MarketCap: 2035.88 Millions | |
| Recent Price: 99.56 Smart Investing & Trading Score: 68 | |
| Day Percent Change: 0.76% Day Change: 0.75 | |
| Week Change: 3.55% Year-to-date Change: 3.5% | |
| ASGN Links: Profile News Message Board | |
| Charts:- Daily , Weekly | |
| Add ASGN to Watchlist: View: Get Complete ASGN Trend Analysis ➞ | |
 | TRS TriMas Corporation |
| Sector: Industrials | |
| SubSector: Industrial Equipment & Components | |
| MarketCap: 963.509 Millions | |
| Recent Price: 26.45 Smart Investing & Trading Score: 95 | |
| Day Percent Change: 0.76% Day Change: 0.20 | |
| Week Change: 0.92% Year-to-date Change: 4.4% | |
| TRS Links: Profile News Message Board | |
| Charts:- Daily , Weekly | |
| Add TRS to Watchlist: View: Get Complete TRS Trend Analysis ➞ | |
 | FIBK First Interstate BancSystem, Inc. |
| Sector: Financials | |
| SubSector: Regional - Pacific Banks | |
| MarketCap: 1797.69 Millions | |
| Recent Price: 27.86 Smart Investing & Trading Score: 76 | |
| Day Percent Change: 0.76% Day Change: 0.21 | |
| Week Change: 0.8% Year-to-date Change: -9.4% | |
| FIBK Links: Profile News Message Board | |
| Charts:- Daily , Weekly | |
| Add FIBK to Watchlist: View: Get Complete FIBK Trend Analysis ➞ | |
 | BSIG BrightSphere Investment Group Inc. |
| Sector: Financials | |
| SubSector: Asset Management | |
| MarketCap: 430.103 Millions | |
| Recent Price: 22.54 Smart Investing & Trading Score: 41 | |
| Day Percent Change: 0.76% Day Change: 0.17 | |
| Week Change: -0.09% Year-to-date Change: 17.6% | |
| BSIG Links: Profile News Message Board | |
| Charts:- Daily , Weekly | |
| Add BSIG to Watchlist: View: Get Complete BSIG Trend Analysis ➞ | |
 | TNGX Tango Therapeutics, Inc. |
| Sector: Health Care | |
| SubSector: Biotechnology | |
| MarketCap: 302 Millions | |
| Recent Price: 7.91 Smart Investing & Trading Score: 52 | |
| Day Percent Change: 0.76% Day Change: 0.06 | |
| Week Change: 4.42% Year-to-date Change: -20.1% | |
| TNGX Links: Profile News Message Board | |
| Charts:- Daily , Weekly | |
| Add TNGX to Watchlist: View: Get Complete TNGX Trend Analysis ➞ | |
 | ONB Old National Bancorp |
| Sector: Financials | |
| SubSector: Regional - Midwest Banks | |
| MarketCap: 2340.8 Millions | |
| Recent Price: 17.39 Smart Investing & Trading Score: 88 | |
| Day Percent Change: 0.75% Day Change: 0.13 | |
| Week Change: 1.16% Year-to-date Change: 3.0% | |
| ONB Links: Profile News Message Board | |
| Charts:- Daily , Weekly | |
| Add ONB to Watchlist: View: Get Complete ONB Trend Analysis ➞ | |
 | UNF UniFirst Corporation |
| Sector: Consumer Staples | |
| SubSector: Textile - Apparel Clothing | |
| MarketCap: 2605.65 Millions | |
| Recent Price: 164.27 Smart Investing & Trading Score: 57 | |
| Day Percent Change: 0.75% Day Change: 1.23 | |
| Week Change: 2.93% Year-to-date Change: -10.2% | |
| UNF Links: Profile News Message Board | |
| Charts:- Daily , Weekly | |
| Add UNF to Watchlist: View: Get Complete UNF Trend Analysis ➞ | |
 | FIX Comfort Systems USA, Inc. |
| Sector: Industrials | |
| SubSector: General Contractors | |
| MarketCap: 1440.63 Millions | |
| Recent Price: 346.21 Smart Investing & Trading Score: 100 | |
| Day Percent Change: 0.75% Day Change: 2.58 | |
| Week Change: 9.9% Year-to-date Change: 68.3% | |
| FIX Links: Profile News Message Board | |
| Charts:- Daily , Weekly | |
| Add FIX to Watchlist: View: Get Complete FIX Trend Analysis ➞ | |
 | CMP Compass Minerals International, Inc. |
| Sector: Materials | |
| SubSector: Industrial Metals & Minerals | |
| MarketCap: 1512.1 Millions | |
| Recent Price: 13.46 Smart Investing & Trading Score: 52 | |
| Day Percent Change: 0.75% Day Change: 0.10 | |
| Week Change: 5.57% Year-to-date Change: -46.8% | |
| CMP Links: Profile News Message Board | |
| Charts:- Daily , Weekly | |
| Add CMP to Watchlist: View: Get Complete CMP Trend Analysis ➞ | |
 | ITRI Itron, Inc. |
| Sector: Technology | |
| SubSector: Scientific & Technical Instruments | |
| MarketCap: 2222.23 Millions | |
| Recent Price: 109.06 Smart Investing & Trading Score: 100 | |
| Day Percent Change: 0.75% Day Change: 0.81 | |
| Week Change: 1.92% Year-to-date Change: 44.4% | |
| ITRI Links: Profile News Message Board | |
| Charts:- Daily , Weekly | |
| Add ITRI to Watchlist: View: Get Complete ITRI Trend Analysis ➞ | |
 | LCNB LCNB Corp. |
| Sector: Financials | |
| SubSector: Regional - Mid-Atlantic Banks | |
| MarketCap: 176.759 Millions | |
| Recent Price: 14.71 Smart Investing & Trading Score: 68 | |
| Day Percent Change: 0.75% Day Change: 0.11 | |
| Week Change: 0.55% Year-to-date Change: -6.7% | |
| LCNB Links: Profile News Message Board | |
| Charts:- Daily , Weekly | |
| Add LCNB to Watchlist: View: Get Complete LCNB Trend Analysis ➞ | |
 | RAPT RAPT Therapeutics, Inc. |
| Sector: Health Care | |
| SubSector: Biotechnology | |
| MarketCap: 368.785 Millions | |
| Recent Price: 8.13 Smart Investing & Trading Score: 39 | |
| Day Percent Change: 0.74% Day Change: 0.06 | |
| Week Change: -2.4% Year-to-date Change: -67.3% | |
| RAPT Links: Profile News Message Board | |
| Charts:- Daily , Weekly | |
| Add RAPT to Watchlist: View: Get Complete RAPT Trend Analysis ➞ | |
 | AKYA Akoya Biosciences, Inc. |
| Sector: Health Care | |
| SubSector: Medical Instruments & Supplies | |
| MarketCap: 340 Millions | |
| Recent Price: 4.11 Smart Investing & Trading Score: 62 | |
| Day Percent Change: 0.74% Day Change: 0.03 | |
| Week Change: 1.86% Year-to-date Change: -16.0% | |
| AKYA Links: Profile News Message Board | |
| Charts:- Daily , Weekly | |
| Add AKYA to Watchlist: View: Get Complete AKYA Trend Analysis ➞ | |
 | CNS Cohen & Steers, Inc. |
| Sector: Financials | |
| SubSector: Asset Management | |
| MarketCap: 2082.43 Millions | |
| Recent Price: 71.56 Smart Investing & Trading Score: 42 | |
| Day Percent Change: 0.72% Day Change: 0.51 | |
| Week Change: 1.4% Year-to-date Change: -5.5% | |
| CNS Links: Profile News Message Board | |
| Charts:- Daily , Weekly | |
| Add CNS to Watchlist: View: Get Complete CNS Trend Analysis ➞ | |
 | EE Excelerate Energy, Inc. |
| Sector: Utilities | |
| SubSector: Utilities - Renewable | |
| MarketCap: 2140 Millions | |
| Recent Price: 18.21 Smart Investing & Trading Score: 100 | |
| Day Percent Change: 0.72% Day Change: 0.13 | |
| Week Change: 4.36% Year-to-date Change: 17.0% | |
| EE Links: Profile News Message Board | |
| Charts:- Daily , Weekly | |
| Add EE to Watchlist: View: Get Complete EE Trend Analysis ➞ | |
 | BH Biglari Holdings Inc. |
| Sector: Services & Goods | |
| SubSector: Restaurants | |
| MarketCap: 149.07 Millions | |
| Recent Price: 203.33 Smart Investing & Trading Score: 76 | |
| Day Percent Change: 0.72% Day Change: 1.46 | |
| Week Change: -0.3% Year-to-date Change: 23.3% | |
| BH Links: Profile News Message Board | |
| Charts:- Daily , Weekly | |
| Add BH to Watchlist: View: Get Complete BH Trend Analysis ➞ | |
| Too many stocks? View smallcap stocks filtered by marketcap & sector |
| Marketcap: All SmallCap Stocks (default-no microcap), Large, Mid-Range, Small & MicroCap |
| Sector: Tech, Finance, Energy, Staples, Retail, Industrial, Materials, Utilities & Medical |
|
Best Stocks Today 12Stocks.com |
© 2024 12Stocks.com Terms & Conditions Privacy Contact Us
All Information Provided Only For Education And Not To Be Used For Investing or Trading. See Terms & Conditions


One More Thing ... Get Best Stocks Delivered Daily!
Never Ever Miss A Move With Our Top Ten Stocks Lists
Find Best Stocks In Any Market - Bull or Bear Market
Take A Peek At Our Top Ten Stocks Lists: Daily, Weekly, Year-to-Date & Top Trends
Find Best Stocks In Any Market - Bull or Bear Market
Take A Peek At Our Top Ten Stocks Lists: Daily, Weekly, Year-to-Date & Top Trends
Smallcap Stocks With Best Up Trends [0-bearish to 100-bullish]: Innodata [100], Cricut [100], DASAN Zhone[100], Latham Group[100], Hyster-Yale Materials[100], Ameresco [100], Myriad Genetics[100], Alpha and[100], Vigil Neuroscience[100], Hannon Armstrong[100], Ardmore Shipping[100]
Best Smallcap Stocks Year-to-Date:
CareMax [584.54%], Janux [415.31%], Viking [329.39%], Bakkt [294.17%], Longboard [255.16%], Alpine Immune[239.81%], Vera [190.31%], Super Micro[189.4%], Avidity Biosciences[188.27%], Cullinan Oncology[171.9%], Arcutis Bio[147.06%] Best Smallcap Stocks This Week:
DASAN Zhone[64.32%], Innodata [55.8%], Perficient [52.88%], Cricut [42.06%], Vigil Neuroscience[38.97%], Thoughtworks Holding[36.44%], Latham Group[35.53%], Great Lakes[32.04%], Outset Medical[31.95%], Bakkt [31.59%], P3 Health[27.95%] Best Smallcap Stocks Daily:
Innodata [55.34%], Cricut [47.20%], DASAN Zhone[30.11%], Latham Group[23.75%], Hyster-Yale Materials[23.55%], Ameresco [21.13%], Myriad Genetics[21.08%], iRobot [21.06%], Alpha and[20.87%], Bakkt [20.58%], Vigil Neuroscience[18.50%]