
 Login Sign Up


| |||||
 |  | ||||

| 12Stocks.com Market Intelligence |
Best SmallCap Stocks
|
| In a hurry? Small Cap Stock Lists: Performance Trends Table, Stock Charts
Sort Small Cap stocks: Daily, Weekly, Year-to-Date, Market Cap & Trends. Filter Small Cap stocks list by sector: Show all, Tech, Finance, Energy, Staples, Retail, Industrial, Materials, Utilities and HealthCare Filter Small Cap stocks list by size: All Large Medium Small and MicroCap |
| 12Stocks.com Small Cap Stocks Performances & Trends Daily | |||||||||
|
|  The overall Smart Investing & Trading Score is 87 (0-bearish to 100-bullish) which puts Small Cap index in short term bullish trend. The Smart Investing & Trading Score from previous trading session is 82 and hence an improvement of trend.
| ||||||||
Here are the Smart Investing & Trading Scores of the most requested small cap stocks at 12Stocks.com (click stock name for detailed review):
|


| 12Stocks.com: Investing in Smallcap Index with Stocks | |
|
The following table helps investors and traders sort through current performance and trends (as measured by Smart Investing & Trading Score) of various
stocks in the Smallcap Index. Quick View: Move mouse or cursor over stock symbol (ticker) to view short-term technical chart and over stock name to view long term chart. Click on  to add stock symbol to your watchlist and to add stock symbol to your watchlist and  to view watchlist. Click on any ticker or stock name for detailed market intelligence report for that stock. to view watchlist. Click on any ticker or stock name for detailed market intelligence report for that stock. |
12Stocks.com Performance of Stocks in Smallcap Index
| Ticker | Stock Name | Watchlist | Category | Recent Price | Smart Investing & Trading Score | Change % | YTD Change% |
| UUUU | Energy Fuels |   | Materials | 5.88 | 74 | 2.08 | -18.22% |
| TARS | Tarsus | | Health Care | 38.03 | 87 | 2.08 | 87.52% |
| LAUR | Laureate Education | | Services & Goods | 15.81 | 100 | 2.07 | 15.32% |
| FCFS | FirstCash | | Financials | 119.02 | 65 | 2.07 | 9.81% |
| GDYN | Grid Dynamics | | Technology | 10.85 | 64 | 2.07 | -18.60% |
| HCC | Warrior Met | | Materials | 66.08 | 41 | 2.04 | 8.38% |
| KOS | Kosmos Energy | | Energy | 5.99 | 59 | 2.04 | -10.73% |
| ALKS | Alkermes | | Health Care | 24.59 | 57 | 2.03 | -11.36% |
| MLR | Miller Industries | | Consumer Staples | 55.32 | 100 | 2.03 | 30.81% |
| RVLV | Revolve Group | | Services & Goods | 21.15 | 74 | 2.03 | 27.56% |
| IGT | Game | | Services & Goods | 20.22 | 50 | 2.02 | -26.23% |
| PUBM | PubMatic | | Technology | 24.02 | 90 | 2.02 | 47.36% |
| VAXX | Vaxxinity | | Health Care | 0.13 | 32 | 2.02 | -84.39% |
| FSS | Federal Signal | | Industrials | 85.89 | 95 | 2.01 | 11.92% |
| AGX | Argan | | Industrials | 65.01 | 100 | 2.01 | 38.94% |
| FPI | Farmland Partners | | Financials | 11.18 | 55 | 2.01 | -10.42% |
| KVHI | KVH Industries | | Technology | 5.10 | 95 | 2.00 | -3.04% |
| CATO | Cato | | Services & Goods | 5.10 | 74 | 2.00 | -28.57% |
| FNKO | Funko | | Consumer Staples | 6.69 | 74 | 1.98 | -13.45% |
| PAYS | PaySign | | Services & Goods | 4.67 | 80 | 1.97 | 66.79% |
| CCO | Clear Channel | | Services & Goods | 1.56 | 49 | 1.96 | -14.29% |
| SPSC | SPS Commerce | | Technology | 192.68 | 100 | 1.96 | -0.60% |
| PAHC | Phibro Animal | | Health Care | 16.77 | 68 | 1.95 | 44.82% |
| SEM | Select Medical | | Health Care | 32.73 | 100 | 1.93 | 39.28% |
| LTH | Life Time | | Services & Goods | 15.09 | 100 | 1.93 | -0.40% |


| Too many stocks? View smallcap stocks filtered by marketcap & sector |
| Marketcap: All SmallCap Stocks (default-no microcap), Large, Mid-Range, Small |
| Smallcap Sector: Tech, Finance, Energy, Staples, Retail, Industrial, Materials, & Medical |
|
Get the most comprehensive stock market coverage daily at 12Stocks.com ➞ Best Stocks Today ➞ Best Stocks Weekly ➞ Best Stocks Year-to-Date ➞ Best Stocks Trends ➞  Best Stocks Today 12Stocks.com Best Nasdaq Stocks ➞ Best S&P 500 Stocks ➞ Best Tech Stocks ➞ Best Biotech Stocks ➞ |
| Detailed Overview of SmallCap Stocks |
| SmallCap Technical Overview, Leaders & Laggards, Top SmallCap ETF Funds & Detailed SmallCap Stocks List, Charts, Trends & More |
| Smallcap: Technical Analysis, Trends & YTD Performance | |
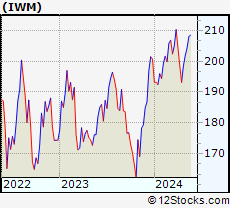
| SmallCap segment as represented by
IWM, an exchange-traded fund [ETF], holds basket of thousands of smallcap stocks from across all major sectors of the US stock market. The smallcap index (contains stocks like Riverbed & Sotheby's) is up by 2.12% and is currently underperforming the overall market by -6% year-to-date. Below is a quick view of technical charts and trends: | |
 IWM Weekly Chart |
|
| Long Term Trend: Very Good | |
| Medium Term Trend: Very Good | |
 IWM Daily Chart |
|
| Short Term Trend: Very Good | |
| Overall Trend Score: 87 | |
| YTD Performance: 2.12% | |
| **Trend Scores & Views Are Only For Educational Purposes And Not For Investing | |
| 12Stocks.com: Top Performing Small Cap Index Stocks | ||||||||||||||||||||||||||||||||||||||||||||||||
 The top performing Small Cap Index stocks year to date are
Now, more recently, over last week, the top performing Small Cap Index stocks on the move are


|
||||||||||||||||||||||||||||||||||||||||||||||||
| 12Stocks.com: Investing in Smallcap Index using Exchange Traded Funds | |
|
The following table shows list of key exchange traded funds (ETF) that
help investors track Smallcap index. The following list also includes leveraged ETF funds that track twice or thrice the daily returns of Smallcap indices. Short or inverse ETF funds move in the opposite direction to the index they track and are useful during market pullbacks or during bear markets. Quick View: Move mouse or cursor over ETF symbol (ticker) to view short-term technical chart and over ETF name to view long term chart. Click on ticker or stock name for detailed view. Click on to add stock symbol to your watchlist and to view watchlist. |
12Stocks.com List of ETFs that track Smallcap Index
| Ticker | ETF Name | Watchlist | Recent Price | Smart Investing & Trading Score | Change % | Week % | Year-to-date % |
| IWM | iShares Russell 2000 | | 204.97 | 87 | 0.22 | 1.52 | 2.12% |
| IJR | iShares Core S&P Small-Cap | | 108.62 | 100 | 0.33 | 1.39 | 0.34% |
| VTWO | Vanguard Russell 2000 ETF | | 82.84 | 82 | 0.22 | 1.51 | 2.15% |
| IWN | iShares Russell 2000 Value | | 155.63 | 100 | -0.01 | 0.92 | 0.19% |
| IWO | iShares Russell 2000 Growth | | 262.30 | 82 | 0.49 | 2.11 | 4% |
| IJS | iShares S&P Small-Cap 600 Value | | 99.68 | 69 | -0.07 | 0.97 | -3.29% |
| IJT | iShares S&P Small-Cap 600 Growth | | 129.84 | 95 | 0.56 | 1.63 | 3.76% |
| XSLV | PowerShares S&P SmallCap Low Volatil ETF | | 44.00 | 100 | 0.96 | 1.8 | -0.34% |
| SAA | ProShares Ultra SmallCap600 | | 24.39 | 95 | 1.16 | 3.39 | -2.24% |
| SMLV | SPDR SSGA US Small Cap Low Volatil ETF | | 110.48 | 100 | -0.10 | 0.72 | -1.81% |
| SBB | ProShares Short SmallCap600 | | 15.97 | 0 | -0.50 | -1.18 | 0.25% |
| SDD | ProShares UltraShort SmallCap600 | | 18.22 | 10 | -1.10 | -3.33 | -1.13% |
| 12Stocks.com: Charts, Trends, Fundamental Data and Performances of SmallCap Stocks | |
|
We now take in-depth look at all SmallCap stocks including charts, multi-period performances and overall trends (as measured by Smart Investing & Trading Score). One can sort SmallCap stocks (click link to choose) by Daily, Weekly and by Year-to-Date performances. Also, one can sort by size of the company or by market capitalization. |
| Select Your Default Chart Type: | |||||
| |||||
| Click on stock symbol or name for detailed view. Click on to add stock symbol to your watchlist and to view watchlist. Quick View: Move mouse or cursor over "Daily" to quickly view daily technical stock chart and over "Weekly" to view weekly technical stock chart. | |||||

 | UUUU Energy Fuels Inc. |
| Sector: Materials | |
| SubSector: Industrial Metals & Minerals | |
| MarketCap: 107.61 Millions | |
| Recent Price: 5.88 Smart Investing & Trading Score: 74 | |
| Day Percent Change: 2.08% Day Change: 0.12 | |
| Week Change: 6.14% Year-to-date Change: -18.2% | |
| UUUU Links: Profile News Message Board | |
| Charts:- Daily , Weekly | |
| Add UUUU to Watchlist: View: Get Complete UUUU Trend Analysis ➞ | |
 | TARS Tarsus Pharmaceuticals, Inc. |
| Sector: Health Care | |
| SubSector: Biotechnology | |
| MarketCap: 74487 Millions | |
| Recent Price: 38.03 Smart Investing & Trading Score: 87 | |
| Day Percent Change: 2.08% Day Change: 0.77 | |
| Week Change: 3.09% Year-to-date Change: 87.5% | |
| TARS Links: Profile News Message Board | |
| Charts:- Daily , Weekly | |
| Add TARS to Watchlist: View: Get Complete TARS Trend Analysis ➞ | |
 | LAUR Laureate Education, Inc. |
| Sector: Services & Goods | |
| SubSector: Education & Training Services | |
| MarketCap: 2258.56 Millions | |
| Recent Price: 15.81 Smart Investing & Trading Score: 100 | |
| Day Percent Change: 2.07% Day Change: 0.32 | |
| Week Change: 5.54% Year-to-date Change: 15.3% | |
| LAUR Links: Profile News Message Board | |
| Charts:- Daily , Weekly | |
| Add LAUR to Watchlist: View: Get Complete LAUR Trend Analysis ➞ | |
 | FCFS FirstCash, Inc. |
| Sector: Financials | |
| SubSector: Credit Services | |
| MarketCap: 2795.48 Millions | |
| Recent Price: 119.02 Smart Investing & Trading Score: 65 | |
| Day Percent Change: 2.07% Day Change: 2.41 | |
| Week Change: 2.29% Year-to-date Change: 9.8% | |
| FCFS Links: Profile News Message Board | |
| Charts:- Daily , Weekly | |
| Add FCFS to Watchlist: View: Get Complete FCFS Trend Analysis ➞ | |
 | GDYN Grid Dynamics Holdings, Inc. |
| Sector: Technology | |
| SubSector: Information Technology Services | |
| MarketCap: 318.968 Millions | |
| Recent Price: 10.85 Smart Investing & Trading Score: 64 | |
| Day Percent Change: 2.07% Day Change: 0.22 | |
| Week Change: 7.75% Year-to-date Change: -18.6% | |
| GDYN Links: Profile News Message Board | |
| Charts:- Daily , Weekly | |
| Add GDYN to Watchlist: View: Get Complete GDYN Trend Analysis ➞ | |
 | HCC Warrior Met Coal, Inc. |
| Sector: Materials | |
| SubSector: Industrial Metals & Minerals | |
| MarketCap: 748.81 Millions | |
| Recent Price: 66.08 Smart Investing & Trading Score: 41 | |
| Day Percent Change: 2.04% Day Change: 1.32 | |
| Week Change: -0.23% Year-to-date Change: 8.4% | |
| HCC Links: Profile News Message Board | |
| Charts:- Daily , Weekly | |
| Add HCC to Watchlist: View: Get Complete HCC Trend Analysis ➞ | |
 | KOS Kosmos Energy Ltd. |
| Sector: Energy | |
| SubSector: Independent Oil & Gas | |
| MarketCap: 261.693 Millions | |
| Recent Price: 5.99 Smart Investing & Trading Score: 59 | |
| Day Percent Change: 2.04% Day Change: 0.12 | |
| Week Change: 3.1% Year-to-date Change: -10.7% | |
| KOS Links: Profile News Message Board | |
| Charts:- Daily , Weekly | |
| Add KOS to Watchlist: View: Get Complete KOS Trend Analysis ➞ | |
 | ALKS Alkermes plc |
| Sector: Health Care | |
| SubSector: Biotechnology | |
| MarketCap: 2311.95 Millions | |
| Recent Price: 24.59 Smart Investing & Trading Score: 57 | |
| Day Percent Change: 2.03% Day Change: 0.49 | |
| Week Change: 2.25% Year-to-date Change: -11.4% | |
| ALKS Links: Profile News Message Board | |
| Charts:- Daily , Weekly | |
| Add ALKS to Watchlist: View: Get Complete ALKS Trend Analysis ➞ | |
 | MLR Miller Industries, Inc. |
| Sector: Consumer Staples | |
| SubSector: Auto Parts | |
| MarketCap: 335.239 Millions | |
| Recent Price: 55.32 Smart Investing & Trading Score: 100 | |
| Day Percent Change: 2.03% Day Change: 1.10 | |
| Week Change: 4.44% Year-to-date Change: 30.8% | |
| MLR Links: Profile News Message Board | |
| Charts:- Daily , Weekly | |
| Add MLR to Watchlist: View: Get Complete MLR Trend Analysis ➞ | |
 | RVLV Revolve Group, Inc. |
| Sector: Services & Goods | |
| SubSector: Specialty Retail, Other | |
| MarketCap: 652.244 Millions | |
| Recent Price: 21.15 Smart Investing & Trading Score: 74 | |
| Day Percent Change: 2.03% Day Change: 0.42 | |
| Week Change: 7.52% Year-to-date Change: 27.6% | |
| RVLV Links: Profile News Message Board | |
| Charts:- Daily , Weekly | |
| Add RVLV to Watchlist: View: Get Complete RVLV Trend Analysis ➞ | |
 | IGT International Game Technology PLC |
| Sector: Services & Goods | |
| SubSector: Gaming Activities | |
| MarketCap: 1030.89 Millions | |
| Recent Price: 20.22 Smart Investing & Trading Score: 50 | |
| Day Percent Change: 2.02% Day Change: 0.40 | |
| Week Change: 0.85% Year-to-date Change: -26.2% | |
| IGT Links: Profile News Message Board | |
| Charts:- Daily , Weekly | |
| Add IGT to Watchlist: View: Get Complete IGT Trend Analysis ➞ | |
 | PUBM PubMatic, Inc. |
| Sector: Technology | |
| SubSector: Software Application | |
| MarketCap: 56787 Millions | |
| Recent Price: 24.02 Smart Investing & Trading Score: 90 | |
| Day Percent Change: 2.02% Day Change: 0.47 | |
| Week Change: 2.54% Year-to-date Change: 47.4% | |
| PUBM Links: Profile News Message Board | |
| Charts:- Daily , Weekly | |
| Add PUBM to Watchlist: View: Get Complete PUBM Trend Analysis ➞ | |
 | VAXX Vaxxinity, Inc. |
| Sector: Health Care | |
| SubSector: Biotechnology | |
| MarketCap: 320 Millions | |
| Recent Price: 0.13 Smart Investing & Trading Score: 32 | |
| Day Percent Change: 2.02% Day Change: 0.00 | |
| Week Change: 3.23% Year-to-date Change: -84.4% | |
| VAXX Links: Profile News Message Board | |
| Charts:- Daily , Weekly | |
| Add VAXX to Watchlist: View: Get Complete VAXX Trend Analysis ➞ | |
 | FSS Federal Signal Corporation |
| Sector: Industrials | |
| SubSector: Pollution & Treatment Controls | |
| MarketCap: 1694.05 Millions | |
| Recent Price: 85.89 Smart Investing & Trading Score: 95 | |
| Day Percent Change: 2.01% Day Change: 1.69 | |
| Week Change: 4.76% Year-to-date Change: 11.9% | |
| FSS Links: Profile News Message Board | |
| Charts:- Daily , Weekly | |
| Add FSS to Watchlist: View: Get Complete FSS Trend Analysis ➞ | |
 | AGX Argan, Inc. |
| Sector: Industrials | |
| SubSector: Heavy Construction | |
| MarketCap: 664.095 Millions | |
| Recent Price: 65.01 Smart Investing & Trading Score: 100 | |
| Day Percent Change: 2.01% Day Change: 1.28 | |
| Week Change: 6.85% Year-to-date Change: 38.9% | |
| AGX Links: Profile News Message Board | |
| Charts:- Daily , Weekly | |
| Add AGX to Watchlist: View: Get Complete AGX Trend Analysis ➞ | |
 | FPI Farmland Partners Inc. |
| Sector: Financials | |
| SubSector: REIT - Diversified | |
| MarketCap: 182.653 Millions | |
| Recent Price: 11.18 Smart Investing & Trading Score: 55 | |
| Day Percent Change: 2.01% Day Change: 0.22 | |
| Week Change: -0.27% Year-to-date Change: -10.4% | |
| FPI Links: Profile News Message Board | |
| Charts:- Daily , Weekly | |
| Add FPI to Watchlist: View: Get Complete FPI Trend Analysis ➞ | |
 | KVHI KVH Industries, Inc. |
| Sector: Technology | |
| SubSector: Communication Equipment | |
| MarketCap: 169.939 Millions | |
| Recent Price: 5.10 Smart Investing & Trading Score: 95 | |
| Day Percent Change: 2.00% Day Change: 0.10 | |
| Week Change: 2.2% Year-to-date Change: -3.0% | |
| KVHI Links: Profile News Message Board | |
| Charts:- Daily , Weekly | |
| Add KVHI to Watchlist: View: Get Complete KVHI Trend Analysis ➞ | |
 | CATO The Cato Corporation |
| Sector: Services & Goods | |
| SubSector: Apparel Stores | |
| MarketCap: 305.208 Millions | |
| Recent Price: 5.10 Smart Investing & Trading Score: 74 | |
| Day Percent Change: 2.00% Day Change: 0.10 | |
| Week Change: 3.03% Year-to-date Change: -28.6% | |
| CATO Links: Profile News Message Board | |
| Charts:- Daily , Weekly | |
| Add CATO to Watchlist: View: Get Complete CATO Trend Analysis ➞ | |
 | FNKO Funko, Inc. |
| Sector: Consumer Staples | |
| SubSector: Toys & Games | |
| MarketCap: 246.38 Millions | |
| Recent Price: 6.69 Smart Investing & Trading Score: 74 | |
| Day Percent Change: 1.98% Day Change: 0.13 | |
| Week Change: 1.83% Year-to-date Change: -13.5% | |
| FNKO Links: Profile News Message Board | |
| Charts:- Daily , Weekly | |
| Add FNKO to Watchlist: View: Get Complete FNKO Trend Analysis ➞ | |
 | PAYS PaySign, Inc. |
| Sector: Services & Goods | |
| SubSector: Business Services | |
| MarketCap: 213.882 Millions | |
| Recent Price: 4.67 Smart Investing & Trading Score: 80 | |
| Day Percent Change: 1.97% Day Change: 0.09 | |
| Week Change: -1.27% Year-to-date Change: 66.8% | |
| PAYS Links: Profile News Message Board | |
| Charts:- Daily , Weekly | |
| Add PAYS to Watchlist: View: Get Complete PAYS Trend Analysis ➞ | |
 | CCO Clear Channel Outdoor Holdings, Inc. |
| Sector: Services & Goods | |
| SubSector: Marketing Services | |
| MarketCap: 312.715 Millions | |
| Recent Price: 1.56 Smart Investing & Trading Score: 49 | |
| Day Percent Change: 1.96% Day Change: 0.03 | |
| Week Change: 4% Year-to-date Change: -14.3% | |
| CCO Links: Profile News Message Board | |
| Charts:- Daily , Weekly | |
| Add CCO to Watchlist: View: Get Complete CCO Trend Analysis ➞ | |
 | SPSC SPS Commerce, Inc. |
| Sector: Technology | |
| SubSector: Application Software | |
| MarketCap: 1398.02 Millions | |
| Recent Price: 192.68 Smart Investing & Trading Score: 100 | |
| Day Percent Change: 1.96% Day Change: 3.71 | |
| Week Change: 5.63% Year-to-date Change: -0.6% | |
| SPSC Links: Profile News Message Board | |
| Charts:- Daily , Weekly | |
| Add SPSC to Watchlist: View: Get Complete SPSC Trend Analysis ➞ | |
 | PAHC Phibro Animal Health Corporation |
| Sector: Health Care | |
| SubSector: Specialized Health Services | |
| MarketCap: 852.956 Millions | |
| Recent Price: 16.77 Smart Investing & Trading Score: 68 | |
| Day Percent Change: 1.95% Day Change: 0.32 | |
| Week Change: -1.76% Year-to-date Change: 44.8% | |
| PAHC Links: Profile News Message Board | |
| Charts:- Daily , Weekly | |
| Add PAHC to Watchlist: View: Get Complete PAHC Trend Analysis ➞ | |
 | SEM Select Medical Holdings Corporation |
| Sector: Health Care | |
| SubSector: Hospitals | |
| MarketCap: 1765.96 Millions | |
| Recent Price: 32.73 Smart Investing & Trading Score: 100 | |
| Day Percent Change: 1.93% Day Change: 0.62 | |
| Week Change: 4.14% Year-to-date Change: 39.3% | |
| SEM Links: Profile News Message Board | |
| Charts:- Daily , Weekly | |
| Add SEM to Watchlist: View: Get Complete SEM Trend Analysis ➞ | |
 | LTH Life Time Group Holdings, Inc. |
| Sector: Services & Goods | |
| SubSector: Leisure | |
| MarketCap: 3740 Millions | |
| Recent Price: 15.09 Smart Investing & Trading Score: 100 | |
| Day Percent Change: 1.93% Day Change: 0.29 | |
| Week Change: 7.14% Year-to-date Change: -0.4% | |
| LTH Links: Profile News Message Board | |
| Charts:- Daily , Weekly | |
| Add LTH to Watchlist: View: Get Complete LTH Trend Analysis ➞ | |
| Too many stocks? View smallcap stocks filtered by marketcap & sector |
| Marketcap: All SmallCap Stocks (default-no microcap), Large, Mid-Range, Small & MicroCap |
| Sector: Tech, Finance, Energy, Staples, Retail, Industrial, Materials, Utilities & Medical |
|
Best Stocks Today 12Stocks.com |
© 2024 12Stocks.com Terms & Conditions Privacy Contact Us
All Information Provided Only For Education And Not To Be Used For Investing or Trading. See Terms & Conditions


One More Thing ... Get Best Stocks Delivered Daily!
Never Ever Miss A Move With Our Top Ten Stocks Lists
Find Best Stocks In Any Market - Bull or Bear Market
Take A Peek At Our Top Ten Stocks Lists: Daily, Weekly, Year-to-Date & Top Trends
Find Best Stocks In Any Market - Bull or Bear Market
Take A Peek At Our Top Ten Stocks Lists: Daily, Weekly, Year-to-Date & Top Trends
Smallcap Stocks With Best Up Trends [0-bearish to 100-bullish]: Design [100], Ambac Financial[100], Summit [100], EverQuote [100], Zeta Global[100], Coca-Cola Consolidated[100], J & J Snack Foods[100], Sterling Construction[100], Vanda [100], CPI Card[100], Semrush [100]
Best Smallcap Stocks Year-to-Date:
CareMax [570.1%], Janux [472.36%], Viking [327.78%], Longboard [260.8%], Alpine Immune[239.34%], Bakkt [226.91%], Vera [190.7%], Super Micro[188.22%], Cullinan Oncology[187.89%], Avidity Biosciences[180.86%], Y-mAbs [152.49%] Best Smallcap Stocks This Week:
Perficient [52.32%], Thoughtworks Holding[34.22%], Trupanion [28.72%], DASAN Zhone[26.29%], Great Lakes[25.72%], Workhorse Group[24.5%], Design [23.42%], Ambac Financial[22.97%], P3 Health[22.36%], Outset Medical[21.09%], Summit [20.96%] Best Smallcap Stocks Daily:
Design [28.85%], Great Lakes[24.29%], Thoughtworks Holding[19.84%], Ambac Financial[19.31%], Summit [18.79%], EverQuote [18.40%], Origin Materials[18.38%], Zeta Global[18.35%], FibroGen [18.10%], Coca-Cola Consolidated[17.65%], Children s[16.44%]