
 Login Sign Up


| |||||
 |  | ||||

| 12Stocks.com Market Intelligence |
Best SmallCap Stocks
|
| In a hurry? Small Cap Stock Lists: Performance Trends Table, Stock Charts
Sort Small Cap stocks: Daily, Weekly, Year-to-Date, Market Cap & Trends. Filter Small Cap stocks list by sector: Show all, Tech, Finance, Energy, Staples, Retail, Industrial, Materials, Utilities and HealthCare Filter Small Cap stocks list by size: All Large Medium Small and MicroCap |
| 12Stocks.com Small Cap Stocks Performances & Trends Daily | |||||||||
|
|  The overall Smart Investing & Trading Score is 70 (0-bearish to 100-bullish) which puts Small Cap index in short term neutral to bullish trend. The Smart Investing & Trading Score from previous trading session is 87 and hence a deterioration of trend.
| ||||||||
Here are the Smart Investing & Trading Scores of the most requested small cap stocks at 12Stocks.com (click stock name for detailed review):
|


| 12Stocks.com: Investing in Smallcap Index with Stocks | |
|
The following table helps investors and traders sort through current performance and trends (as measured by Smart Investing & Trading Score) of various
stocks in the Smallcap Index. Quick View: Move mouse or cursor over stock symbol (ticker) to view short-term technical chart and over stock name to view long term chart. Click on  to add stock symbol to your watchlist and to add stock symbol to your watchlist and  to view watchlist. Click on any ticker or stock name for detailed market intelligence report for that stock. to view watchlist. Click on any ticker or stock name for detailed market intelligence report for that stock. |
12Stocks.com Performance of Stocks in Smallcap Index
| Ticker | Stock Name | Watchlist | Category | Recent Price | Smart Investing & Trading Score | Change % | YTD Change% |
| PCT | PureCycle |   | Industrials | 4.84 | 17 | -3.59 | 19.36% |
| TCMD | Tactile Systems | | Health Care | 13.92 | 18 | -3.60 | -2.66% |
| SILK | Silk Road | | Health Care | 19.80 | 83 | -3.67 | 61.33% |
| RMR | RMR Group | | Financials | 22.93 | 15 | -3.72 | -18.76% |
| COKE | Coca-Cola Consolidated | | Consumer Staples | 971.67 | 100 | -3.73 | 4.66% |
| GBIO | Generation Bio | | Health Care | 3.06 | 63 | -3.77 | 85.45% |
| BWMN | Bowman Consulting | | Industrials | 31.98 | 76 | -3.81 | -9.19% |
| CMTG | Claros Mortgage | | Financials | 8.33 | 10 | -3.81 | -39.96% |
| EOLS | Evolus | | Health Care | 12.96 | 62 | -3.82 | 23.03% |
| OPI | Office Properties | | Financials | 2.38 | 42 | -3.83 | -67.42% |
| CABA | Cabaletta Bio | | Health Care | 12.26 | 35 | -3.84 | -45.99% |
| IKNA | Ikena Oncology | | Health Care | 1.36 | 62 | -3.90 | -32.25% |
| NEOG | Neogen | | Health Care | 11.93 | 25 | -3.91 | -40.70% |
| CUE | Cue Biopharma | | Health Care | 2.09 | 93 | -3.91 | -20.83% |
| MQ | Marqeta | | Technology | 5.60 | 42 | -3.95 | -20.40% |
| IHRT | iHeartMedia | | Services & Goods | 2.19 | 57 | -3.96 | -18.16% |
| NSSC | Napco Security | | Services & Goods | 43.89 | 93 | -4.04 | 28.15% |
| HCKT | Hackett Group | | Technology | 21.30 | 35 | -4.05 | -6.46% |
| SNDX | Syndax | | Health Care | 22.24 | 67 | -4.06 | 2.92% |
| SGMO | Sangamo | | Health Care | 0.52 | 47 | -4.07 | -4.68% |
| SHCR | Sharecare | | Health Care | 0.70 | 25 | -4.12 | -35.85% |
| FCEL | FuelCell Energy | | Industrials | 0.76 | 0 | -4.15 | -52.71% |
| FOSL | Fossil Group | | Consumer Staples | 0.93 | 37 | -4.15 | -36.50% |
| TSVT | 2seventy bio | | Health Care | 4.75 | 62 | -4.23 | 9.83% |
| MAXN | Maxeon Solar | | Technology | 2.18 | 60 | -4.39 | -69.64% |


| Too many stocks? View smallcap stocks filtered by marketcap & sector |
| Marketcap: All SmallCap Stocks (default-no microcap), Large, Mid-Range, Small |
| Smallcap Sector: Tech, Finance, Energy, Staples, Retail, Industrial, Materials, & Medical |
|
Get the most comprehensive stock market coverage daily at 12Stocks.com ➞ Best Stocks Today ➞ Best Stocks Weekly ➞ Best Stocks Year-to-Date ➞ Best Stocks Trends ➞  Best Stocks Today 12Stocks.com Best Nasdaq Stocks ➞ Best S&P 500 Stocks ➞ Best Tech Stocks ➞ Best Biotech Stocks ➞ |
| Detailed Overview of SmallCap Stocks |
| SmallCap Technical Overview, Leaders & Laggards, Top SmallCap ETF Funds & Detailed SmallCap Stocks List, Charts, Trends & More |
| Smallcap: Technical Analysis, Trends & YTD Performance | |
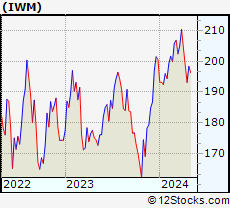
| SmallCap segment as represented by
IWM, an exchange-traded fund [ETF], holds basket of thousands of smallcap stocks from across all major sectors of the US stock market. The smallcap index (contains stocks like Riverbed & Sotheby's) is up by 1.47% and is currently underperforming the overall market by -6.62% year-to-date. Below is a quick view of technical charts and trends: | |
 IWM Weekly Chart |
|
| Long Term Trend: Deteriorating | |
| Medium Term Trend: Very Good | |
 IWM Daily Chart |
|
| Short Term Trend: Good | |
| Overall Trend Score: 70 | |
| YTD Performance: 1.47% | |
| **Trend Scores & Views Are Only For Educational Purposes And Not For Investing | |
| 12Stocks.com: Top Performing Small Cap Index Stocks | ||||||||||||||||||||||||||||||||||||||||||||||||
 The top performing Small Cap Index stocks year to date are
Now, more recently, over last week, the top performing Small Cap Index stocks on the move are


|
||||||||||||||||||||||||||||||||||||||||||||||||
| 12Stocks.com: Investing in Smallcap Index using Exchange Traded Funds | |
|
The following table shows list of key exchange traded funds (ETF) that
help investors track Smallcap index. The following list also includes leveraged ETF funds that track twice or thrice the daily returns of Smallcap indices. Short or inverse ETF funds move in the opposite direction to the index they track and are useful during market pullbacks or during bear markets. Quick View: Move mouse or cursor over ETF symbol (ticker) to view short-term technical chart and over ETF name to view long term chart. Click on ticker or stock name for detailed view. Click on to add stock symbol to your watchlist and to view watchlist. |
12Stocks.com List of ETFs that track Smallcap Index
| Ticker | ETF Name | Watchlist | Recent Price | Smart Investing & Trading Score | Change % | Week % | Year-to-date % |
| IWM | iShares Russell 2000 | | 203.67 | 70 | -0.63 | 0.88 | 1.47% |
| IJR | iShares Core S&P Small-Cap | | 107.77 | 58 | -0.79 | 0.59 | -0.45% |
| VTWO | Vanguard Russell 2000 ETF | | 82.27 | 57 | -0.69 | 0.81 | 1.44% |
| IWN | iShares Russell 2000 Value | | 154.59 | 76 | -0.67 | 0.24 | -0.48% |
| IWO | iShares Russell 2000 Growth | | 260.15 | 57 | -0.82 | 1.28 | 3.15% |
| IJS | iShares S&P Small-Cap 600 Value | | 99.06 | 40 | -0.62 | 0.34 | -3.89% |
| IJT | iShares S&P Small-Cap 600 Growth | | 128.54 | 71 | -1.00 | 0.61 | 2.72% |
| XSLV | PowerShares S&P SmallCap Low Volatil ETF | | 43.77 | 95 | -0.52 | 1.27 | -0.86% |
| SDD | ProShares UltraShort SmallCap600 | | 18.66 | 17 | 2.43 | -0.98 | 1.27% |
| SMLV | SPDR SSGA US Small Cap Low Volatil ETF | | 109.87 | 93 | -0.55 | 0.17 | -2.36% |
| SBB | ProShares Short SmallCap600 | | 16.11 | 7 | 0.91 | -0.28 | 1.16% |
| SAA | ProShares Ultra SmallCap600 | | 24.21 | 88 | -0.75 | 2.62 | -2.98% |
| 12Stocks.com: Charts, Trends, Fundamental Data and Performances of SmallCap Stocks | |
|
We now take in-depth look at all SmallCap stocks including charts, multi-period performances and overall trends (as measured by Smart Investing & Trading Score). One can sort SmallCap stocks (click link to choose) by Daily, Weekly and by Year-to-Date performances. Also, one can sort by size of the company or by market capitalization. |
| Select Your Default Chart Type: | |||||
| |||||
| Click on stock symbol or name for detailed view. Click on to add stock symbol to your watchlist and to view watchlist. Quick View: Move mouse or cursor over "Daily" to quickly view daily technical stock chart and over "Weekly" to view weekly technical stock chart. | |||||

 | PCT PureCycle Technologies, Inc. |
| Sector: Industrials | |
| SubSector: Pollution & Treatment Controls | |
| MarketCap: 1610 Millions | |
| Recent Price: 4.84 Smart Investing & Trading Score: 17 | |
| Day Percent Change: -3.59% Day Change: -0.18 | |
| Week Change: -9.36% Year-to-date Change: 19.4% | |
| PCT Links: Profile News Message Board | |
| Charts:- Daily , Weekly | |
| Add PCT to Watchlist: View: Get Complete PCT Trend Analysis ➞ | |
 | TCMD Tactile Systems Technology, Inc. |
| Sector: Health Care | |
| SubSector: Medical Instruments & Supplies | |
| MarketCap: 655.96 Millions | |
| Recent Price: 13.92 Smart Investing & Trading Score: 18 | |
| Day Percent Change: -3.60% Day Change: -0.52 | |
| Week Change: -2.49% Year-to-date Change: -2.7% | |
| TCMD Links: Profile News Message Board | |
| Charts:- Daily , Weekly | |
| Add TCMD to Watchlist: View: Get Complete TCMD Trend Analysis ➞ | |
 | SILK Silk Road Medical, Inc |
| Sector: Health Care | |
| SubSector: Medical Appliances & Equipment | |
| MarketCap: 881.78 Millions | |
| Recent Price: 19.80 Smart Investing & Trading Score: 83 | |
| Day Percent Change: -3.67% Day Change: -0.75 | |
| Week Change: -2.39% Year-to-date Change: 61.3% | |
| SILK Links: Profile News Message Board | |
| Charts:- Daily , Weekly | |
| Add SILK to Watchlist: View: Get Complete SILK Trend Analysis ➞ | |
 | RMR The RMR Group Inc. |
| Sector: Financials | |
| SubSector: Real Estate Development | |
| MarketCap: 797.419 Millions | |
| Recent Price: 22.93 Smart Investing & Trading Score: 15 | |
| Day Percent Change: -3.72% Day Change: -0.89 | |
| Week Change: -5.38% Year-to-date Change: -18.8% | |
| RMR Links: Profile News Message Board | |
| Charts:- Daily , Weekly | |
| Add RMR to Watchlist: View: Get Complete RMR Trend Analysis ➞ | |
 | COKE Coca-Cola Consolidated, Inc. |
| Sector: Consumer Staples | |
| SubSector: Beverages - Soft Drinks | |
| MarketCap: 1392.2 Millions | |
| Recent Price: 971.67 Smart Investing & Trading Score: 100 | |
| Day Percent Change: -3.73% Day Change: -37.64 | |
| Week Change: 13.86% Year-to-date Change: 4.7% | |
| COKE Links: Profile News Message Board | |
| Charts:- Daily , Weekly | |
| Add COKE to Watchlist: View: Get Complete COKE Trend Analysis ➞ | |
 | GBIO Generation Bio Co. |
| Sector: Health Care | |
| SubSector: Biotechnology | |
| MarketCap: 17487 Millions | |
| Recent Price: 3.06 Smart Investing & Trading Score: 63 | |
| Day Percent Change: -3.77% Day Change: -0.12 | |
| Week Change: -3.77% Year-to-date Change: 85.5% | |
| GBIO Links: Profile News Message Board | |
| Charts:- Daily , Weekly | |
| Add GBIO to Watchlist: View: Get Complete GBIO Trend Analysis ➞ | |
 | BWMN Bowman Consulting Group Ltd. |
| Sector: Industrials | |
| SubSector: Engineering & Construction | |
| MarketCap: 443 Millions | |
| Recent Price: 31.98 Smart Investing & Trading Score: 76 | |
| Day Percent Change: -3.81% Day Change: -1.27 | |
| Week Change: 3.11% Year-to-date Change: -9.2% | |
| BWMN Links: Profile News Message Board | |
| Charts:- Daily , Weekly | |
| Add BWMN to Watchlist: View: Get Complete BWMN Trend Analysis ➞ | |
 | CMTG Claros Mortgage Trust, Inc. |
| Sector: Financials | |
| SubSector: REIT - Mortgage | |
| MarketCap: 1610 Millions | |
| Recent Price: 8.33 Smart Investing & Trading Score: 10 | |
| Day Percent Change: -3.81% Day Change: -0.33 | |
| Week Change: -9.85% Year-to-date Change: -40.0% | |
| CMTG Links: Profile News Message Board | |
| Charts:- Daily , Weekly | |
| Add CMTG to Watchlist: View: Get Complete CMTG Trend Analysis ➞ | |
 | EOLS Evolus, Inc. |
| Sector: Health Care | |
| SubSector: Drugs - Generic | |
| MarketCap: 145.885 Millions | |
| Recent Price: 12.96 Smart Investing & Trading Score: 62 | |
| Day Percent Change: -3.82% Day Change: -0.52 | |
| Week Change: -2.59% Year-to-date Change: 23.0% | |
| EOLS Links: Profile News Message Board | |
| Charts:- Daily , Weekly | |
| Add EOLS to Watchlist: View: Get Complete EOLS Trend Analysis ➞ | |
 | OPI Office Properties Income Trust |
| Sector: Financials | |
| SubSector: REIT - Office | |
| MarketCap: 1245.66 Millions | |
| Recent Price: 2.38 Smart Investing & Trading Score: 42 | |
| Day Percent Change: -3.83% Day Change: -0.10 | |
| Week Change: -16.9% Year-to-date Change: -67.4% | |
| OPI Links: Profile News Message Board | |
| Charts:- Daily , Weekly | |
| Add OPI to Watchlist: View: Get Complete OPI Trend Analysis ➞ | |
 | CABA Cabaletta Bio, Inc. |
| Sector: Health Care | |
| SubSector: Biotechnology | |
| MarketCap: 222.085 Millions | |
| Recent Price: 12.26 Smart Investing & Trading Score: 35 | |
| Day Percent Change: -3.84% Day Change: -0.49 | |
| Week Change: -1.05% Year-to-date Change: -46.0% | |
| CABA Links: Profile News Message Board | |
| Charts:- Daily , Weekly | |
| Add CABA to Watchlist: View: Get Complete CABA Trend Analysis ➞ | |
 | IKNA Ikena Oncology, Inc. |
| Sector: Health Care | |
| SubSector: Biotechnology | |
| MarketCap: 277 Millions | |
| Recent Price: 1.36 Smart Investing & Trading Score: 62 | |
| Day Percent Change: -3.90% Day Change: -0.05 | |
| Week Change: 1.5% Year-to-date Change: -32.3% | |
| IKNA Links: Profile News Message Board | |
| Charts:- Daily , Weekly | |
| Add IKNA to Watchlist: View: Get Complete IKNA Trend Analysis ➞ | |
 | NEOG Neogen Corporation |
| Sector: Health Care | |
| SubSector: Diagnostic Substances | |
| MarketCap: 3234.71 Millions | |
| Recent Price: 11.93 Smart Investing & Trading Score: 25 | |
| Day Percent Change: -3.91% Day Change: -0.48 | |
| Week Change: -0.79% Year-to-date Change: -40.7% | |
| NEOG Links: Profile News Message Board | |
| Charts:- Daily , Weekly | |
| Add NEOG to Watchlist: View: Get Complete NEOG Trend Analysis ➞ | |
 | CUE Cue Biopharma, Inc. |
| Sector: Health Care | |
| SubSector: Biotechnology | |
| MarketCap: 352.785 Millions | |
| Recent Price: 2.09 Smart Investing & Trading Score: 93 | |
| Day Percent Change: -3.91% Day Change: -0.08 | |
| Week Change: -1.88% Year-to-date Change: -20.8% | |
| CUE Links: Profile News Message Board | |
| Charts:- Daily , Weekly | |
| Add CUE to Watchlist: View: Get Complete CUE Trend Analysis ➞ | |
 | MQ Marqeta, Inc. |
| Sector: Technology | |
| SubSector: Software - Infrastructure | |
| MarketCap: 2650 Millions | |
| Recent Price: 5.60 Smart Investing & Trading Score: 42 | |
| Day Percent Change: -3.95% Day Change: -0.23 | |
| Week Change: 4.19% Year-to-date Change: -20.4% | |
| MQ Links: Profile News Message Board | |
| Charts:- Daily , Weekly | |
| Add MQ to Watchlist: View: Get Complete MQ Trend Analysis ➞ | |
 | IHRT iHeartMedia, Inc. |
| Sector: Services & Goods | |
| SubSector: Broadcasting - Radio | |
| MarketCap: 694 Millions | |
| Recent Price: 2.19 Smart Investing & Trading Score: 57 | |
| Day Percent Change: -3.96% Day Change: -0.09 | |
| Week Change: -2.89% Year-to-date Change: -18.2% | |
| IHRT Links: Profile News Message Board | |
| Charts:- Daily , Weekly | |
| Add IHRT to Watchlist: View: Get Complete IHRT Trend Analysis ➞ | |
 | NSSC Napco Security Technologies, Inc. |
| Sector: Services & Goods | |
| SubSector: Security & Protection Services | |
| MarketCap: 339.103 Millions | |
| Recent Price: 43.89 Smart Investing & Trading Score: 93 | |
| Day Percent Change: -4.04% Day Change: -1.85 | |
| Week Change: 3.34% Year-to-date Change: 28.2% | |
| NSSC Links: Profile News Message Board | |
| Charts:- Daily , Weekly | |
| Add NSSC to Watchlist: View: Get Complete NSSC Trend Analysis ➞ | |
 | HCKT The Hackett Group, Inc. |
| Sector: Technology | |
| SubSector: Information Technology Services | |
| MarketCap: 334.468 Millions | |
| Recent Price: 21.30 Smart Investing & Trading Score: 35 | |
| Day Percent Change: -4.05% Day Change: -0.90 | |
| Week Change: -3.79% Year-to-date Change: -6.5% | |
| HCKT Links: Profile News Message Board | |
| Charts:- Daily , Weekly | |
| Add HCKT to Watchlist: View: Get Complete HCKT Trend Analysis ➞ | |
 | SNDX Syndax Pharmaceuticals, Inc. |
| Sector: Health Care | |
| SubSector: Biotechnology | |
| MarketCap: 365.985 Millions | |
| Recent Price: 22.24 Smart Investing & Trading Score: 67 | |
| Day Percent Change: -4.06% Day Change: -0.94 | |
| Week Change: 0.86% Year-to-date Change: 2.9% | |
| SNDX Links: Profile News Message Board | |
| Charts:- Daily , Weekly | |
| Add SNDX to Watchlist: View: Get Complete SNDX Trend Analysis ➞ | |
 | SGMO Sangamo Therapeutics, Inc. |
| Sector: Health Care | |
| SubSector: Biotechnology | |
| MarketCap: 779.285 Millions | |
| Recent Price: 0.52 Smart Investing & Trading Score: 47 | |
| Day Percent Change: -4.07% Day Change: -0.02 | |
| Week Change: -6.82% Year-to-date Change: -4.7% | |
| SGMO Links: Profile News Message Board | |
| Charts:- Daily , Weekly | |
| Add SGMO to Watchlist: View: Get Complete SGMO Trend Analysis ➞ | |
 | SHCR Sharecare, Inc. |
| Sector: Health Care | |
| SubSector: Health Information Services | |
| MarketCap: 640 Millions | |
| Recent Price: 0.70 Smart Investing & Trading Score: 25 | |
| Day Percent Change: -4.12% Day Change: -0.03 | |
| Week Change: -2.66% Year-to-date Change: -35.9% | |
| SHCR Links: Profile News Message Board | |
| Charts:- Daily , Weekly | |
| Add SHCR to Watchlist: View: Get Complete SHCR Trend Analysis ➞ | |
 | FCEL FuelCell Energy, Inc. |
| Sector: Industrials | |
| SubSector: Industrial Electrical Equipment | |
| MarketCap: 347.079 Millions | |
| Recent Price: 0.76 Smart Investing & Trading Score: 0 | |
| Day Percent Change: -4.15% Day Change: -0.03 | |
| Week Change: -15.91% Year-to-date Change: -52.7% | |
| FCEL Links: Profile News Message Board | |
| Charts:- Daily , Weekly | |
| Add FCEL to Watchlist: View: Get Complete FCEL Trend Analysis ➞ | |
 | FOSL Fossil Group, Inc. |
| Sector: Consumer Staples | |
| SubSector: Textile - Apparel Footwear & Accessories | |
| MarketCap: 215.87 Millions | |
| Recent Price: 0.93 Smart Investing & Trading Score: 37 | |
| Day Percent Change: -4.15% Day Change: -0.04 | |
| Week Change: -8.21% Year-to-date Change: -36.5% | |
| FOSL Links: Profile News Message Board | |
| Charts:- Daily , Weekly | |
| Add FOSL to Watchlist: View: Get Complete FOSL Trend Analysis ➞ | |
 | TSVT 2seventy bio, Inc. |
| Sector: Health Care | |
| SubSector: Biotechnology | |
| MarketCap: 504 Millions | |
| Recent Price: 4.75 Smart Investing & Trading Score: 62 | |
| Day Percent Change: -4.23% Day Change: -0.21 | |
| Week Change: -0.63% Year-to-date Change: 9.8% | |
| TSVT Links: Profile News Message Board | |
| Charts:- Daily , Weekly | |
| Add TSVT to Watchlist: View: Get Complete TSVT Trend Analysis ➞ | |
 | MAXN Maxeon Solar Technologies, Ltd. |
| Sector: Technology | |
| SubSector: Solar | |
| MarketCap: 88787 Millions | |
| Recent Price: 2.18 Smart Investing & Trading Score: 60 | |
| Day Percent Change: -4.39% Day Change: -0.10 | |
| Week Change: -7.23% Year-to-date Change: -69.6% | |
| MAXN Links: Profile News Message Board | |
| Charts:- Daily , Weekly | |
| Add MAXN to Watchlist: View: Get Complete MAXN Trend Analysis ➞ | |
| Too many stocks? View smallcap stocks filtered by marketcap & sector |
| Marketcap: All SmallCap Stocks (default-no microcap), Large, Mid-Range, Small & MicroCap |
| Sector: Tech, Finance, Energy, Staples, Retail, Industrial, Materials, Utilities & Medical |
|
Best Stocks Today 12Stocks.com |
© 2024 12Stocks.com Terms & Conditions Privacy Contact Us
All Information Provided Only For Education And Not To Be Used For Investing or Trading. See Terms & Conditions


One More Thing ... Get Best Stocks Delivered Daily!
Never Ever Miss A Move With Our Top Ten Stocks Lists
Find Best Stocks In Any Market - Bull or Bear Market
Take A Peek At Our Top Ten Stocks Lists: Daily, Weekly, Year-to-Date & Top Trends
Find Best Stocks In Any Market - Bull or Bear Market
Take A Peek At Our Top Ten Stocks Lists: Daily, Weekly, Year-to-Date & Top Trends
Smallcap Stocks With Best Up Trends [0-bearish to 100-bullish]: Alpha and[100], Myriad Genetics[100], Hyster-Yale Materials[100], Pacira BioSciences[100], Hannon Armstrong[100], Orthofix Medical[100], Inogen [100], Ardmore Shipping[100], Wolverine World[100], Emergent BioSolutions[100], Payoneer Global[100]
Best Smallcap Stocks Year-to-Date:
Janux [384.97%], Viking [319.59%], Bakkt [255.16%], Longboard [254.83%], Alpine Immune[239.47%], Super Micro[193.67%], Vera [189.15%], Avidity Biosciences[185.95%], Cullinan Oncology[179.94%], Arcutis Bio[146.28%], Sana [135.19%] Best Smallcap Stocks This Week:
Perficient [52.68%], DASAN Zhone[40.85%], Innodata [37.95%], Thoughtworks Holding[37.33%], Design [32.5%], Cricut [30.45%], Latham Group[30.4%], Great Lakes[30.24%], Vigil Neuroscience[29.78%], Sterling Construction[25.77%], Outset Medical[25.72%] Best Smallcap Stocks Daily:
Innodata [37.54%], Cricut [35.17%], Veritone [25.41%], Ameresco [22.19%], PowerSchool [21.21%], Alpha and[19.97%], Myriad Genetics[19.26%], Latham Group[19.06%], Hyster-Yale Materials[18.10%], Denali [15.16%], Adaptive Bio[14.15%]