
 Login Sign Up


| |||||
 |  | ||||

| 12Stocks.com Market Intelligence |
Best SmallCap Stocks
|
| In a hurry? Small Cap Stock Lists: Performance Trends Table, Stock Charts
Sort Small Cap stocks: Daily, Weekly, Year-to-Date, Market Cap & Trends. Filter Small Cap stocks list by sector: Show all, Tech, Finance, Energy, Staples, Retail, Industrial, Materials, Utilities and HealthCare Filter Small Cap stocks list by size: All Large Medium Small and MicroCap |
| 12Stocks.com Small Cap Stocks Performances & Trends Daily | |||||||||
|
|  The overall Smart Investing & Trading Score is 70 (0-bearish to 100-bullish) which puts Small Cap index in short term neutral to bullish trend. The Smart Investing & Trading Score from previous trading session is 87 and hence a deterioration of trend.
| ||||||||
Here are the Smart Investing & Trading Scores of the most requested small cap stocks at 12Stocks.com (click stock name for detailed review):
|


| 12Stocks.com: Investing in Smallcap Index with Stocks | |
|
The following table helps investors and traders sort through current performance and trends (as measured by Smart Investing & Trading Score) of various
stocks in the Smallcap Index. Quick View: Move mouse or cursor over stock symbol (ticker) to view short-term technical chart and over stock name to view long term chart. Click on  to add stock symbol to your watchlist and to add stock symbol to your watchlist and  to view watchlist. Click on any ticker or stock name for detailed market intelligence report for that stock. to view watchlist. Click on any ticker or stock name for detailed market intelligence report for that stock. |
12Stocks.com Performance of Stocks in Smallcap Index
| Ticker | Stock Name | Watchlist | Category | Recent Price | Smart Investing & Trading Score | Change % | YTD Change% |
| AMLX | Amylyx |   | Health Care | 1.92 | 35 | -2.54 | -86.72% |
| KURA | Kura Oncology | | Health Care | 20.53 | 70 | -2.56 | 42.77% |
| MNRO | Monro | | Consumer Staples | 25.57 | 10 | -2.57 | -12.83% |
| JELD | JELD-WEN Holding | | Industrials | 13.97 | 0 | -2.58 | -26.01% |
| NBR | Nabors Industries | | Energy | 73.28 | 28 | -2.59 | -10.23% |
| PRTS | U.S. Auto | | Consumer Staples | 1.13 | 20 | -2.59 | -64.24% |
| HLVX | HilleVax | | Health Care | 13.53 | 45 | -2.59 | -17.88% |
| XNCR | Xencor | | Health Care | 23.61 | 68 | -2.60 | 11.21% |
| DIOD | Diodes | | Technology | 74.52 | 83 | -2.61 | -7.46% |
| MORF | Morphic Holding | | Health Care | 29.35 | 67 | -2.62 | 1.63% |
| RLJ | RLJ Lodging | | Financials | 10.38 | 0 | -2.63 | -11.43% |
| ENTA | Enanta | | Health Care | 12.76 | 17 | -2.63 | 35.55% |
| NWFL | Norwood Financial | | Financials | 24.67 | 45 | -2.64 | -25.04% |
| ME | 23andMe Holding | | Health Care | 0.48 | 48 | -2.65 | -45.66% |
| ALTG | Alta Equipment | | Transports | 11.60 | 43 | -2.68 | -6.22% |
| ICHR | Ichor | | Technology | 37.91 | 50 | -2.70 | 12.73% |
| USCB | USCB Financial | | Financials | 12.21 | 88 | -2.71 | -0.57% |
| EWCZ | European Wax | | Consumer Staples | 10.99 | 10 | -2.74 | -18.83% |
| NEO | NeoGenomics | | Health Care | 15.14 | 75 | -2.76 | -6.43% |
| PKST | Peakstone Realty | | Financials | 13.37 | 48 | -2.76 | -34.84% |
| FOLD | Amicus | | Health Care | 10.13 | 28 | -2.78 | -28.61% |
| OUT | Outfront Media | | Services & Goods | 14.70 | 39 | -2.78 | 5.30% |
| IRON | Disc Medicine | | Health Care | 29.20 | 52 | -2.80 | -49.66% |
| DFH | Dream Finders | | Services & Goods | 29.90 | 10 | -2.80 | -16.94% |
| PGNY | Progyny | | Technology | 32.16 | 50 | -2.81 | -13.50% |


| Too many stocks? View smallcap stocks filtered by marketcap & sector |
| Marketcap: All SmallCap Stocks (default-no microcap), Large, Mid-Range, Small |
| Smallcap Sector: Tech, Finance, Energy, Staples, Retail, Industrial, Materials, & Medical |
|
Get the most comprehensive stock market coverage daily at 12Stocks.com ➞ Best Stocks Today ➞ Best Stocks Weekly ➞ Best Stocks Year-to-Date ➞ Best Stocks Trends ➞  Best Stocks Today 12Stocks.com Best Nasdaq Stocks ➞ Best S&P 500 Stocks ➞ Best Tech Stocks ➞ Best Biotech Stocks ➞ |
| Detailed Overview of SmallCap Stocks |
| SmallCap Technical Overview, Leaders & Laggards, Top SmallCap ETF Funds & Detailed SmallCap Stocks List, Charts, Trends & More |
| Smallcap: Technical Analysis, Trends & YTD Performance | |
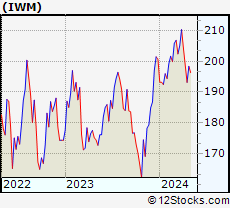
| SmallCap segment as represented by
IWM, an exchange-traded fund [ETF], holds basket of thousands of smallcap stocks from across all major sectors of the US stock market. The smallcap index (contains stocks like Riverbed & Sotheby's) is up by 1.53% and is currently underperforming the overall market by -6.51% year-to-date. Below is a quick view of technical charts and trends: | |
 IWM Weekly Chart |
|
| Long Term Trend: Deteriorating | |
| Medium Term Trend: Very Good | |
 IWM Daily Chart |
|
| Short Term Trend: Good | |
| Overall Trend Score: 70 | |
| YTD Performance: 1.53% | |
| **Trend Scores & Views Are Only For Educational Purposes And Not For Investing | |
| 12Stocks.com: Top Performing Small Cap Index Stocks | ||||||||||||||||||||||||||||||||||||||||||||||||
 The top performing Small Cap Index stocks year to date are
Now, more recently, over last week, the top performing Small Cap Index stocks on the move are


|
||||||||||||||||||||||||||||||||||||||||||||||||
| 12Stocks.com: Investing in Smallcap Index using Exchange Traded Funds | |
|
The following table shows list of key exchange traded funds (ETF) that
help investors track Smallcap index. The following list also includes leveraged ETF funds that track twice or thrice the daily returns of Smallcap indices. Short or inverse ETF funds move in the opposite direction to the index they track and are useful during market pullbacks or during bear markets. Quick View: Move mouse or cursor over ETF symbol (ticker) to view short-term technical chart and over ETF name to view long term chart. Click on ticker or stock name for detailed view. Click on to add stock symbol to your watchlist and to view watchlist. |
12Stocks.com List of ETFs that track Smallcap Index
| Ticker | ETF Name | Watchlist | Recent Price | Smart Investing & Trading Score | Change % | Week % | Year-to-date % |
| IWM | iShares Russell 2000 | | 203.78 | 70 | -0.58 | 0.93 | 1.53% |
| IJR | iShares Core S&P Small-Cap | | 108.26 | 58 | -0.33 | 1.05 | 0.01% |
| IWN | iShares Russell 2000 Value | | 155.37 | 76 | -0.17 | 0.75 | 0.03% |
| VTWO | Vanguard Russell 2000 ETF | | 82.40 | 57 | -0.53 | 0.97 | 1.6% |
| IWO | iShares Russell 2000 Growth | | 260.10 | 57 | -0.84 | 1.26 | 3.12% |
| IJS | iShares S&P Small-Cap 600 Value | | 99.80 | 40 | 0.12 | 1.09 | -3.17% |
| IJT | iShares S&P Small-Cap 600 Growth | | 129.03 | 71 | -0.62 | 0.99 | 3.11% |
| XSLV | PowerShares S&P SmallCap Low Volatil ETF | | 43.94 | 95 | -0.14 | 1.67 | -0.48% |
| SMLV | SPDR SSGA US Small Cap Low Volatil ETF | | 110.32 | 63 | -0.15 | 0.57 | -1.96% |
| SDD | ProShares UltraShort SmallCap600 | | 18.66 | 40 | 2.43 | -0.98 | 1.27% |
| SBB | ProShares Short SmallCap600 | | 16.08 | 25 | 0.69 | -0.5 | 0.94% |
| SAA | ProShares Ultra SmallCap600 | | 24.21 | 70 | -0.75 | 2.62 | -2.98% |
| 12Stocks.com: Charts, Trends, Fundamental Data and Performances of SmallCap Stocks | |
|
We now take in-depth look at all SmallCap stocks including charts, multi-period performances and overall trends (as measured by Smart Investing & Trading Score). One can sort SmallCap stocks (click link to choose) by Daily, Weekly and by Year-to-Date performances. Also, one can sort by size of the company or by market capitalization. |
| Select Your Default Chart Type: | |||||
| |||||
| Click on stock symbol or name for detailed view. Click on to add stock symbol to your watchlist and to view watchlist. Quick View: Move mouse or cursor over "Daily" to quickly view daily technical stock chart and over "Weekly" to view weekly technical stock chart. | |||||

 | AMLX Amylyx Pharmaceuticals, Inc. |
| Sector: Health Care | |
| SubSector: Biotechnology | |
| MarketCap: 1500 Millions | |
| Recent Price: 1.92 Smart Investing & Trading Score: 35 | |
| Day Percent Change: -2.54% Day Change: -0.05 | |
| Week Change: -6.57% Year-to-date Change: -86.7% | |
| AMLX Links: Profile News Message Board | |
| Charts:- Daily , Weekly | |
| Add AMLX to Watchlist: View: Get Complete AMLX Trend Analysis ➞ | |
 | KURA Kura Oncology, Inc. |
| Sector: Health Care | |
| SubSector: Biotechnology | |
| MarketCap: 401.885 Millions | |
| Recent Price: 20.53 Smart Investing & Trading Score: 70 | |
| Day Percent Change: -2.56% Day Change: -0.54 | |
| Week Change: -0.48% Year-to-date Change: 42.8% | |
| KURA Links: Profile News Message Board | |
| Charts:- Daily , Weekly | |
| Add KURA to Watchlist: View: Get Complete KURA Trend Analysis ➞ | |
 | MNRO Monro, Inc. |
| Sector: Consumer Staples | |
| SubSector: Auto Parts | |
| MarketCap: 1514.89 Millions | |
| Recent Price: 25.57 Smart Investing & Trading Score: 10 | |
| Day Percent Change: -2.57% Day Change: -0.68 | |
| Week Change: -5.24% Year-to-date Change: -12.8% | |
| MNRO Links: Profile News Message Board | |
| Charts:- Daily , Weekly | |
| Add MNRO to Watchlist: View: Get Complete MNRO Trend Analysis ➞ | |
 | JELD JELD-WEN Holding, Inc. |
| Sector: Industrials | |
| SubSector: General Building Materials | |
| MarketCap: 1022.53 Millions | |
| Recent Price: 13.97 Smart Investing & Trading Score: 0 | |
| Day Percent Change: -2.58% Day Change: -0.37 | |
| Week Change: -30.36% Year-to-date Change: -26.0% | |
| JELD Links: Profile News Message Board | |
| Charts:- Daily , Weekly | |
| Add JELD to Watchlist: View: Get Complete JELD Trend Analysis ➞ | |
 | NBR Nabors Industries Ltd. |
| Sector: Energy | |
| SubSector: Oil & Gas Drilling & Exploration | |
| MarketCap: 240.539 Millions | |
| Recent Price: 73.28 Smart Investing & Trading Score: 28 | |
| Day Percent Change: -2.59% Day Change: -1.95 | |
| Week Change: -1.28% Year-to-date Change: -10.2% | |
| NBR Links: Profile News Message Board | |
| Charts:- Daily , Weekly | |
| Add NBR to Watchlist: View: Get Complete NBR Trend Analysis ➞ | |
 | PRTS U.S. Auto Parts Network, Inc. |
| Sector: Consumer Staples | |
| SubSector: Auto Parts | |
| MarketCap: 65.0939 Millions | |
| Recent Price: 1.13 Smart Investing & Trading Score: 20 | |
| Day Percent Change: -2.59% Day Change: -0.03 | |
| Week Change: -11.72% Year-to-date Change: -64.2% | |
| PRTS Links: Profile News Message Board | |
| Charts:- Daily , Weekly | |
| Add PRTS to Watchlist: View: Get Complete PRTS Trend Analysis ➞ | |
 | HLVX HilleVax, Inc. |
| Sector: Health Care | |
| SubSector: Biotechnology | |
| MarketCap: 680 Millions | |
| Recent Price: 13.53 Smart Investing & Trading Score: 45 | |
| Day Percent Change: -2.59% Day Change: -0.36 | |
| Week Change: -3.5% Year-to-date Change: -17.9% | |
| HLVX Links: Profile News Message Board | |
| Charts:- Daily , Weekly | |
| Add HLVX to Watchlist: View: Get Complete HLVX Trend Analysis ➞ | |
 | XNCR Xencor, Inc. |
| Sector: Health Care | |
| SubSector: Biotechnology | |
| MarketCap: 1744.35 Millions | |
| Recent Price: 23.61 Smart Investing & Trading Score: 68 | |
| Day Percent Change: -2.60% Day Change: -0.63 | |
| Week Change: -2.07% Year-to-date Change: 11.2% | |
| XNCR Links: Profile News Message Board | |
| Charts:- Daily , Weekly | |
| Add XNCR to Watchlist: View: Get Complete XNCR Trend Analysis ➞ | |
 | DIOD Diodes Incorporated |
| Sector: Technology | |
| SubSector: Semiconductor - Integrated Circuits | |
| MarketCap: 1967.6 Millions | |
| Recent Price: 74.52 Smart Investing & Trading Score: 83 | |
| Day Percent Change: -2.61% Day Change: -2.00 | |
| Week Change: 2.37% Year-to-date Change: -7.5% | |
| DIOD Links: Profile News Message Board | |
| Charts:- Daily , Weekly | |
| Add DIOD to Watchlist: View: Get Complete DIOD Trend Analysis ➞ | |
 | MORF Morphic Holding, Inc. |
| Sector: Health Care | |
| SubSector: Biotechnology | |
| MarketCap: 484.885 Millions | |
| Recent Price: 29.35 Smart Investing & Trading Score: 67 | |
| Day Percent Change: -2.62% Day Change: -0.79 | |
| Week Change: -1.84% Year-to-date Change: 1.6% | |
| MORF Links: Profile News Message Board | |
| Charts:- Daily , Weekly | |
| Add MORF to Watchlist: View: Get Complete MORF Trend Analysis ➞ | |
 | RLJ RLJ Lodging Trust |
| Sector: Financials | |
| SubSector: REIT - Hotel/Motel | |
| MarketCap: 1019.34 Millions | |
| Recent Price: 10.38 Smart Investing & Trading Score: 0 | |
| Day Percent Change: -2.63% Day Change: -0.28 | |
| Week Change: -3.26% Year-to-date Change: -11.4% | |
| RLJ Links: Profile News Message Board | |
| Charts:- Daily , Weekly | |
| Add RLJ to Watchlist: View: Get Complete RLJ Trend Analysis ➞ | |
 | ENTA Enanta Pharmaceuticals, Inc. |
| Sector: Health Care | |
| SubSector: Biotechnology | |
| MarketCap: 998.385 Millions | |
| Recent Price: 12.76 Smart Investing & Trading Score: 17 | |
| Day Percent Change: -2.63% Day Change: -0.34 | |
| Week Change: -15.92% Year-to-date Change: 35.6% | |
| ENTA Links: Profile News Message Board | |
| Charts:- Daily , Weekly | |
| Add ENTA to Watchlist: View: Get Complete ENTA Trend Analysis ➞ | |
 | NWFL Norwood Financial Corp. |
| Sector: Financials | |
| SubSector: Regional - Northeast Banks | |
| MarketCap: 201.899 Millions | |
| Recent Price: 24.67 Smart Investing & Trading Score: 45 | |
| Day Percent Change: -2.64% Day Change: -0.67 | |
| Week Change: -2.72% Year-to-date Change: -25.0% | |
| NWFL Links: Profile News Message Board | |
| Charts:- Daily , Weekly | |
| Add NWFL to Watchlist: View: Get Complete NWFL Trend Analysis ➞ | |
 | ME 23andMe Holding Co. |
| Sector: Health Care | |
| SubSector: Diagnostics & Research | |
| MarketCap: 802 Millions | |
| Recent Price: 0.48 Smart Investing & Trading Score: 48 | |
| Day Percent Change: -2.65% Day Change: -0.01 | |
| Week Change: -5.58% Year-to-date Change: -45.7% | |
| ME Links: Profile News Message Board | |
| Charts:- Daily , Weekly | |
| Add ME to Watchlist: View: Get Complete ME Trend Analysis ➞ | |
 | ALTG Alta Equipment Group Inc. |
| Sector: Transports | |
| SubSector: Rental & Leasing Services | |
| MarketCap: 86.9044 Millions | |
| Recent Price: 11.60 Smart Investing & Trading Score: 43 | |
| Day Percent Change: -2.68% Day Change: -0.32 | |
| Week Change: -0.77% Year-to-date Change: -6.2% | |
| ALTG Links: Profile News Message Board | |
| Charts:- Daily , Weekly | |
| Add ALTG to Watchlist: View: Get Complete ALTG Trend Analysis ➞ | |
 | ICHR Ichor Holdings, Ltd. |
| Sector: Technology | |
| SubSector: Semiconductor Equipment & Materials | |
| MarketCap: 409.018 Millions | |
| Recent Price: 37.91 Smart Investing & Trading Score: 50 | |
| Day Percent Change: -2.70% Day Change: -1.05 | |
| Week Change: -0.76% Year-to-date Change: 12.7% | |
| ICHR Links: Profile News Message Board | |
| Charts:- Daily , Weekly | |
| Add ICHR to Watchlist: View: Get Complete ICHR Trend Analysis ➞ | |
 | USCB USCB Financial Holdings, Inc. |
| Sector: Financials | |
| SubSector: Banks - Regional | |
| MarketCap: 198 Millions | |
| Recent Price: 12.21 Smart Investing & Trading Score: 88 | |
| Day Percent Change: -2.71% Day Change: -0.34 | |
| Week Change: 2.52% Year-to-date Change: -0.6% | |
| USCB Links: Profile News Message Board | |
| Charts:- Daily , Weekly | |
| Add USCB to Watchlist: View: Get Complete USCB Trend Analysis ➞ | |
 | EWCZ European Wax Center, Inc. |
| Sector: Consumer Staples | |
| SubSector: Household & Personal Products | |
| MarketCap: 1180 Millions | |
| Recent Price: 10.99 Smart Investing & Trading Score: 10 | |
| Day Percent Change: -2.74% Day Change: -0.31 | |
| Week Change: -7.26% Year-to-date Change: -18.8% | |
| EWCZ Links: Profile News Message Board | |
| Charts:- Daily , Weekly | |
| Add EWCZ to Watchlist: View: Get Complete EWCZ Trend Analysis ➞ | |
 | NEO NeoGenomics, Inc. |
| Sector: Health Care | |
| SubSector: Medical Laboratories & Research | |
| MarketCap: 2763.8 Millions | |
| Recent Price: 15.14 Smart Investing & Trading Score: 75 | |
| Day Percent Change: -2.76% Day Change: -0.43 | |
| Week Change: -1.05% Year-to-date Change: -6.4% | |
| NEO Links: Profile News Message Board | |
| Charts:- Daily , Weekly | |
| Add NEO to Watchlist: View: Get Complete NEO Trend Analysis ➞ | |
 | PKST Peakstone Realty Trust |
| Sector: Financials | |
| SubSector: REIT - Diversified | |
| MarketCap: 1050 Millions | |
| Recent Price: 13.37 Smart Investing & Trading Score: 48 | |
| Day Percent Change: -2.76% Day Change: -0.38 | |
| Week Change: -5.14% Year-to-date Change: -34.8% | |
| PKST Links: Profile News Message Board | |
| Charts:- Daily , Weekly | |
| Add PKST to Watchlist: View: Get Complete PKST Trend Analysis ➞ | |
 | FOLD Amicus Therapeutics, Inc. |
| Sector: Health Care | |
| SubSector: Biotechnology | |
| MarketCap: 2676.75 Millions | |
| Recent Price: 10.13 Smart Investing & Trading Score: 28 | |
| Day Percent Change: -2.78% Day Change: -0.29 | |
| Week Change: -2.6% Year-to-date Change: -28.6% | |
| FOLD Links: Profile News Message Board | |
| Charts:- Daily , Weekly | |
| Add FOLD to Watchlist: View: Get Complete FOLD Trend Analysis ➞ | |
 | OUT Outfront Media Inc. |
| Sector: Services & Goods | |
| SubSector: Marketing Services | |
| MarketCap: 1388.15 Millions | |
| Recent Price: 14.70 Smart Investing & Trading Score: 39 | |
| Day Percent Change: -2.78% Day Change: -0.42 | |
| Week Change: -2.58% Year-to-date Change: 5.3% | |
| OUT Links: Profile News Message Board | |
| Charts:- Daily , Weekly | |
| Add OUT to Watchlist: View: Get Complete OUT Trend Analysis ➞ | |
 | IRON Disc Medicine Opco Inc |
| Sector: Health Care | |
| SubSector: Biotechnology | |
| MarketCap: 1100 Millions | |
| Recent Price: 29.20 Smart Investing & Trading Score: 52 | |
| Day Percent Change: -2.80% Day Change: -0.84 | |
| Week Change: -2.01% Year-to-date Change: -49.7% | |
| IRON Links: Profile News Message Board | |
| Charts:- Daily , Weekly | |
| Add IRON to Watchlist: View: Get Complete IRON Trend Analysis ➞ | |
 | DFH Dream Finders Homes, Inc. |
| Sector: Services & Goods | |
| SubSector: Residential Construction | |
| MarketCap: 2270 Millions | |
| Recent Price: 29.90 Smart Investing & Trading Score: 10 | |
| Day Percent Change: -2.80% Day Change: -0.86 | |
| Week Change: -4.06% Year-to-date Change: -16.9% | |
| DFH Links: Profile News Message Board | |
| Charts:- Daily , Weekly | |
| Add DFH to Watchlist: View: Get Complete DFH Trend Analysis ➞ | |
 | PGNY Progyny, Inc. |
| Sector: Technology | |
| SubSector: Healthcare Information Services | |
| MarketCap: 1839.05 Millions | |
| Recent Price: 32.16 Smart Investing & Trading Score: 50 | |
| Day Percent Change: -2.81% Day Change: -0.93 | |
| Week Change: 1.39% Year-to-date Change: -13.5% | |
| PGNY Links: Profile News Message Board | |
| Charts:- Daily , Weekly | |
| Add PGNY to Watchlist: View: Get Complete PGNY Trend Analysis ➞ | |
| Too many stocks? View smallcap stocks filtered by marketcap & sector |
| Marketcap: All SmallCap Stocks (default-no microcap), Large, Mid-Range, Small & MicroCap |
| Sector: Tech, Finance, Energy, Staples, Retail, Industrial, Materials, Utilities & Medical |
|
Best Stocks Today 12Stocks.com |
© 2024 12Stocks.com Terms & Conditions Privacy Contact Us
All Information Provided Only For Education And Not To Be Used For Investing or Trading. See Terms & Conditions


One More Thing ... Get Best Stocks Delivered Daily!
Never Ever Miss A Move With Our Top Ten Stocks Lists
Find Best Stocks In Any Market - Bull or Bear Market
Take A Peek At Our Top Ten Stocks Lists: Daily, Weekly, Year-to-Date & Top Trends
Find Best Stocks In Any Market - Bull or Bear Market
Take A Peek At Our Top Ten Stocks Lists: Daily, Weekly, Year-to-Date & Top Trends
Smallcap Stocks With Best Up Trends [0-bearish to 100-bullish]: Cricut [100], DASAN Zhone[100], Latham Group[100], Hyster-Yale Materials[100], Myriad Genetics[100], Alpha and[100], Vigil Neuroscience[100], Hannon Armstrong[100], Ardmore Shipping[100], Inogen [100], Payoneer Global[100]
Best Smallcap Stocks Year-to-Date:
CareMax [580.41%], Janux [415.82%], Viking [329.77%], Bakkt [295.29%], Longboard [255.4%], Alpine Immune[239.73%], Vera [190.25%], Super Micro[189.4%], Avidity Biosciences[188.27%], Cullinan Oncology[172%], Arcutis Bio[147.06%] Best Smallcap Stocks This Week:
DASAN Zhone[64.32%], Innodata [55.88%], Perficient [52.92%], Cricut [42.32%], Vigil Neuroscience[39.52%], Thoughtworks Holding[36.89%], Latham Group[35.9%], Great Lakes[32.18%], Bakkt [31.96%], Outset Medical[31.95%], P3 Health[27.95%] Best Smallcap Stocks Daily:
Innodata [55.42%], Cricut [47.47%], DASAN Zhone[30.11%], Latham Group[24.08%], Hyster-Yale Materials[23.55%], iRobot [21.40%], Myriad Genetics[21.13%], Ameresco [21.13%], Bakkt [20.92%], Alpha and[20.78%], Vigil Neuroscience[18.97%]