
 Login Sign Up


| |||||
 |  | ||||

| 12Stocks.com Market Intelligence |
Best SmallCap Stocks
|
| In a hurry? Small Cap Stock Lists: Performance Trends Table, Stock Charts
Sort Small Cap stocks: Daily, Weekly, Year-to-Date, Market Cap & Trends. Filter Small Cap stocks list by sector: Show all, Tech, Finance, Energy, Staples, Retail, Industrial, Materials, Utilities and HealthCare Filter Small Cap stocks list by size: All Large Medium Small and MicroCap |
| 12Stocks.com Small Cap Stocks Performances & Trends Daily | |||||||||
|
|  The overall Smart Investing & Trading Score is 70 (0-bearish to 100-bullish) which puts Small Cap index in short term neutral to bullish trend. The Smart Investing & Trading Score from previous trading session is 87 and hence a deterioration of trend.
| ||||||||
Here are the Smart Investing & Trading Scores of the most requested small cap stocks at 12Stocks.com (click stock name for detailed review):
|


| 12Stocks.com: Investing in Smallcap Index with Stocks | |
|
The following table helps investors and traders sort through current performance and trends (as measured by Smart Investing & Trading Score) of various
stocks in the Smallcap Index. Quick View: Move mouse or cursor over stock symbol (ticker) to view short-term technical chart and over stock name to view long term chart. Click on  to add stock symbol to your watchlist and to add stock symbol to your watchlist and  to view watchlist. Click on any ticker or stock name for detailed market intelligence report for that stock. to view watchlist. Click on any ticker or stock name for detailed market intelligence report for that stock. |
12Stocks.com Performance of Stocks in Smallcap Index
| Ticker | Stock Name | Watchlist | Category | Recent Price | Smart Investing & Trading Score | Change % | YTD Change% |
| EVCM | EverCommerce |   | Technology | 9.86 | 88 | -1.10 | -11.37% |
| LIVN | LivaNova | | Health Care | 62.46 | 68 | -1.11 | 20.72% |
| SEAT | Vivid Seats | | Services & Goods | 5.35 | 35 | -1.11 | -14.26% |
| KAR | KAR Auction | | Services & Goods | 17.68 | 58 | -1.12 | 19.38% |
| OMCL | Omnicell | | Technology | 29.96 | 83 | -1.12 | -20.38% |
| BNL | Broadstone Net | | Financials | 15.01 | 48 | -1.12 | -12.83% |
| ALTR | Altair Engineering | | Technology | 85.16 | 77 | -1.13 | 1.20% |
| OGS | ONE Gas | | Utilities | 64.09 | 44 | -1.14 | 0.58% |
| CDMO | Avid Bioservices | | Health Care | 8.65 | 88 | -1.14 | 33.08% |
| LXU | LSB Industries | | Materials | 8.57 | 76 | -1.15 | -7.95% |
| HPP | Hudson Pacific | | Financials | 5.16 | 10 | -1.15 | -44.58% |
| CHEF | Chefs | | Consumer Staples | 38.28 | 82 | -1.16 | 30.07% |
| PNM | PNM Resources | | Utilities | 37.97 | 76 | -1.17 | -8.73% |
| RUSHB | Rush Enterprises | | Services & Goods | 42.09 | 32 | -1.17 | -20.55% |
| THRD | Third Harmonic | | Health Care | 11.79 | 83 | -1.17 | 7.04% |
| SKY | Skyline Champion | | Industrials | 78.62 | 23 | -1.19 | 5.87% |
| VHI | Valhi | | Materials | 14.94 | 68 | -1.19 | -1.65% |
| III | Information Services | | Technology | 3.33 | 18 | -1.19 | -29.30% |
| LMAT | LeMaitre Vascular | | Health Care | 75.00 | 95 | -1.19 | 32.14% |
| GCBC | Greene County | | Financials | 31.28 | 83 | -1.20 | 10.92% |
| SKWD | Skyward Specialty | | Financials | 37.16 | 78 | -1.20 | 9.46% |
| RC | Ready Capital | | Financials | 8.57 | 28 | -1.21 | -16.34% |
| RXO | RXO | | Industrials | 20.47 | 57 | -1.21 | -12.41% |
| IPI | Intrepid Potash | | Materials | 21.07 | 62 | -1.22 | -11.80% |
| RMNI | Rimini Street | | Technology | 2.43 | 10 | -1.22 | -25.69% |


| Too many stocks? View smallcap stocks filtered by marketcap & sector |
| Marketcap: All SmallCap Stocks (default-no microcap), Large, Mid-Range, Small |
| Smallcap Sector: Tech, Finance, Energy, Staples, Retail, Industrial, Materials, & Medical |
|
Get the most comprehensive stock market coverage daily at 12Stocks.com ➞ Best Stocks Today ➞ Best Stocks Weekly ➞ Best Stocks Year-to-Date ➞ Best Stocks Trends ➞  Best Stocks Today 12Stocks.com Best Nasdaq Stocks ➞ Best S&P 500 Stocks ➞ Best Tech Stocks ➞ Best Biotech Stocks ➞ |
| Detailed Overview of SmallCap Stocks |
| SmallCap Technical Overview, Leaders & Laggards, Top SmallCap ETF Funds & Detailed SmallCap Stocks List, Charts, Trends & More |
| Smallcap: Technical Analysis, Trends & YTD Performance | |
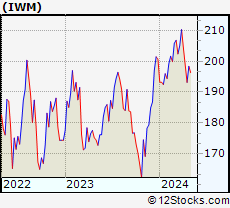
| SmallCap segment as represented by
IWM, an exchange-traded fund [ETF], holds basket of thousands of smallcap stocks from across all major sectors of the US stock market. The smallcap index (contains stocks like Riverbed & Sotheby's) is up by 1.53% and is currently underperforming the overall market by -6.51% year-to-date. Below is a quick view of technical charts and trends: | |
 IWM Weekly Chart |
|
| Long Term Trend: Very Good | |
| Medium Term Trend: Very Good | |
 IWM Daily Chart |
|
| Short Term Trend: Good | |
| Overall Trend Score: 70 | |
| YTD Performance: 1.53% | |
| **Trend Scores & Views Are Only For Educational Purposes And Not For Investing | |
| 12Stocks.com: Top Performing Small Cap Index Stocks | ||||||||||||||||||||||||||||||||||||||||||||||||
 The top performing Small Cap Index stocks year to date are
Now, more recently, over last week, the top performing Small Cap Index stocks on the move are


|
||||||||||||||||||||||||||||||||||||||||||||||||
| 12Stocks.com: Investing in Smallcap Index using Exchange Traded Funds | |
|
The following table shows list of key exchange traded funds (ETF) that
help investors track Smallcap index. The following list also includes leveraged ETF funds that track twice or thrice the daily returns of Smallcap indices. Short or inverse ETF funds move in the opposite direction to the index they track and are useful during market pullbacks or during bear markets. Quick View: Move mouse or cursor over ETF symbol (ticker) to view short-term technical chart and over ETF name to view long term chart. Click on ticker or stock name for detailed view. Click on to add stock symbol to your watchlist and to view watchlist. |
12Stocks.com List of ETFs that track Smallcap Index
| Ticker | ETF Name | Watchlist | Recent Price | Smart Investing & Trading Score | Change % | Week % | Year-to-date % |
| IWM | iShares Russell 2000 | | 203.78 | 70 | -0.58 | 0.93 | 1.53% |
| IJR | iShares Core S&P Small-Cap | | 108.26 | 88 | -0.33 | 1.05 | 0.01% |
| IWN | iShares Russell 2000 Value | | 155.37 | 88 | -0.17 | 0.75 | 0.03% |
| VTWO | Vanguard Russell 2000 ETF | | 82.40 | 57 | -0.53 | 0.97 | 1.6% |
| IWO | iShares Russell 2000 Growth | | 260.10 | 57 | -0.84 | 1.26 | 3.12% |
| IJS | iShares S&P Small-Cap 600 Value | | 99.80 | 70 | 0.12 | 1.09 | -3.17% |
| IJT | iShares S&P Small-Cap 600 Growth | | 129.03 | 83 | -0.62 | 0.99 | 3.11% |
| XSLV | PowerShares S&P SmallCap Low Volatil ETF | | 43.94 | 100 | -0.14 | 1.67 | -0.48% |
| SMLV | SPDR SSGA US Small Cap Low Volatil ETF | | 110.32 | 68 | -0.15 | 0.57 | -1.96% |
| SDD | ProShares UltraShort SmallCap600 | | 18.66 | 40 | 2.43 | -0.98 | 1.27% |
| SBB | ProShares Short SmallCap600 | | 16.08 | 38 | 0.69 | -0.5 | 0.94% |
| SAA | ProShares Ultra SmallCap600 | | 24.21 | 70 | -0.75 | 2.62 | -2.98% |
| 12Stocks.com: Charts, Trends, Fundamental Data and Performances of SmallCap Stocks | |
|
We now take in-depth look at all SmallCap stocks including charts, multi-period performances and overall trends (as measured by Smart Investing & Trading Score). One can sort SmallCap stocks (click link to choose) by Daily, Weekly and by Year-to-Date performances. Also, one can sort by size of the company or by market capitalization. |
| Select Your Default Chart Type: | |||||
| |||||
| Click on stock symbol or name for detailed view. Click on to add stock symbol to your watchlist and to view watchlist. Quick View: Move mouse or cursor over "Daily" to quickly view daily technical stock chart and over "Weekly" to view weekly technical stock chart. | |||||

 | EVCM EverCommerce Inc. |
| Sector: Technology | |
| SubSector: Software - Infrastructure | |
| MarketCap: 2210 Millions | |
| Recent Price: 9.86 Smart Investing & Trading Score: 88 | |
| Day Percent Change: -1.10% Day Change: -0.11 | |
| Week Change: 3.9% Year-to-date Change: -11.4% | |
| EVCM Links: Profile News Message Board | |
| Charts:- Daily , Weekly | |
| Add EVCM to Watchlist: View: Get Complete EVCM Trend Analysis ➞ | |
 | LIVN LivaNova PLC |
| Sector: Health Care | |
| SubSector: Medical Appliances & Equipment | |
| MarketCap: 2060.5 Millions | |
| Recent Price: 62.46 Smart Investing & Trading Score: 68 | |
| Day Percent Change: -1.11% Day Change: -0.70 | |
| Week Change: -2.63% Year-to-date Change: 20.7% | |
| LIVN Links: Profile News Message Board | |
| Charts:- Daily , Weekly | |
| Add LIVN to Watchlist: View: Get Complete LIVN Trend Analysis ➞ | |
 | SEAT Vivid Seats Inc. |
| Sector: Services & Goods | |
| SubSector: Internet Content & Information | |
| MarketCap: 1560 Millions | |
| Recent Price: 5.35 Smart Investing & Trading Score: 35 | |
| Day Percent Change: -1.11% Day Change: -0.06 | |
| Week Change: -0.65% Year-to-date Change: -14.3% | |
| SEAT Links: Profile News Message Board | |
| Charts:- Daily , Weekly | |
| Add SEAT to Watchlist: View: Get Complete SEAT Trend Analysis ➞ | |
 | KAR KAR Auction Services, Inc. |
| Sector: Services & Goods | |
| SubSector: Specialty Retail, Other | |
| MarketCap: 1709.54 Millions | |
| Recent Price: 17.68 Smart Investing & Trading Score: 58 | |
| Day Percent Change: -1.12% Day Change: -0.20 | |
| Week Change: -0.06% Year-to-date Change: 19.4% | |
| KAR Links: Profile News Message Board | |
| Charts:- Daily , Weekly | |
| Add KAR to Watchlist: View: Get Complete KAR Trend Analysis ➞ | |
 | OMCL Omnicell, Inc. |
| Sector: Technology | |
| SubSector: Healthcare Information Services | |
| MarketCap: 2781.05 Millions | |
| Recent Price: 29.96 Smart Investing & Trading Score: 83 | |
| Day Percent Change: -1.12% Day Change: -0.34 | |
| Week Change: -0.56% Year-to-date Change: -20.4% | |
| OMCL Links: Profile News Message Board | |
| Charts:- Daily , Weekly | |
| Add OMCL to Watchlist: View: Get Complete OMCL Trend Analysis ➞ | |
 | BNL Broadstone Net Lease, Inc. |
| Sector: Financials | |
| SubSector: REIT Diversified | |
| MarketCap: 27267 Millions | |
| Recent Price: 15.01 Smart Investing & Trading Score: 48 | |
| Day Percent Change: -1.12% Day Change: -0.17 | |
| Week Change: -1.44% Year-to-date Change: -12.8% | |
| BNL Links: Profile News Message Board | |
| Charts:- Daily , Weekly | |
| Add BNL to Watchlist: View: Get Complete BNL Trend Analysis ➞ | |
 | ALTR Altair Engineering Inc. |
| Sector: Technology | |
| SubSector: Semiconductor - Specialized | |
| MarketCap: 2072.2 Millions | |
| Recent Price: 85.16 Smart Investing & Trading Score: 77 | |
| Day Percent Change: -1.13% Day Change: -0.97 | |
| Week Change: 4.53% Year-to-date Change: 1.2% | |
| ALTR Links: Profile News Message Board | |
| Charts:- Daily , Weekly | |
| Add ALTR to Watchlist: View: Get Complete ALTR Trend Analysis ➞ | |
 | OGS ONE Gas, Inc. |
| Sector: Utilities | |
| SubSector: Gas Utilities | |
| MarketCap: 4051.17 Millions | |
| Recent Price: 64.09 Smart Investing & Trading Score: 44 | |
| Day Percent Change: -1.14% Day Change: -0.74 | |
| Week Change: -2.08% Year-to-date Change: 0.6% | |
| OGS Links: Profile News Message Board | |
| Charts:- Daily , Weekly | |
| Add OGS to Watchlist: View: Get Complete OGS Trend Analysis ➞ | |
 | CDMO Avid Bioservices, Inc. |
| Sector: Health Care | |
| SubSector: Biotechnology | |
| MarketCap: 203.685 Millions | |
| Recent Price: 8.65 Smart Investing & Trading Score: 88 | |
| Day Percent Change: -1.14% Day Change: -0.10 | |
| Week Change: 4.85% Year-to-date Change: 33.1% | |
| CDMO Links: Profile News Message Board | |
| Charts:- Daily , Weekly | |
| Add CDMO to Watchlist: View: Get Complete CDMO Trend Analysis ➞ | |
 | LXU LSB Industries, Inc. |
| Sector: Materials | |
| SubSector: Chemicals - Major Diversified | |
| MarketCap: 51.7736 Millions | |
| Recent Price: 8.57 Smart Investing & Trading Score: 76 | |
| Day Percent Change: -1.15% Day Change: -0.10 | |
| Week Change: 0.71% Year-to-date Change: -8.0% | |
| LXU Links: Profile News Message Board | |
| Charts:- Daily , Weekly | |
| Add LXU to Watchlist: View: Get Complete LXU Trend Analysis ➞ | |
 | HPP Hudson Pacific Properties, Inc. |
| Sector: Financials | |
| SubSector: REIT - Office | |
| MarketCap: 3267.16 Millions | |
| Recent Price: 5.16 Smart Investing & Trading Score: 10 | |
| Day Percent Change: -1.15% Day Change: -0.06 | |
| Week Change: -6.35% Year-to-date Change: -44.6% | |
| HPP Links: Profile News Message Board | |
| Charts:- Daily , Weekly | |
| Add HPP to Watchlist: View: Get Complete HPP Trend Analysis ➞ | |
 | CHEF The Chefs Warehouse, Inc. |
| Sector: Consumer Staples | |
| SubSector: Food Wholesale | |
| MarketCap: 207.529 Millions | |
| Recent Price: 38.28 Smart Investing & Trading Score: 82 | |
| Day Percent Change: -1.16% Day Change: -0.45 | |
| Week Change: 1.32% Year-to-date Change: 30.1% | |
| CHEF Links: Profile News Message Board | |
| Charts:- Daily , Weekly | |
| Add CHEF to Watchlist: View: Get Complete CHEF Trend Analysis ➞ | |
 | PNM PNM Resources, Inc. |
| Sector: Utilities | |
| SubSector: Diversified Utilities | |
| MarketCap: 2755.3 Millions | |
| Recent Price: 37.97 Smart Investing & Trading Score: 76 | |
| Day Percent Change: -1.17% Day Change: -0.45 | |
| Week Change: 0.5% Year-to-date Change: -8.7% | |
| PNM Links: Profile News Message Board | |
| Charts:- Daily , Weekly | |
| Add PNM to Watchlist: View: Get Complete PNM Trend Analysis ➞ | |
 | RUSHB Rush Enterprises, Inc. |
| Sector: Services & Goods | |
| SubSector: Auto Dealerships | |
| MarketCap: 203.221 Millions | |
| Recent Price: 42.09 Smart Investing & Trading Score: 32 | |
| Day Percent Change: -1.17% Day Change: -0.50 | |
| Week Change: 2.71% Year-to-date Change: -20.6% | |
| RUSHB Links: Profile News Message Board | |
| Charts:- Daily , Weekly | |
| Add RUSHB to Watchlist: View: Get Complete RUSHB Trend Analysis ➞ | |
 | THRD Third Harmonic Bio, Inc. |
| Sector: Health Care | |
| SubSector: Biotechnology | |
| MarketCap: 190 Millions | |
| Recent Price: 11.79 Smart Investing & Trading Score: 83 | |
| Day Percent Change: -1.17% Day Change: -0.14 | |
| Week Change: 0.94% Year-to-date Change: 7.0% | |
| THRD Links: Profile News Message Board | |
| Charts:- Daily , Weekly | |
| Add THRD to Watchlist: View: Get Complete THRD Trend Analysis ➞ | |
 | SKY Skyline Champion Corporation |
| Sector: Industrials | |
| SubSector: Manufactured Housing | |
| MarketCap: 915.145 Millions | |
| Recent Price: 78.62 Smart Investing & Trading Score: 23 | |
| Day Percent Change: -1.19% Day Change: -0.95 | |
| Week Change: -0.39% Year-to-date Change: 5.9% | |
| SKY Links: Profile News Message Board | |
| Charts:- Daily , Weekly | |
| Add SKY to Watchlist: View: Get Complete SKY Trend Analysis ➞ | |
 | VHI Valhi, Inc. |
| Sector: Materials | |
| SubSector: Chemicals - Major Diversified | |
| MarketCap: 394.336 Millions | |
| Recent Price: 14.94 Smart Investing & Trading Score: 68 | |
| Day Percent Change: -1.19% Day Change: -0.18 | |
| Week Change: 0.61% Year-to-date Change: -1.7% | |
| VHI Links: Profile News Message Board | |
| Charts:- Daily , Weekly | |
| Add VHI to Watchlist: View: Get Complete VHI Trend Analysis ➞ | |
 | III Information Services Group, Inc. |
| Sector: Technology | |
| SubSector: Information Technology Services | |
| MarketCap: 166.968 Millions | |
| Recent Price: 3.33 Smart Investing & Trading Score: 18 | |
| Day Percent Change: -1.19% Day Change: -0.04 | |
| Week Change: -0.3% Year-to-date Change: -29.3% | |
| III Links: Profile News Message Board | |
| Charts:- Daily , Weekly | |
| Add III to Watchlist: View: Get Complete III Trend Analysis ➞ | |
 | LMAT LeMaitre Vascular, Inc. |
| Sector: Health Care | |
| SubSector: Medical Instruments & Supplies | |
| MarketCap: 522.16 Millions | |
| Recent Price: 75.00 Smart Investing & Trading Score: 95 | |
| Day Percent Change: -1.19% Day Change: -0.90 | |
| Week Change: 1.05% Year-to-date Change: 32.1% | |
| LMAT Links: Profile News Message Board | |
| Charts:- Daily , Weekly | |
| Add LMAT to Watchlist: View: Get Complete LMAT Trend Analysis ➞ | |
 | GCBC Greene County Bancorp, Inc. |
| Sector: Financials | |
| SubSector: Savings & Loans | |
| MarketCap: 314.83 Millions | |
| Recent Price: 31.28 Smart Investing & Trading Score: 83 | |
| Day Percent Change: -1.20% Day Change: -0.38 | |
| Week Change: 0.71% Year-to-date Change: 10.9% | |
| GCBC Links: Profile News Message Board | |
| Charts:- Daily , Weekly | |
| Add GCBC to Watchlist: View: Get Complete GCBC Trend Analysis ➞ | |
 | SKWD Skyward Specialty Insurance Group, Inc. |
| Sector: Financials | |
| SubSector: Insurance - Property & Casualty | |
| MarketCap: 936 Millions | |
| Recent Price: 37.16 Smart Investing & Trading Score: 78 | |
| Day Percent Change: -1.20% Day Change: -0.45 | |
| Week Change: 1.46% Year-to-date Change: 9.5% | |
| SKWD Links: Profile News Message Board | |
| Charts:- Daily , Weekly | |
| Add SKWD to Watchlist: View: Get Complete SKWD Trend Analysis ➞ | |
 | RC Ready Capital Corporation |
| Sector: Financials | |
| SubSector: Mortgage Investment | |
| MarketCap: 358.039 Millions | |
| Recent Price: 8.57 Smart Investing & Trading Score: 28 | |
| Day Percent Change: -1.21% Day Change: -0.11 | |
| Week Change: -0.98% Year-to-date Change: -16.3% | |
| RC Links: Profile News Message Board | |
| Charts:- Daily , Weekly | |
| Add RC to Watchlist: View: Get Complete RC Trend Analysis ➞ | |
 | RXO RXO, Inc. |
| Sector: Industrials | |
| SubSector: Trucking | |
| MarketCap: 2550 Millions | |
| Recent Price: 20.47 Smart Investing & Trading Score: 57 | |
| Day Percent Change: -1.21% Day Change: -0.25 | |
| Week Change: 0.91% Year-to-date Change: -12.4% | |
| RXO Links: Profile News Message Board | |
| Charts:- Daily , Weekly | |
| Add RXO to Watchlist: View: Get Complete RXO Trend Analysis ➞ | |
 | IPI Intrepid Potash, Inc. |
| Sector: Materials | |
| SubSector: Agricultural Chemicals | |
| MarketCap: 160.329 Millions | |
| Recent Price: 21.07 Smart Investing & Trading Score: 62 | |
| Day Percent Change: -1.22% Day Change: -0.26 | |
| Week Change: 1.4% Year-to-date Change: -11.8% | |
| IPI Links: Profile News Message Board | |
| Charts:- Daily , Weekly | |
| Add IPI to Watchlist: View: Get Complete IPI Trend Analysis ➞ | |
 | RMNI Rimini Street, Inc. |
| Sector: Technology | |
| SubSector: Application Software | |
| MarketCap: 288.762 Millions | |
| Recent Price: 2.43 Smart Investing & Trading Score: 10 | |
| Day Percent Change: -1.22% Day Change: -0.03 | |
| Week Change: -4.71% Year-to-date Change: -25.7% | |
| RMNI Links: Profile News Message Board | |
| Charts:- Daily , Weekly | |
| Add RMNI to Watchlist: View: Get Complete RMNI Trend Analysis ➞ | |
| Too many stocks? View smallcap stocks filtered by marketcap & sector |
| Marketcap: All SmallCap Stocks (default-no microcap), Large, Mid-Range, Small & MicroCap |
| Sector: Tech, Finance, Energy, Staples, Retail, Industrial, Materials, Utilities & Medical |
|
Best Stocks Today 12Stocks.com |
© 2024 12Stocks.com Terms & Conditions Privacy Contact Us
All Information Provided Only For Education And Not To Be Used For Investing or Trading. See Terms & Conditions


One More Thing ... Get Best Stocks Delivered Daily!
Never Ever Miss A Move With Our Top Ten Stocks Lists
Find Best Stocks In Any Market - Bull or Bear Market
Take A Peek At Our Top Ten Stocks Lists: Daily, Weekly, Year-to-Date & Top Trends
Find Best Stocks In Any Market - Bull or Bear Market
Take A Peek At Our Top Ten Stocks Lists: Daily, Weekly, Year-to-Date & Top Trends
Smallcap Stocks With Best Up Trends [0-bearish to 100-bullish]: Innodata [100], Cricut [100], DASAN Zhone[100], Latham Group[100], Hyster-Yale Materials[100], Ameresco [100], Myriad Genetics[100], Alpha and[100], Vigil Neuroscience[100], Hannon Armstrong[100], Ardmore Shipping[100]
Best Smallcap Stocks Year-to-Date:
CareMax [584.54%], Janux [415.31%], Viking [329.39%], Bakkt [294.17%], Longboard [255.16%], Alpine Immune[239.81%], Vera [190.31%], Super Micro[189.4%], Avidity Biosciences[188.27%], Cullinan Oncology[171.9%], Arcutis Bio[147.06%] Best Smallcap Stocks This Week:
DASAN Zhone[64.32%], Innodata [55.8%], Perficient [52.88%], Cricut [42.06%], Vigil Neuroscience[38.97%], Thoughtworks Holding[36.44%], Latham Group[35.53%], Great Lakes[32.04%], Outset Medical[31.95%], Bakkt [31.59%], P3 Health[27.95%] Best Smallcap Stocks Daily:
Innodata [55.34%], Cricut [47.20%], DASAN Zhone[30.11%], Latham Group[23.75%], Hyster-Yale Materials[23.55%], Ameresco [21.13%], Myriad Genetics[21.08%], iRobot [21.06%], Alpha and[20.87%], Bakkt [20.58%], Vigil Neuroscience[18.50%]