
 Login Sign Up


| |||||
 |  | ||||

| 12Stocks.com Market Intelligence |
Best SmallCap Stocks
|
| In a hurry? Small Cap Stock Lists: Performance Trends Table, Stock Charts
Sort Small Cap stocks: Daily, Weekly, Year-to-Date, Market Cap & Trends. Filter Small Cap stocks list by sector: Show all, Tech, Finance, Energy, Staples, Retail, Industrial, Materials, Utilities and HealthCare Filter Small Cap stocks list by size: All Large Medium Small and MicroCap |
| 12Stocks.com Small Cap Stocks Performances & Trends Daily | |||||||||
|
|  The overall Smart Investing & Trading Score is 70 (0-bearish to 100-bullish) which puts Small Cap index in short term neutral to bullish trend. The Smart Investing & Trading Score from previous trading session is 87 and hence a deterioration of trend.
| ||||||||
Here are the Smart Investing & Trading Scores of the most requested small cap stocks at 12Stocks.com (click stock name for detailed review):
|


| 12Stocks.com: Investing in Smallcap Index with Stocks | |
|
The following table helps investors and traders sort through current performance and trends (as measured by Smart Investing & Trading Score) of various
stocks in the Smallcap Index. Quick View: Move mouse or cursor over stock symbol (ticker) to view short-term technical chart and over stock name to view long term chart. Click on  to add stock symbol to your watchlist and to add stock symbol to your watchlist and  to view watchlist. Click on any ticker or stock name for detailed market intelligence report for that stock. to view watchlist. Click on any ticker or stock name for detailed market intelligence report for that stock. |
12Stocks.com Performance of Stocks in Smallcap Index
| Ticker | Stock Name | Watchlist | Category | Recent Price | Smart Investing & Trading Score | Change % | YTD Change% |
| CRCT | Cricut |   | Technology | 7.47 | 80 | 35.17 | 11.99% |
| VERI | Veritone | | Technology | 4.17 | 75 | 25.41 | 129.12% |
| AMRC | Ameresco | | Services & Goods | 27.18 | 95 | 22.19 | -14.19% |
| PWSC | PowerSchool | | Technology | 20.17 | 34 | 21.21 | -14.68% |
| AOSL | Alpha and | | Technology | 26.73 | 100 | 19.97 | 2.57% |
| MYGN | Myriad Genetics | | Services & Goods | 23.59 | 100 | 19.26 | 23.25% |
| SWIM | Latham Group | | Industrials | 3.56 | 44 | 19.06 | 34.85% |
| HY | Hyster-Yale Materials | | Consumer Staples | 69.70 | 100 | 18.10 | 12.08% |
| DNLI | Denali | | Health Care | 19.41 | 74 | 15.16 | -9.55% |
| ADPT | Adaptive Bio | | Health Care | 3.55 | 64 | 14.15 | -27.55% |
| PCRX | Pacira BioSciences | | Health Care | 30.05 | 100 | 13.33 | -10.95% |
| BRP | BRP Group | | Financials | 31.71 | 77 | 13.21 | 32.01% |
| HASI | Hannon Armstrong | | Financials | 29.37 | 100 | 12.14 | 6.49% |
| OFIX | Orthofix Medical | | Health Care | 15.50 | 100 | 11.59 | 14.99% |
| DZSI | DASAN Zhone | | Technology | 1.50 | 74 | 11.52 | -23.86% |
| VIGL | Vigil Neuroscience | | Health Care | 3.53 | 74 | 10.66 | 2.92% |
| OPFI | OppFi | | Financials | 2.98 | 34 | 10.56 | -41.59% |
| INGN | Inogen | | Health Care | 8.04 | 100 | 10.14 | 46.45% |
| ASC | Ardmore Shipping | | Transports | 19.33 | 100 | 9.83 | 37.19% |
| IRBT | iRobot | | Consumer Staples | 9.90 | 74 | 9.76 | -74.42% |
| MRNS | Marinus | | Health Care | 1.72 | 64 | 9.55 | -84.18% |
| WWW | Wolverine World | | Consumer Staples | 12.51 | 100 | 9.54 | 40.72% |
| ARIS | Aris Water | | Utilities | 17.06 | 95 | 9.36 | 103.34% |
| SHEN | Shenandoah Tele | | Technology | 16.28 | 64 | 9.26 | -24.70% |
| LGND | Ligand | | Health Care | 79.80 | 87 | 8.99 | 11.73% |


| Too many stocks? View smallcap stocks filtered by marketcap & sector |
| Marketcap: All SmallCap Stocks (default-no microcap), Large, Mid-Range, Small |
| Smallcap Sector: Tech, Finance, Energy, Staples, Retail, Industrial, Materials, & Medical |
|
Get the most comprehensive stock market coverage daily at 12Stocks.com ➞ Best Stocks Today ➞ Best Stocks Weekly ➞ Best Stocks Year-to-Date ➞ Best Stocks Trends ➞  Best Stocks Today 12Stocks.com Best Nasdaq Stocks ➞ Best S&P 500 Stocks ➞ Best Tech Stocks ➞ Best Biotech Stocks ➞ |
| Detailed Overview of SmallCap Stocks |
| SmallCap Technical Overview, Leaders & Laggards, Top SmallCap ETF Funds & Detailed SmallCap Stocks List, Charts, Trends & More |
| Smallcap: Technical Analysis, Trends & YTD Performance | |
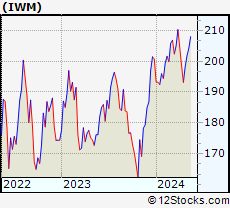
| SmallCap segment as represented by
IWM, an exchange-traded fund [ETF], holds basket of thousands of smallcap stocks from across all major sectors of the US stock market. The smallcap index (contains stocks like Riverbed & Sotheby's) is up by 1.47% and is currently underperforming the overall market by -6.62% year-to-date. Below is a quick view of technical charts and trends: | |
 IWM Weekly Chart |
|
| Long Term Trend: Deteriorating | |
| Medium Term Trend: Very Good | |
 IWM Daily Chart |
|
| Short Term Trend: Good | |
| Overall Trend Score: 70 | |
| YTD Performance: 1.47% | |
| **Trend Scores & Views Are Only For Educational Purposes And Not For Investing | |
| 12Stocks.com: Top Performing Small Cap Index Stocks | ||||||||||||||||||||||||||||||||||||||||||||||||
 The top performing Small Cap Index stocks year to date are
Now, more recently, over last week, the top performing Small Cap Index stocks on the move are


|
||||||||||||||||||||||||||||||||||||||||||||||||
| 12Stocks.com: Investing in Smallcap Index using Exchange Traded Funds | |
|
The following table shows list of key exchange traded funds (ETF) that
help investors track Smallcap index. The following list also includes leveraged ETF funds that track twice or thrice the daily returns of Smallcap indices. Short or inverse ETF funds move in the opposite direction to the index they track and are useful during market pullbacks or during bear markets. Quick View: Move mouse or cursor over ETF symbol (ticker) to view short-term technical chart and over ETF name to view long term chart. Click on ticker or stock name for detailed view. Click on to add stock symbol to your watchlist and to view watchlist. |
12Stocks.com List of ETFs that track Smallcap Index
| Ticker | ETF Name | Watchlist | Recent Price | Smart Investing & Trading Score | Change % | Week % | Year-to-date % |
| IWM | iShares Russell 2000 | | 203.67 | 70 | -0.63 | 0.88 | 1.47% |
| IJR | iShares Core S&P Small-Cap | | 107.77 | 58 | -0.79 | 0.59 | -0.45% |
| VTWO | Vanguard Russell 2000 ETF | | 82.27 | 57 | -0.69 | 0.81 | 1.44% |
| IWN | iShares Russell 2000 Value | | 154.59 | 76 | -0.67 | 0.24 | -0.48% |
| IWO | iShares Russell 2000 Growth | | 260.15 | 57 | -0.82 | 1.28 | 3.15% |
| IJS | iShares S&P Small-Cap 600 Value | | 99.06 | 40 | -0.62 | 0.34 | -3.89% |
| IJT | iShares S&P Small-Cap 600 Growth | | 128.54 | 71 | -1.00 | 0.61 | 2.72% |
| XSLV | PowerShares S&P SmallCap Low Volatil ETF | | 43.77 | 95 | -0.52 | 1.27 | -0.86% |
| SDD | ProShares UltraShort SmallCap600 | | 18.66 | 17 | 2.43 | -0.98 | 1.27% |
| SMLV | SPDR SSGA US Small Cap Low Volatil ETF | | 109.87 | 93 | -0.55 | 0.17 | -2.36% |
| SBB | ProShares Short SmallCap600 | | 16.11 | 7 | 0.91 | -0.28 | 1.16% |
| SAA | ProShares Ultra SmallCap600 | | 24.21 | 88 | -0.75 | 2.62 | -2.98% |
| 12Stocks.com: Charts, Trends, Fundamental Data and Performances of SmallCap Stocks | |
|
We now take in-depth look at all SmallCap stocks including charts, multi-period performances and overall trends (as measured by Smart Investing & Trading Score). One can sort SmallCap stocks (click link to choose) by Daily, Weekly and by Year-to-Date performances. Also, one can sort by size of the company or by market capitalization. |
| Select Your Default Chart Type: | |||||
| |||||
| Click on stock symbol or name for detailed view. Click on to add stock symbol to your watchlist and to view watchlist. Quick View: Move mouse or cursor over "Daily" to quickly view daily technical stock chart and over "Weekly" to view weekly technical stock chart. | |||||

 | CRCT Cricut, Inc. |
| Sector: Technology | |
| SubSector: Computer Hardware | |
| MarketCap: 2920 Millions | |
| Recent Price: 7.47 Smart Investing & Trading Score: 80 | |
| Day Percent Change: 35.17% Day Change: 1.94 | |
| Week Change: 30.45% Year-to-date Change: 12.0% | |
| CRCT Links: Profile News Message Board | |
| Charts:- Daily , Weekly | |
| Add CRCT to Watchlist: View: Get Complete CRCT Trend Analysis ➞ | |
 | VERI Veritone, Inc. |
| Sector: Technology | |
| SubSector: Application Software | |
| MarketCap: 52.1662 Millions | |
| Recent Price: 4.17 Smart Investing & Trading Score: 75 | |
| Day Percent Change: 25.41% Day Change: 0.84 | |
| Week Change: 24.11% Year-to-date Change: 129.1% | |
| VERI Links: Profile News Message Board | |
| Charts:- Daily , Weekly | |
| Add VERI to Watchlist: View: Get Complete VERI Trend Analysis ➞ | |
 | AMRC Ameresco, Inc. |
| Sector: Services & Goods | |
| SubSector: Technical Services | |
| MarketCap: 898.91 Millions | |
| Recent Price: 27.18 Smart Investing & Trading Score: 95 | |
| Day Percent Change: 22.19% Day Change: 4.94 | |
| Week Change: 21.26% Year-to-date Change: -14.2% | |
| AMRC Links: Profile News Message Board | |
| Charts:- Daily , Weekly | |
| Add AMRC to Watchlist: View: Get Complete AMRC Trend Analysis ➞ | |
 | PWSC PowerSchool Holdings, Inc. |
| Sector: Technology | |
| SubSector: Software - Application | |
| MarketCap: 3870 Millions | |
| Recent Price: 20.17 Smart Investing & Trading Score: 34 | |
| Day Percent Change: 21.21% Day Change: 3.53 | |
| Week Change: 21.47% Year-to-date Change: -14.7% | |
| PWSC Links: Profile News Message Board | |
| Charts:- Daily , Weekly | |
| Add PWSC to Watchlist: View: Get Complete PWSC Trend Analysis ➞ | |
 | AOSL Alpha and Omega Semiconductor Limited |
| Sector: Technology | |
| SubSector: Semiconductor - Specialized | |
| MarketCap: 158.66 Millions | |
| Recent Price: 26.73 Smart Investing & Trading Score: 100 | |
| Day Percent Change: 19.97% Day Change: 4.45 | |
| Week Change: 19.54% Year-to-date Change: 2.6% | |
| AOSL Links: Profile News Message Board | |
| Charts:- Daily , Weekly | |
| Add AOSL to Watchlist: View: Get Complete AOSL Trend Analysis ➞ | |
 | MYGN Myriad Genetics, Inc. |
| Sector: Services & Goods | |
| SubSector: Research Services | |
| MarketCap: 1051.94 Millions | |
| Recent Price: 23.59 Smart Investing & Trading Score: 100 | |
| Day Percent Change: 19.26% Day Change: 3.81 | |
| Week Change: 21.16% Year-to-date Change: 23.3% | |
| MYGN Links: Profile News Message Board | |
| Charts:- Daily , Weekly | |
| Add MYGN to Watchlist: View: Get Complete MYGN Trend Analysis ➞ | |
 | SWIM Latham Group, Inc. |
| Sector: Industrials | |
| SubSector: Building Products & Equipment | |
| MarketCap: 388 Millions | |
| Recent Price: 3.56 Smart Investing & Trading Score: 44 | |
| Day Percent Change: 19.06% Day Change: 0.57 | |
| Week Change: 30.4% Year-to-date Change: 34.9% | |
| SWIM Links: Profile News Message Board | |
| Charts:- Daily , Weekly | |
| Add SWIM to Watchlist: View: Get Complete SWIM Trend Analysis ➞ | |
 | HY Hyster-Yale Materials Handling, Inc. |
| Sector: Consumer Staples | |
| SubSector: Trucks & Other Vehicles | |
| MarketCap: 660 Millions | |
| Recent Price: 69.70 Smart Investing & Trading Score: 100 | |
| Day Percent Change: 18.10% Day Change: 10.68 | |
| Week Change: 18.54% Year-to-date Change: 12.1% | |
| HY Links: Profile News Message Board | |
| Charts:- Daily , Weekly | |
| Add HY to Watchlist: View: Get Complete HY Trend Analysis ➞ | |
 | DNLI Denali Therapeutics Inc. |
| Sector: Health Care | |
| SubSector: Biotechnology | |
| MarketCap: 2020.05 Millions | |
| Recent Price: 19.41 Smart Investing & Trading Score: 74 | |
| Day Percent Change: 15.16% Day Change: 2.55 | |
| Week Change: 13.24% Year-to-date Change: -9.6% | |
| DNLI Links: Profile News Message Board | |
| Charts:- Daily , Weekly | |
| Add DNLI to Watchlist: View: Get Complete DNLI Trend Analysis ➞ | |
 | ADPT Adaptive Biotechnologies Corporation |
| Sector: Health Care | |
| SubSector: Biotechnology | |
| MarketCap: 3525.75 Millions | |
| Recent Price: 3.55 Smart Investing & Trading Score: 64 | |
| Day Percent Change: 14.15% Day Change: 0.44 | |
| Week Change: 17.94% Year-to-date Change: -27.6% | |
| ADPT Links: Profile News Message Board | |
| Charts:- Daily , Weekly | |
| Add ADPT to Watchlist: View: Get Complete ADPT Trend Analysis ➞ | |
 | PCRX Pacira BioSciences, Inc. |
| Sector: Health Care | |
| SubSector: Drugs - Generic | |
| MarketCap: 1403.95 Millions | |
| Recent Price: 30.05 Smart Investing & Trading Score: 100 | |
| Day Percent Change: 13.33% Day Change: 3.54 | |
| Week Change: 10.42% Year-to-date Change: -11.0% | |
| PCRX Links: Profile News Message Board | |
| Charts:- Daily , Weekly | |
| Add PCRX to Watchlist: View: Get Complete PCRX Trend Analysis ➞ | |
 | BRP BRP Group, Inc. |
| Sector: Financials | |
| SubSector: Real Estate Development | |
| MarketCap: 741.219 Millions | |
| Recent Price: 31.71 Smart Investing & Trading Score: 77 | |
| Day Percent Change: 13.21% Day Change: 3.70 | |
| Week Change: 15.14% Year-to-date Change: 32.0% | |
| BRP Links: Profile News Message Board | |
| Charts:- Daily , Weekly | |
| Add BRP to Watchlist: View: Get Complete BRP Trend Analysis ➞ | |
 | HASI Hannon Armstrong Sustainable Infrastructure Capital, Inc. |
| Sector: Financials | |
| SubSector: REIT - Diversified | |
| MarketCap: 1405.93 Millions | |
| Recent Price: 29.37 Smart Investing & Trading Score: 100 | |
| Day Percent Change: 12.14% Day Change: 3.18 | |
| Week Change: 13.05% Year-to-date Change: 6.5% | |
| HASI Links: Profile News Message Board | |
| Charts:- Daily , Weekly | |
| Add HASI to Watchlist: View: Get Complete HASI Trend Analysis ➞ | |
 | OFIX Orthofix Medical Inc. |
| Sector: Health Care | |
| SubSector: Medical Appliances & Equipment | |
| MarketCap: 508.18 Millions | |
| Recent Price: 15.50 Smart Investing & Trading Score: 100 | |
| Day Percent Change: 11.59% Day Change: 1.61 | |
| Week Change: 13.97% Year-to-date Change: 15.0% | |
| OFIX Links: Profile News Message Board | |
| Charts:- Daily , Weekly | |
| Add OFIX to Watchlist: View: Get Complete OFIX Trend Analysis ➞ | |
 | DZSI DASAN Zhone Solutions, Inc. |
| Sector: Technology | |
| SubSector: Communication Equipment | |
| MarketCap: 90.0539 Millions | |
| Recent Price: 1.50 Smart Investing & Trading Score: 74 | |
| Day Percent Change: 11.52% Day Change: 0.16 | |
| Week Change: 40.85% Year-to-date Change: -23.9% | |
| DZSI Links: Profile News Message Board | |
| Charts:- Daily , Weekly | |
| Add DZSI to Watchlist: View: Get Complete DZSI Trend Analysis ➞ | |
 | VIGL Vigil Neuroscience, Inc. |
| Sector: Health Care | |
| SubSector: Biotechnology | |
| MarketCap: 339 Millions | |
| Recent Price: 3.53 Smart Investing & Trading Score: 74 | |
| Day Percent Change: 10.66% Day Change: 0.34 | |
| Week Change: 29.78% Year-to-date Change: 2.9% | |
| VIGL Links: Profile News Message Board | |
| Charts:- Daily , Weekly | |
| Add VIGL to Watchlist: View: Get Complete VIGL Trend Analysis ➞ | |
 | OPFI OppFi Inc. |
| Sector: Financials | |
| SubSector: Credit Services | |
| MarketCap: 226 Millions | |
| Recent Price: 2.98 Smart Investing & Trading Score: 34 | |
| Day Percent Change: 10.56% Day Change: 0.28 | |
| Week Change: 8.55% Year-to-date Change: -41.6% | |
| OPFI Links: Profile News Message Board | |
| Charts:- Daily , Weekly | |
| Add OPFI to Watchlist: View: Get Complete OPFI Trend Analysis ➞ | |
 | INGN Inogen, Inc. |
| Sector: Health Care | |
| SubSector: Medical Instruments & Supplies | |
| MarketCap: 8803.6 Millions | |
| Recent Price: 8.04 Smart Investing & Trading Score: 100 | |
| Day Percent Change: 10.14% Day Change: 0.74 | |
| Week Change: 12.45% Year-to-date Change: 46.5% | |
| INGN Links: Profile News Message Board | |
| Charts:- Daily , Weekly | |
| Add INGN to Watchlist: View: Get Complete INGN Trend Analysis ➞ | |
 | ASC Ardmore Shipping Corporation |
| Sector: Transports | |
| SubSector: Shipping | |
| MarketCap: 147.014 Millions | |
| Recent Price: 19.33 Smart Investing & Trading Score: 100 | |
| Day Percent Change: 9.83% Day Change: 1.73 | |
| Week Change: 10.96% Year-to-date Change: 37.2% | |
| ASC Links: Profile News Message Board | |
| Charts:- Daily , Weekly | |
| Add ASC to Watchlist: View: Get Complete ASC Trend Analysis ➞ | |
 | IRBT iRobot Corporation |
| Sector: Consumer Staples | |
| SubSector: Appliances | |
| MarketCap: 1193.38 Millions | |
| Recent Price: 9.90 Smart Investing & Trading Score: 74 | |
| Day Percent Change: 9.76% Day Change: 0.88 | |
| Week Change: 4.98% Year-to-date Change: -74.4% | |
| IRBT Links: Profile News Message Board | |
| Charts:- Daily , Weekly | |
| Add IRBT to Watchlist: View: Get Complete IRBT Trend Analysis ➞ | |
 | MRNS Marinus Pharmaceuticals, Inc. |
| Sector: Health Care | |
| SubSector: Biotechnology | |
| MarketCap: 222.885 Millions | |
| Recent Price: 1.72 Smart Investing & Trading Score: 64 | |
| Day Percent Change: 9.55% Day Change: 0.15 | |
| Week Change: 13.91% Year-to-date Change: -84.2% | |
| MRNS Links: Profile News Message Board | |
| Charts:- Daily , Weekly | |
| Add MRNS to Watchlist: View: Get Complete MRNS Trend Analysis ➞ | |
 | WWW Wolverine World Wide, Inc. |
| Sector: Consumer Staples | |
| SubSector: Textile - Apparel Footwear & Accessories | |
| MarketCap: 1390.7 Millions | |
| Recent Price: 12.51 Smart Investing & Trading Score: 100 | |
| Day Percent Change: 9.54% Day Change: 1.09 | |
| Week Change: 16.37% Year-to-date Change: 40.7% | |
| WWW Links: Profile News Message Board | |
| Charts:- Daily , Weekly | |
| Add WWW to Watchlist: View: Get Complete WWW Trend Analysis ➞ | |
 | ARIS Aris Water Solutions, Inc. |
| Sector: Utilities | |
| SubSector: Utilities - Regulated Water | |
| MarketCap: 575 Millions | |
| Recent Price: 17.06 Smart Investing & Trading Score: 95 | |
| Day Percent Change: 9.36% Day Change: 1.46 | |
| Week Change: 16.53% Year-to-date Change: 103.3% | |
| ARIS Links: Profile News Message Board | |
| Charts:- Daily , Weekly | |
| Add ARIS to Watchlist: View: Get Complete ARIS Trend Analysis ➞ | |
 | SHEN Shenandoah Telecommunications Company |
| Sector: Technology | |
| SubSector: Telecom Services - Domestic | |
| MarketCap: 2329.67 Millions | |
| Recent Price: 16.28 Smart Investing & Trading Score: 64 | |
| Day Percent Change: 9.26% Day Change: 1.38 | |
| Week Change: 20.86% Year-to-date Change: -24.7% | |
| SHEN Links: Profile News Message Board | |
| Charts:- Daily , Weekly | |
| Add SHEN to Watchlist: View: Get Complete SHEN Trend Analysis ➞ | |
 | LGND Ligand Pharmaceuticals Incorporated |
| Sector: Health Care | |
| SubSector: Biotechnology | |
| MarketCap: 1344.45 Millions | |
| Recent Price: 79.80 Smart Investing & Trading Score: 87 | |
| Day Percent Change: 8.99% Day Change: 6.58 | |
| Week Change: 7.98% Year-to-date Change: 11.7% | |
| LGND Links: Profile News Message Board | |
| Charts:- Daily , Weekly | |
| Add LGND to Watchlist: View: Get Complete LGND Trend Analysis ➞ | |
| Too many stocks? View smallcap stocks filtered by marketcap & sector |
| Marketcap: All SmallCap Stocks (default-no microcap), Large, Mid-Range, Small & MicroCap |
| Sector: Tech, Finance, Energy, Staples, Retail, Industrial, Materials, Utilities & Medical |
|
Best Stocks Today 12Stocks.com |
© 2024 12Stocks.com Terms & Conditions Privacy Contact Us
All Information Provided Only For Education And Not To Be Used For Investing or Trading. See Terms & Conditions


One More Thing ... Get Best Stocks Delivered Daily!
Never Ever Miss A Move With Our Top Ten Stocks Lists
Find Best Stocks In Any Market - Bull or Bear Market
Take A Peek At Our Top Ten Stocks Lists: Daily, Weekly, Year-to-Date & Top Trends
Find Best Stocks In Any Market - Bull or Bear Market
Take A Peek At Our Top Ten Stocks Lists: Daily, Weekly, Year-to-Date & Top Trends
Smallcap Stocks With Best Up Trends [0-bearish to 100-bullish]: Alpha and[100], Myriad Genetics[100], Hyster-Yale Materials[100], Pacira BioSciences[100], Hannon Armstrong[100], Orthofix Medical[100], Inogen [100], Ardmore Shipping[100], Wolverine World[100], Emergent BioSolutions[100], Payoneer Global[100]
Best Smallcap Stocks Year-to-Date:
Janux [384.97%], Viking [319.59%], Bakkt [255.16%], Longboard [254.83%], Alpine Immune[239.47%], Super Micro[193.67%], Vera [189.15%], Avidity Biosciences[185.95%], Cullinan Oncology[179.94%], Arcutis Bio[146.28%], Sana [135.19%] Best Smallcap Stocks This Week:
Perficient [52.68%], DASAN Zhone[40.85%], Innodata [37.95%], Thoughtworks Holding[37.33%], Design [32.5%], Cricut [30.45%], Latham Group[30.4%], Great Lakes[30.24%], Vigil Neuroscience[29.78%], Sterling Construction[25.77%], Outset Medical[25.72%] Best Smallcap Stocks Daily:
Innodata [37.54%], Cricut [35.17%], Veritone [25.41%], Ameresco [22.19%], PowerSchool [21.21%], Alpha and[19.97%], Myriad Genetics[19.26%], Latham Group[19.06%], Hyster-Yale Materials[18.10%], Denali [15.16%], Adaptive Bio[14.15%]