
 Login Sign Up


| |||||
 |  | ||||

| 12Stocks.com Market Intelligence |
Best S&P 500 Stocks
|
On this page, you will find the most comprehensive analysis of S&P 500 stocks and ETFs - from latest trends to performances to charts ➞. First, here are the year-to-date (YTD) performances of the most requested S&P 500 stocks at 12Stocks.com (click stock for review):
| NVIDIA 77% | ||
| Google 23% | ||
| Merck 20% | ||
| Amazon.com 18% | ||
| Caterpillar 16% | ||
| Walmart 14% | ||
| JPMorgan Chase 14% | ||
| Chevron 11% | ||
| Goldman Sachs 11% | ||
| Microsoft 8% | ||
| Johnson & Johnson -7% | ||
| McDonald s -8% | ||
| Starbucks -8% | ||
| Apple -12% | ||
| Gilead -19% | ||
| Boeing -36% | ||
| Intel -37% | ||
| Quick: S&P 500 Stocks Lists: Performances & Trends, S&P 500 Stock Charts
Sort S&P 500 stocks: Daily, Weekly, Year-to-Date, Market Cap & Trends. Filter S&P 500 stocks list by sector: Show all, Tech, Finance, Energy, Staples, Retail, Industrial, Materials, Utilities and HealthCare |
| 12Stocks.com S&P 500 Stocks Performances & Trends Daily Report | |||||||||
|
| 
The overall Smart Investing & Trading Score is 63 (0-bearish to 100-bullish) which puts S&P 500 index in short term neutral to bullish trend. The Smart Investing & Trading Score from previous trading session is 44 and hence an improvement of trend. | ||||||||
Here are the Smart Investing & Trading Scores of the most requested S&P 500 stocks at 12Stocks.com (click stock name for detailed review):
|


| 12Stocks.com: Top Performing S&P 500 Index Stocks | ||||||||||||||||||||||||||||||||||||||||||||||||
 The top performing S&P 500 Index stocks year to date are
Now, more recently, over last week, the top performing S&P 500 Index stocks on the move are


|
||||||||||||||||||||||||||||||||||||||||||||||||
| 12Stocks.com: Investing in S&P 500 Index with Stocks | |
|
The following table helps investors and traders sort through current performance and trends (as measured by Smart Investing & Trading Score) of various
stocks in the S&P 500 Index. Quick View: Move mouse or cursor over stock symbol (ticker) to view short-term technical chart and over stock name to view long term chart. Click on  to add stock symbol to your watchlist and to add stock symbol to your watchlist and  to view watchlist. Click on any ticker or stock name for detailed market intelligence report for that stock. to view watchlist. Click on any ticker or stock name for detailed market intelligence report for that stock. |
12Stocks.com Performance of Stocks in S&P 500 Index
| Ticker | Stock Name | Watchlist | Category | Recent Price | Smart Investing & Trading Score | Change % | YTD Change% |
| MCHP | Microchip |   | Technology | 93.60 | 100 | 1.51% | 3.79% |
| CPB | Campbell Soup | | Consumer Staples | 44.85 | 63 | -1.15% | 3.75% |
| FSLR | First Solar | | Technology | 178.73 | 76 | 2.12% | 3.74% |
| CDNS | Cadence Design | | Technology | 282.41 | 25 | 1.92% | 3.69% |
| QRVO | Qorvo | | Technology | 116.75 | 85 | 1.79% | 3.68% |
| LEN | Lennar | | Industrials | 154.29 | 51 | 0.98% | 3.52% |
| PTC | PTC | | Technology | 180.99 | 52 | 0.62% | 3.45% |
| NDAQ | Nasdaq | | Financials | 60.12 | 61 | -0.28% | 3.41% |
| TFC | Truist Financial | | Financials | 38.17 | 68 | 0.53% | 3.39% |
| PEP | PepsiCo | | Consumer Staples | 175.58 | 88 | -0.62% | 3.38% |
| LOW | Lowe s | | Services & Goods | 229.87 | 43 | -0.04% | 3.29% |
| K | Kellogg | | Consumer Staples | 57.73 | 63 | -1.23% | 3.26% |
| NEM | Newmont | | Materials | 42.73 | 100 | -1.57% | 3.24% |
| KHC | Kraft Heinz | | Consumer Staples | 38.16 | 93 | -0.55% | 3.19% |
| FTV | Fortive | | Technology | 75.97 | 7 | -0.31% | 3.18% |
| OTIS | Otis Worldwide | | Industrials | 92.31 | 26 | -1.04% | 3.17% |
| ABBV | AbbVie | | Health Care | 159.62 | 0 | -4.58% | 3.00% |
| GLW | Corning | | Technology | 31.33 | 27 | -0.06% | 2.89% |
| ROL | Rollins | | Services & Goods | 44.90 | 75 | 1.42% | 2.82% |
| CLX | Clorox | | Consumer Staples | 146.48 | 63 | -0.69% | 2.73% |
| TJX | TJX | | Services & Goods | 96.36 | 83 | -0.06% | 2.72% |
| NOC | Northrop Grumman | | Industrials | 480.45 | 95 | -1.56% | 2.63% |
| AIZ | Assurant | | Financials | 172.88 | 33 | -0.44% | 2.61% |
| PNW | Pinnacle West | | Utilities | 73.69 | 63 | -0.69% | 2.58% |
| ICE | Intercontinental Exchange | | Financials | 131.70 | 51 | -0.09% | 2.55% |
| For chart view version of above stock list: Chart View ➞ 0 - 25 , 25 - 50 , 50 - 75 , 75 - 100 , 100 - 125 , 125 - 150 , 150 - 175 , 175 - 200 , 200 - 225 , 225 - 250 , 250 - 275 , 275 - 300 , 300 - 325 , 325 - 350 , 350 - 375 , 375 - 400 , 400 - 425 , 425 - 450 , 450 - 475 , 475 - 500 | ||
 | Click To Change The Sort Order: By Market Cap or Company Size Performance: Year-to-date, Week and Day |  |
|
Get the most comprehensive stock market coverage daily at 12Stocks.com ➞ Best Stocks Today ➞ Best Stocks Weekly ➞ Best Stocks Year-to-Date ➞ Best Stocks Trends ➞  Best Stocks Today 12Stocks.com Best Nasdaq Stocks ➞ Best S&P 500 Stocks ➞ Best Tech Stocks ➞ Best Biotech Stocks ➞ |
| Detailed Overview of S&P 500 Stocks |
| S&P 500 Technical Overview, Leaders & Laggards, Top S&P 500 ETF Funds & Detailed S&P 500 Stocks List, Charts, Trends & More |
| S&P 500: Technical Analysis, Trends & YTD Performance | |
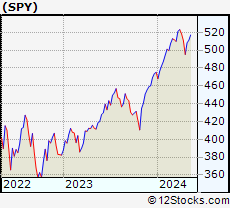
| S&P 500 index as represented by
SPY, an exchange-traded fund [ETF], holds basket of five hundred (mostly largecap) stocks from across all major sectors of the US stock market. The S&P 500 index (contains stocks like Apple and Exxon) is up by 6.93% and is currently outperforming the overall market by 0.79% year-to-date. Below is a quick view of technical charts and trends: | |
 SPY Weekly Chart |
|
| Long Term Trend: Good | |
| Medium Term Trend: Not Good | |
 SPY Daily Chart |
|
| Short Term Trend: Very Good | |
| Overall Trend Score: 63 | |
| YTD Performance: 6.93% | |
| **Trend Scores & Views Are Only For Educational Purposes And Not For Investing | |
| 12Stocks.com: Investing in S&P 500 Index using Exchange Traded Funds | |
|
The following table shows list of key exchange traded funds (ETF) that
help investors track S&P 500 index. The following list also includes leveraged ETF funds that track twice or thrice the daily returns of S&P 500 indices. Short or inverse ETF funds move in the opposite direction to the index they track and are useful during market pullbacks or during bear markets. Quick View: Move mouse or cursor over ETF symbol (ticker) to view short-term technical chart and over ETF name to view long term chart. Click on ticker or stock name for detailed view. Click on to add stock symbol to your watchlist and to view watchlist. |
12Stocks.com List of ETFs that track S&P 500 Index
| Ticker | ETF Name | Watchlist | Recent Price | Smart Investing & Trading Score | Change % | Week % | Year-to-date % |
| SPY | SPDR S&P 500 ETF | | 508.26 | 63 | 0.95 | 2.65 | 6.93% |
| IVV | iShares Core S&P 500 ETF | | 510.77 | 63 | 0.98 | 2.66 | 6.94% |
| VOO | Vanguard 500 ETF | | 467.21 | 63 | 1.00 | 2.66 | 6.96% |
| OEF | iShares S&P 100 | | 241.56 | 63 | 1.35 | 2.93 | 8.13% |
| SSO | ProShares Ultra S&P500 | | 72.71 | 63 | 1.95 | 5.21 | 11.74% |
| UPRO | ProShares UltraPro S&P500 | | 63.82 | 63 | 2.89 | 7.88 | 16.59% |
| SPXL | Direxion Daily S&P500 Bull 3X ETF | | 121.14 | 63 | 2.80 | 7.63 | 16.49% |
| SH | ProShares Short S&P500 | | 12.28 | 42 | -0.89 | -2.46 | -5.47% |
| SDS | ProShares UltraShort S&P500 | | 26.53 | 32 | -1.89 | -4.91 | -11.33% |
| SPXU | ProShares UltraPro Short S&P500 | | 35.50 | 42 | -2.79 | -7.38 | -17.44% |
| SPXS | Direxion Daily S&P 500 Bear 3X ETF | | 9.61 | 25 | -2.73 | -7.24 | -16.8% |
| 12Stocks.com: Charts, Trends, Fundamental Data and Performances of S&P 500 Stocks | |
|
We now take in-depth look at all S&P 500 stocks including charts, multi-period performances and overall trends (as measured by Smart Investing & Trading Score). One can sort S&P 500 stocks (click link to choose) by Daily, Weekly and by Year-to-Date performances. Also, one can sort by size of the company or by market capitalization. |
| Select Your Default Chart Type: | |||||
| |||||
| Click on stock symbol or name for detailed view. Click on to add stock symbol to your watchlist and to view watchlist. Quick View: Move mouse or cursor over "Daily" to quickly view daily technical stock chart and over "Weekly" to view weekly technical stock chart. | |||||

 | MCHP Microchip Technology Incorporated |
| Sector: Technology | |
| SubSector: Semiconductor - Broad Line | |
| MarketCap: 16826.3 Millions | |
| Recent Price: 93.60 Smart Investing & Trading Score: 100 | |
| Day Percent Change: 1.51% Day Change: 1.39 | |
| Week Change: 14.59% Year-to-date Change: 3.8% | |
| MCHP Links: Profile News Message Board | |
| Charts:- Daily , Weekly | |
| Add MCHP to Watchlist: View: Get MCHP Trend Analysis ➞ | |
 | CPB Campbell Soup Company |
| Sector: Consumer Staples | |
| SubSector: Processed & Packaged Goods | |
| MarketCap: 14468.8 Millions | |
| Recent Price: 44.85 Smart Investing & Trading Score: 63 | |
| Day Percent Change: -1.15% Day Change: -0.52 | |
| Week Change: 1.47% Year-to-date Change: 3.8% | |
| CPB Links: Profile News Message Board | |
| Charts:- Daily , Weekly | |
| Add CPB to Watchlist: View: Get CPB Trend Analysis ➞ | |
 | FSLR First Solar, Inc. |
| Sector: Technology | |
| SubSector: Semiconductor - Specialized | |
| MarketCap: 3617.9 Millions | |
| Recent Price: 178.73 Smart Investing & Trading Score: 76 | |
| Day Percent Change: 2.12% Day Change: 3.71 | |
| Week Change: 2.11% Year-to-date Change: 3.7% | |
| FSLR Links: Profile News Message Board | |
| Charts:- Daily , Weekly | |
| Add FSLR to Watchlist: View: Get FSLR Trend Analysis ➞ | |
 | CDNS Cadence Design Systems, Inc. |
| Sector: Technology | |
| SubSector: Application Software | |
| MarketCap: 16865.8 Millions | |
| Recent Price: 282.41 Smart Investing & Trading Score: 25 | |
| Day Percent Change: 1.92% Day Change: 5.33 | |
| Week Change: 0.77% Year-to-date Change: 3.7% | |
| CDNS Links: Profile News Message Board | |
| Charts:- Daily , Weekly | |
| Add CDNS to Watchlist: View: Get CDNS Trend Analysis ➞ | |
 | QRVO Qorvo, Inc. |
| Sector: Technology | |
| SubSector: Semiconductor - Broad Line | |
| MarketCap: 9524.32 Millions | |
| Recent Price: 116.75 Smart Investing & Trading Score: 85 | |
| Day Percent Change: 1.79% Day Change: 2.05 | |
| Week Change: 11.32% Year-to-date Change: 3.7% | |
| QRVO Links: Profile News Message Board | |
| Charts:- Daily , Weekly | |
| Add QRVO to Watchlist: View: Get QRVO Trend Analysis ➞ | |
 | LEN Lennar Corporation |
| Sector: Industrials | |
| SubSector: Residential Construction | |
| MarketCap: 11926.6 Millions | |
| Recent Price: 154.29 Smart Investing & Trading Score: 51 | |
| Day Percent Change: 0.98% Day Change: 1.50 | |
| Week Change: 2.73% Year-to-date Change: 3.5% | |
| LEN Links: Profile News Message Board | |
| Charts:- Daily , Weekly | |
| Add LEN to Watchlist: View: Get LEN Trend Analysis ➞ | |
 | PTC PTC Inc. |
| Sector: Technology | |
| SubSector: Technical & System Software | |
| MarketCap: 6166.7 Millions | |
| Recent Price: 180.99 Smart Investing & Trading Score: 52 | |
| Day Percent Change: 0.62% Day Change: 1.11 | |
| Week Change: 2.62% Year-to-date Change: 3.5% | |
| PTC Links: Profile News Message Board | |
| Charts:- Daily , Weekly | |
| Add PTC to Watchlist: View: Get PTC Trend Analysis ➞ | |
 | NDAQ Nasdaq, Inc. |
| Sector: Financials | |
| SubSector: Diversified Investments | |
| MarketCap: 14885.2 Millions | |
| Recent Price: 60.12 Smart Investing & Trading Score: 61 | |
| Day Percent Change: -0.28% Day Change: -0.17 | |
| Week Change: -0.38% Year-to-date Change: 3.4% | |
| NDAQ Links: Profile News Message Board | |
| Charts:- Daily , Weekly | |
| Add NDAQ to Watchlist: View: Get NDAQ Trend Analysis ➞ | |
 | TFC Truist Financial Corporation |
| Sector: Financials | |
| SubSector: Regional - Southeast Banks | |
| MarketCap: 44928.5 Millions | |
| Recent Price: 38.17 Smart Investing & Trading Score: 68 | |
| Day Percent Change: 0.53% Day Change: 0.20 | |
| Week Change: 3.72% Year-to-date Change: 3.4% | |
| TFC Links: Profile News Message Board | |
| Charts:- Daily , Weekly | |
| Add TFC to Watchlist: View: Get TFC Trend Analysis ➞ | |
 | PEP PepsiCo, Inc. |
| Sector: Consumer Staples | |
| SubSector: Beverages - Soft Drinks | |
| MarketCap: 162458 Millions | |
| Recent Price: 175.58 Smart Investing & Trading Score: 88 | |
| Day Percent Change: -0.62% Day Change: -1.10 | |
| Week Change: 0.83% Year-to-date Change: 3.4% | |
| PEP Links: Profile News Message Board | |
| Charts:- Daily , Weekly | |
| Add PEP to Watchlist: View: Get PEP Trend Analysis ➞ | |
 | LOW Lowe s Companies, Inc. |
| Sector: Services & Goods | |
| SubSector: Home Improvement Stores | |
| MarketCap: 56084.2 Millions | |
| Recent Price: 229.87 Smart Investing & Trading Score: 43 | |
| Day Percent Change: -0.04% Day Change: -0.09 | |
| Week Change: -0.16% Year-to-date Change: 3.3% | |
| LOW Links: Profile News Message Board | |
| Charts:- Daily , Weekly | |
| Add LOW to Watchlist: View: Get LOW Trend Analysis ➞ | |
 | K Kellogg Company |
| Sector: Consumer Staples | |
| SubSector: Processed & Packaged Goods | |
| MarketCap: 20264.6 Millions | |
| Recent Price: 57.73 Smart Investing & Trading Score: 63 | |
| Day Percent Change: -1.23% Day Change: -0.72 | |
| Week Change: 0.61% Year-to-date Change: 3.3% | |
| K Links: Profile News Message Board | |
| Charts:- Daily , Weekly | |
| Add K to Watchlist: View: Get K Trend Analysis ➞ | |
 | NEM Newmont Corporation |
| Sector: Materials | |
| SubSector: Gold | |
| MarketCap: 33928.8 Millions | |
| Recent Price: 42.73 Smart Investing & Trading Score: 100 | |
| Day Percent Change: -1.57% Day Change: -0.68 | |
| Week Change: 9.51% Year-to-date Change: 3.2% | |
| NEM Links: Profile News Message Board | |
| Charts:- Daily , Weekly | |
| Add NEM to Watchlist: View: Get NEM Trend Analysis ➞ | |
 | KHC The Kraft Heinz Company |
| Sector: Consumer Staples | |
| SubSector: Food - Major Diversified | |
| MarketCap: 32096.3 Millions | |
| Recent Price: 38.16 Smart Investing & Trading Score: 93 | |
| Day Percent Change: -0.55% Day Change: -0.21 | |
| Week Change: 1.01% Year-to-date Change: 3.2% | |
| KHC Links: Profile News Message Board | |
| Charts:- Daily , Weekly | |
| Add KHC to Watchlist: View: Get KHC Trend Analysis ➞ | |
 | FTV Fortive Corporation |
| Sector: Technology | |
| SubSector: Scientific & Technical Instruments | |
| MarketCap: 16351.9 Millions | |
| Recent Price: 75.97 Smart Investing & Trading Score: 7 | |
| Day Percent Change: -0.31% Day Change: -0.24 | |
| Week Change: -4.43% Year-to-date Change: 3.2% | |
| FTV Links: Profile News Message Board | |
| Charts:- Daily , Weekly | |
| Add FTV to Watchlist: View: Get FTV Trend Analysis ➞ | |
 | OTIS Otis Worldwide Corporation |
| Sector: Industrials | |
| SubSector: Specialty Industrial Machinery | |
| MarketCap: 27727 Millions | |
| Recent Price: 92.31 Smart Investing & Trading Score: 26 | |
| Day Percent Change: -1.04% Day Change: -0.97 | |
| Week Change: -3.62% Year-to-date Change: 3.2% | |
| OTIS Links: Profile News Message Board | |
| Charts:- Daily , Weekly | |
| Add OTIS to Watchlist: View: Get OTIS Trend Analysis ➞ | |
 | ABBV AbbVie Inc. |
| Sector: Health Care | |
| SubSector: Drug Manufacturers - Major | |
| MarketCap: 110080 Millions | |
| Recent Price: 159.62 Smart Investing & Trading Score: 0 | |
| Day Percent Change: -4.58% Day Change: -7.67 | |
| Week Change: -4.08% Year-to-date Change: 3.0% | |
| ABBV Links: Profile News Message Board | |
| Charts:- Daily , Weekly | |
| Add ABBV to Watchlist: View: Get ABBV Trend Analysis ➞ | |
 | GLW Corning Incorporated |
| Sector: Technology | |
| SubSector: Diversified Electronics | |
| MarketCap: 16287.6 Millions | |
| Recent Price: 31.33 Smart Investing & Trading Score: 27 | |
| Day Percent Change: -0.06% Day Change: -0.02 | |
| Week Change: 0.19% Year-to-date Change: 2.9% | |
| GLW Links: Profile News Message Board | |
| Charts:- Daily , Weekly | |
| Add GLW to Watchlist: View: Get GLW Trend Analysis ➞ | |
 | ROL Rollins, Inc. |
| Sector: Services & Goods | |
| SubSector: Business Services | |
| MarketCap: 12827.4 Millions | |
| Recent Price: 44.90 Smart Investing & Trading Score: 75 | |
| Day Percent Change: 1.42% Day Change: 0.63 | |
| Week Change: 5.62% Year-to-date Change: 2.8% | |
| ROL Links: Profile News Message Board | |
| Charts:- Daily , Weekly | |
| Add ROL to Watchlist: View: Get ROL Trend Analysis ➞ | |
 | CLX The Clorox Company |
| Sector: Consumer Staples | |
| SubSector: Housewares & Accessories | |
| MarketCap: 23688.3 Millions | |
| Recent Price: 146.48 Smart Investing & Trading Score: 63 | |
| Day Percent Change: -0.69% Day Change: -1.02 | |
| Week Change: 2.04% Year-to-date Change: 2.7% | |
| CLX Links: Profile News Message Board | |
| Charts:- Daily , Weekly | |
| Add CLX to Watchlist: View: Get CLX Trend Analysis ➞ | |
 | TJX The TJX Companies, Inc. |
| Sector: Services & Goods | |
| SubSector: Department Stores | |
| MarketCap: 50656.2 Millions | |
| Recent Price: 96.36 Smart Investing & Trading Score: 83 | |
| Day Percent Change: -0.06% Day Change: -0.06 | |
| Week Change: 3.21% Year-to-date Change: 2.7% | |
| TJX Links: Profile News Message Board | |
| Charts:- Daily , Weekly | |
| Add TJX to Watchlist: View: Get TJX Trend Analysis ➞ | |
 | NOC Northrop Grumman Corporation |
| Sector: Industrials | |
| SubSector: Aerospace/Defense - Major Diversified | |
| MarketCap: 52094.9 Millions | |
| Recent Price: 480.45 Smart Investing & Trading Score: 95 | |
| Day Percent Change: -1.56% Day Change: -7.61 | |
| Week Change: 3.86% Year-to-date Change: 2.6% | |
| NOC Links: Profile News Message Board | |
| Charts:- Daily , Weekly | |
| Add NOC to Watchlist: View: Get NOC Trend Analysis ➞ | |
 | AIZ Assurant, Inc. |
| Sector: Financials | |
| SubSector: Accident & Health Insurance | |
| MarketCap: 6110.3 Millions | |
| Recent Price: 172.88 Smart Investing & Trading Score: 33 | |
| Day Percent Change: -0.44% Day Change: -0.76 | |
| Week Change: -0.55% Year-to-date Change: 2.6% | |
| AIZ Links: Profile News Message Board | |
| Charts:- Daily , Weekly | |
| Add AIZ to Watchlist: View: Get AIZ Trend Analysis ➞ | |
 | PNW Pinnacle West Capital Corporation |
| Sector: Utilities | |
| SubSector: Electric Utilities | |
| MarketCap: 8240.24 Millions | |
| Recent Price: 73.69 Smart Investing & Trading Score: 63 | |
| Day Percent Change: -0.69% Day Change: -0.51 | |
| Week Change: -0.95% Year-to-date Change: 2.6% | |
| PNW Links: Profile News Message Board | |
| Charts:- Daily , Weekly | |
| Add PNW to Watchlist: View: Get PNW Trend Analysis ➞ | |
 | ICE Intercontinental Exchange, Inc. |
| Sector: Financials | |
| SubSector: Diversified Investments | |
| MarketCap: 46054.6 Millions | |
| Recent Price: 131.70 Smart Investing & Trading Score: 51 | |
| Day Percent Change: -0.09% Day Change: -0.12 | |
| Week Change: 0.37% Year-to-date Change: 2.6% | |
| ICE Links: Profile News Message Board | |
| Charts:- Daily , Weekly | |
| Add ICE to Watchlist: View: Get ICE Trend Analysis ➞ | |
| For tabular summary view of above stock list: Summary View ➞ 0 - 25 , 25 - 50 , 50 - 75 , 75 - 100 , 100 - 125 , 125 - 150 , 150 - 175 , 175 - 200 , 200 - 225 , 225 - 250 , 250 - 275 , 275 - 300 , 300 - 325 , 325 - 350 , 350 - 375 , 375 - 400 , 400 - 425 , 425 - 450 , 450 - 475 , 475 - 500 | ||
| Click To Change The Sort Order: By Market Cap or Company Size Performance: Year-to-date, Week and Day | |
| Select Chart Type: | ||
|
Best Stocks Today 12Stocks.com |
© 2024 12Stocks.com Terms & Conditions Privacy Contact Us
All Information Provided Only For Education And Not To Be Used For Investing or Trading. See Terms & Conditions


One More Thing ... Get Best Stocks Delivered Daily!
Never Ever Miss A Move With Our Top Ten Stocks Lists
Find Best Stocks In Any Market - Bull or Bear Market
Take A Peek At Our Top Ten Stocks Lists: Daily, Weekly, Year-to-Date & Top Trends
Find Best Stocks In Any Market - Bull or Bear Market
Take A Peek At Our Top Ten Stocks Lists: Daily, Weekly, Year-to-Date & Top Trends
S&P 500 Stocks With Best Up Trends [0-bearish to 100-bullish]: ResMed [100], Google [100], Google [100], KLA [100], Teradyne [100], Tractor Supply[100], Carrier Global[100], Chipotle Mexican[100], Analog Devices[100], Colgate-Palmolive [100], Goldman Sachs[100]
Best S&P 500 Stocks Year-to-Date:
NVIDIA [77.16%], Constellation [60.86%], NRG [40.83%], Chipotle Mexican[39.35%], Western Digital[36.26%], Eaton [34.66%], Micron [34.57%], Targa Resources[34.52%], Diamondback [33.97%], Marathon [33.72%], Progressive [30.61%] Best S&P 500 Stocks This Week:
ResMed [21.92%], Teradyne [18.92%], Hasbro [16.65%], NVIDIA [15.14%], Microchip [14.59%], Monolithic Power[14.49%], Tesla [14.44%], Tyler Technologies[14.23%], Wabtec [14%], Globe Life[13.5%], NXP Semiconductors[12.82%] Best S&P 500 Stocks Daily:
ResMed [18.89%], Google [10.22%], Google [9.97%], NVIDIA [6.18%], KLA [4.95%], Teradyne [4.79%], T. Rowe[4.77%], Mohawk Industries[4.70%], Broadcom [3.84%], Enphase [3.80%], L3Harris Technologies[3.46%]