
 Login Sign Up


| |||||
 |  | ||||

| 12Stocks.com Market Intelligence |
Best S&P 500 Stocks
|
On this page, you will find the most comprehensive analysis of S&P 500 stocks and ETFs - from latest trends to performances to charts ➞. First, here are the year-to-date (YTD) performances of the most requested S&P 500 stocks at 12Stocks.com (click stock for review):
| NVIDIA 65% | ||
| Merck 19% | ||
| Caterpillar 15% | ||
| Walmart 14% | ||
| JPMorgan Chase 13% | ||
| Amazon.com 13% | ||
| Google 11% | ||
| Chevron 10% | ||
| Goldman Sachs 8% | ||
| Microsoft 4% | ||
| Johnson & Johnson -6% | ||
| McDonald s -7% | ||
| Starbucks -8% | ||
| Apple -12% | ||
| Gilead -19% | ||
| Intel -31% | ||
| Boeing -38% | ||
| Quick: S&P 500 Stocks Lists: Performances & Trends, S&P 500 Stock Charts
Sort S&P 500 stocks: Daily, Weekly, Year-to-Date, Market Cap & Trends. Filter S&P 500 stocks list by sector: Show all, Tech, Finance, Energy, Staples, Retail, Industrial, Materials, Utilities and HealthCare |
| 12Stocks.com S&P 500 Stocks Performances & Trends Daily Report | |||||||||
|
| 
The overall Smart Investing & Trading Score is 44 (0-bearish to 100-bullish) which puts S&P 500 index in short term neutral trend. The Smart Investing & Trading Score from previous trading session is 58 and hence a deterioration of trend. | ||||||||
Here are the Smart Investing & Trading Scores of the most requested S&P 500 stocks at 12Stocks.com (click stock name for detailed review):
|


| 12Stocks.com: Top Performing S&P 500 Index Stocks | ||||||||||||||||||||||||||||||||||||||||||||||||
 The top performing S&P 500 Index stocks year to date are
Now, more recently, over last week, the top performing S&P 500 Index stocks on the move are


|
||||||||||||||||||||||||||||||||||||||||||||||||
| 12Stocks.com: Investing in S&P 500 Index with Stocks | |
|
The following table helps investors and traders sort through current performance and trends (as measured by Smart Investing & Trading Score) of various
stocks in the S&P 500 Index. Quick View: Move mouse or cursor over stock symbol (ticker) to view short-term technical chart and over stock name to view long term chart. Click on  to add stock symbol to your watchlist and to add stock symbol to your watchlist and  to view watchlist. Click on any ticker or stock name for detailed market intelligence report for that stock. to view watchlist. Click on any ticker or stock name for detailed market intelligence report for that stock. |
12Stocks.com Performance of Stocks in S&P 500 Index
| Ticker | Stock Name | Watchlist | Category | Recent Price | Smart Investing & Trading Score | Change % | YTD Change% |
| PM | Philip Morris |   | Consumer Staples | 96.03 | 95 | -3.01% | 2.08% |
| PAYX | Paychex | | Services & Goods | 121.53 | 65 | -0.81% | 2.03% |
| MOH | Molina Healthcare | | Health Care | 368.35 | 44 | 0.26% | 1.95% |
| CNP | CenterPoint | | Utilities | 29.12 | 93 | 0.17% | 1.93% |
| CSGP | CoStar | | Financials | 89.08 | 80 | -3.12% | 1.93% |
| ICE | Intercontinental Exchange | | Financials | 130.89 | 26 | -1.27% | 1.92% |
| SNPS | Synopsys | | Technology | 524.54 | 25 | -0.56% | 1.87% |
| DUK | Duke | | Utilities | 98.73 | 81 | -0.23% | 1.74% |
| TXN | Texas Instruments | | Technology | 173.41 | 100 | -0.80% | 1.73% |
| ATO | Atmos | | Utilities | 117.85 | 93 | -0.69% | 1.68% |
| CBOE | Cboe Global | | Financials | 181.47 | 49 | 1.00% | 1.63% |
| TMUS | T-Mobile US | | Technology | 162.89 | 100 | -0.79% | 1.60% |
| STX | Seagate | | Technology | 86.64 | 38 | -0.54% | 1.49% |
| AAL | American Airlines | | Transports | 13.94 | 22 | 0.14% | 1.46% |
| CME | CME | | Financials | 213.63 | 76 | 0.49% | 1.44% |
| LMT | Lockheed Martin | | Industrials | 459.76 | 86 | 0.13% | 1.44% |
| ROL | Rollins | | Services & Goods | 44.30 | 39 | 3.34% | 1.44% |
| JKHY | Jack Henry | | Technology | 165.69 | 41 | 0.30% | 1.40% |
| AVB | AvalonBay Communities | | Financials | 189.54 | 100 | -0.94% | 1.24% |
| TJX | TJX | | Services & Goods | 94.97 | 52 | -0.33% | 1.24% |
| NEM | Newmont | | Materials | 41.88 | 100 | 8.50% | 1.18% |
| FFIV | F5 Networks | | Technology | 181.05 | 32 | -0.71% | 1.16% |
| LEN | Lennar | | Industrials | 150.65 | 13 | -2.25% | 1.08% |
| CDNS | Cadence Design | | Technology | 275.18 | 10 | -0.89% | 1.03% |
| IQV | IQVIA Holdings | | Health Care | 233.70 | 53 | -2.96% | 1.00% |
| For chart view version of above stock list: Chart View ➞ 0 - 25 , 25 - 50 , 50 - 75 , 75 - 100 , 100 - 125 , 125 - 150 , 150 - 175 , 175 - 200 , 200 - 225 , 225 - 250 , 250 - 275 , 275 - 300 , 300 - 325 , 325 - 350 , 350 - 375 , 375 - 400 , 400 - 425 , 425 - 450 , 450 - 475 , 475 - 500 | ||
 | Click To Change The Sort Order: By Market Cap or Company Size Performance: Year-to-date, Week and Day |  |
|
Get the most comprehensive stock market coverage daily at 12Stocks.com ➞ Best Stocks Today ➞ Best Stocks Weekly ➞ Best Stocks Year-to-Date ➞ Best Stocks Trends ➞  Best Stocks Today 12Stocks.com Best Nasdaq Stocks ➞ Best S&P 500 Stocks ➞ Best Tech Stocks ➞ Best Biotech Stocks ➞ |
| Detailed Overview of S&P 500 Stocks |
| S&P 500 Technical Overview, Leaders & Laggards, Top S&P 500 ETF Funds & Detailed S&P 500 Stocks List, Charts, Trends & More |
| S&P 500: Technical Analysis, Trends & YTD Performance | |
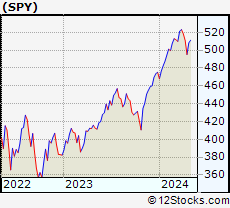
| S&P 500 index as represented by
SPY, an exchange-traded fund [ETF], holds basket of five hundred (mostly largecap) stocks from across all major sectors of the US stock market. The S&P 500 index (contains stocks like Apple and Exxon) is up by 4.99% and is currently outperforming the overall market by 0.74% year-to-date. Below is a quick view of technical charts and trends: | |
 SPY Weekly Chart |
|
| Long Term Trend: Good | |
| Medium Term Trend: Not Good | |
 SPY Daily Chart |
|
| Short Term Trend: Not Good | |
| Overall Trend Score: 44 | |
| YTD Performance: 4.99% | |
| **Trend Scores & Views Are Only For Educational Purposes And Not For Investing | |
| 12Stocks.com: Investing in S&P 500 Index using Exchange Traded Funds | |
|
The following table shows list of key exchange traded funds (ETF) that
help investors track S&P 500 index. The following list also includes leveraged ETF funds that track twice or thrice the daily returns of S&P 500 indices. Short or inverse ETF funds move in the opposite direction to the index they track and are useful during market pullbacks or during bear markets. Quick View: Move mouse or cursor over ETF symbol (ticker) to view short-term technical chart and over ETF name to view long term chart. Click on ticker or stock name for detailed view. Click on to add stock symbol to your watchlist and to view watchlist. |
12Stocks.com List of ETFs that track S&P 500 Index
| Ticker | ETF Name | Watchlist | Recent Price | Smart Investing & Trading Score | Change % | Week % | Year-to-date % |
| SPY | SPDR S&P 500 ETF | | 499.05 | 44 | -1.26 | 0.78 | 4.99% |
| OEF | iShares S&P 100 | | 235.81 | 34 | -1.66 | 0.48 | 5.56% |
| SSO | ProShares Ultra S&P500 | | 70.09 | 44 | -2.59 | 1.42 | 7.71% |
| UPRO | ProShares UltraPro S&P500 | | 60.43 | 36 | -3.90 | 2.15 | 10.39% |
| SH | ProShares Short S&P500 | | 12.52 | 62 | 1.54 | -0.56 | -3.62% |
| SDS | ProShares UltraShort S&P500 | | 27.50 | 62 | 2.61 | -1.43 | -8.09% |
| SPXU | ProShares UltraPro Short S&P500 | | 37.50 | 69 | 4.05 | -2.17 | -12.79% |
| 12Stocks.com: Charts, Trends, Fundamental Data and Performances of S&P 500 Stocks | |
|
We now take in-depth look at all S&P 500 stocks including charts, multi-period performances and overall trends (as measured by Smart Investing & Trading Score). One can sort S&P 500 stocks (click link to choose) by Daily, Weekly and by Year-to-Date performances. Also, one can sort by size of the company or by market capitalization. |
| Select Your Default Chart Type: | |||||
| |||||
| Click on stock symbol or name for detailed view. Click on to add stock symbol to your watchlist and to view watchlist. Quick View: Move mouse or cursor over "Daily" to quickly view daily technical stock chart and over "Weekly" to view weekly technical stock chart. | |||||

 | PM Philip Morris International Inc. |
| Sector: Consumer Staples | |
| SubSector: Cigarettes | |
| MarketCap: 105035 Millions | |
| Recent Price: 96.03 Smart Investing & Trading Score: 95 | |
| Day Percent Change: -3.01% Day Change: -2.98 | |
| Week Change: 2.42% Year-to-date Change: 2.1% | |
| PM Links: Profile News Message Board | |
| Charts:- Daily , Weekly | |
| Add PM to Watchlist: View: Get PM Trend Analysis ➞ | |
 | PAYX Paychex, Inc. |
| Sector: Services & Goods | |
| SubSector: Staffing & Outsourcing Services | |
| MarketCap: 20928.8 Millions | |
| Recent Price: 121.53 Smart Investing & Trading Score: 65 | |
| Day Percent Change: -0.81% Day Change: -0.99 | |
| Week Change: 1.68% Year-to-date Change: 2.0% | |
| PAYX Links: Profile News Message Board | |
| Charts:- Daily , Weekly | |
| Add PAYX to Watchlist: View: Get PAYX Trend Analysis ➞ | |
 | MOH Molina Healthcare, Inc. |
| Sector: Health Care | |
| SubSector: Health Care Plans | |
| MarketCap: 7235.6 Millions | |
| Recent Price: 368.35 Smart Investing & Trading Score: 44 | |
| Day Percent Change: 0.26% Day Change: 0.94 | |
| Week Change: 0.23% Year-to-date Change: 2.0% | |
| MOH Links: Profile News Message Board | |
| Charts:- Daily , Weekly | |
| Add MOH to Watchlist: View: Get MOH Trend Analysis ➞ | |
 | CNP CenterPoint Energy, Inc. |
| Sector: Utilities | |
| SubSector: Gas Utilities | |
| MarketCap: 7444.07 Millions | |
| Recent Price: 29.12 Smart Investing & Trading Score: 93 | |
| Day Percent Change: 0.17% Day Change: 0.05 | |
| Week Change: 2.07% Year-to-date Change: 1.9% | |
| CNP Links: Profile News Message Board | |
| Charts:- Daily , Weekly | |
| Add CNP to Watchlist: View: Get CNP Trend Analysis ➞ | |
 | CSGP CoStar Group, Inc. |
| Sector: Financials | |
| SubSector: Property Management | |
| MarketCap: 21454.4 Millions | |
| Recent Price: 89.08 Smart Investing & Trading Score: 80 | |
| Day Percent Change: -3.12% Day Change: -2.87 | |
| Week Change: 5.72% Year-to-date Change: 1.9% | |
| CSGP Links: Profile News Message Board | |
| Charts:- Daily , Weekly | |
| Add CSGP to Watchlist: View: Get CSGP Trend Analysis ➞ | |
 | ICE Intercontinental Exchange, Inc. |
| Sector: Financials | |
| SubSector: Diversified Investments | |
| MarketCap: 46054.6 Millions | |
| Recent Price: 130.89 Smart Investing & Trading Score: 26 | |
| Day Percent Change: -1.27% Day Change: -1.68 | |
| Week Change: -0.24% Year-to-date Change: 1.9% | |
| ICE Links: Profile News Message Board | |
| Charts:- Daily , Weekly | |
| Add ICE to Watchlist: View: Get ICE Trend Analysis ➞ | |
 | SNPS Synopsys, Inc. |
| Sector: Technology | |
| SubSector: Semiconductor Equipment & Materials | |
| MarketCap: 18273.8 Millions | |
| Recent Price: 524.54 Smart Investing & Trading Score: 25 | |
| Day Percent Change: -0.56% Day Change: -2.98 | |
| Week Change: 2.71% Year-to-date Change: 1.9% | |
| SNPS Links: Profile News Message Board | |
| Charts:- Daily , Weekly | |
| Add SNPS to Watchlist: View: Get SNPS Trend Analysis ➞ | |
 | DUK Duke Energy Corporation |
| Sector: Utilities | |
| SubSector: Electric Utilities | |
| MarketCap: 56678.2 Millions | |
| Recent Price: 98.73 Smart Investing & Trading Score: 81 | |
| Day Percent Change: -0.23% Day Change: -0.23 | |
| Week Change: 0.5% Year-to-date Change: 1.7% | |
| DUK Links: Profile News Message Board | |
| Charts:- Daily , Weekly | |
| Add DUK to Watchlist: View: Get DUK Trend Analysis ➞ | |
 | TXN Texas Instruments Incorporated |
| Sector: Technology | |
| SubSector: Semiconductor - Broad Line | |
| MarketCap: 99509.1 Millions | |
| Recent Price: 173.41 Smart Investing & Trading Score: 100 | |
| Day Percent Change: -0.80% Day Change: -1.40 | |
| Week Change: 8.6% Year-to-date Change: 1.7% | |
| TXN Links: Profile News Message Board | |
| Charts:- Daily , Weekly | |
| Add TXN to Watchlist: View: Get TXN Trend Analysis ➞ | |
 | ATO Atmos Energy Corporation |
| Sector: Utilities | |
| SubSector: Gas Utilities | |
| MarketCap: 11449 Millions | |
| Recent Price: 117.85 Smart Investing & Trading Score: 93 | |
| Day Percent Change: -0.69% Day Change: -0.81 | |
| Week Change: 0.55% Year-to-date Change: 1.7% | |
| ATO Links: Profile News Message Board | |
| Charts:- Daily , Weekly | |
| Add ATO to Watchlist: View: Get ATO Trend Analysis ➞ | |
 | CBOE Cboe Global Markets, Inc. |
| Sector: Financials | |
| SubSector: Diversified Investments | |
| MarketCap: 8834.5 Millions | |
| Recent Price: 181.47 Smart Investing & Trading Score: 49 | |
| Day Percent Change: 1.00% Day Change: 1.79 | |
| Week Change: 0.34% Year-to-date Change: 1.6% | |
| CBOE Links: Profile News Message Board | |
| Charts:- Daily , Weekly | |
| Add CBOE to Watchlist: View: Get CBOE Trend Analysis ➞ | |
 | TMUS T-Mobile US, Inc. |
| Sector: Technology | |
| SubSector: Wireless Communications | |
| MarketCap: 71949 Millions | |
| Recent Price: 162.89 Smart Investing & Trading Score: 100 | |
| Day Percent Change: -0.79% Day Change: -1.29 | |
| Week Change: 0.34% Year-to-date Change: 1.6% | |
| TMUS Links: Profile News Message Board | |
| Charts:- Daily , Weekly | |
| Add TMUS to Watchlist: View: Get TMUS Trend Analysis ➞ | |
 | STX Seagate Technology plc |
| Sector: Technology | |
| SubSector: Data Storage Devices | |
| MarketCap: 10814.7 Millions | |
| Recent Price: 86.64 Smart Investing & Trading Score: 38 | |
| Day Percent Change: -0.54% Day Change: -0.47 | |
| Week Change: 5.07% Year-to-date Change: 1.5% | |
| STX Links: Profile News Message Board | |
| Charts:- Daily , Weekly | |
| Add STX to Watchlist: View: Get STX Trend Analysis ➞ | |
 | AAL American Airlines Group Inc. |
| Sector: Transports | |
| SubSector: Major Airlines | |
| MarketCap: 5346.45 Millions | |
| Recent Price: 13.94 Smart Investing & Trading Score: 22 | |
| Day Percent Change: 0.14% Day Change: 0.02 | |
| Week Change: -1.2% Year-to-date Change: 1.5% | |
| AAL Links: Profile News Message Board | |
| Charts:- Daily , Weekly | |
| Add AAL to Watchlist: View: Get AAL Trend Analysis ➞ | |
 | CME CME Group Inc. |
| Sector: Financials | |
| SubSector: Investment Brokerage - National | |
| MarketCap: 64145 Millions | |
| Recent Price: 213.63 Smart Investing & Trading Score: 76 | |
| Day Percent Change: 0.49% Day Change: 1.04 | |
| Week Change: 0.28% Year-to-date Change: 1.4% | |
| CME Links: Profile News Message Board | |
| Charts:- Daily , Weekly | |
| Add CME to Watchlist: View: Get CME Trend Analysis ➞ | |
 | LMT Lockheed Martin Corporation |
| Sector: Industrials | |
| SubSector: Aerospace/Defense Products & Services | |
| MarketCap: 94116.4 Millions | |
| Recent Price: 459.76 Smart Investing & Trading Score: 86 | |
| Day Percent Change: 0.13% Day Change: 0.62 | |
| Week Change: -0.89% Year-to-date Change: 1.4% | |
| LMT Links: Profile News Message Board | |
| Charts:- Daily , Weekly | |
| Add LMT to Watchlist: View: Get LMT Trend Analysis ➞ | |
 | ROL Rollins, Inc. |
| Sector: Services & Goods | |
| SubSector: Business Services | |
| MarketCap: 12827.4 Millions | |
| Recent Price: 44.30 Smart Investing & Trading Score: 39 | |
| Day Percent Change: 3.34% Day Change: 1.43 | |
| Week Change: 4.21% Year-to-date Change: 1.4% | |
| ROL Links: Profile News Message Board | |
| Charts:- Daily , Weekly | |
| Add ROL to Watchlist: View: Get ROL Trend Analysis ➞ | |
 | JKHY Jack Henry & Associates, Inc. |
| Sector: Technology | |
| SubSector: Information Technology Services | |
| MarketCap: 10695.4 Millions | |
| Recent Price: 165.69 Smart Investing & Trading Score: 41 | |
| Day Percent Change: 0.30% Day Change: 0.50 | |
| Week Change: 0.06% Year-to-date Change: 1.4% | |
| JKHY Links: Profile News Message Board | |
| Charts:- Daily , Weekly | |
| Add JKHY to Watchlist: View: Get JKHY Trend Analysis ➞ | |
 | AVB AvalonBay Communities, Inc. |
| Sector: Financials | |
| SubSector: REIT - Residential | |
| MarketCap: 19921.9 Millions | |
| Recent Price: 189.54 Smart Investing & Trading Score: 100 | |
| Day Percent Change: -0.94% Day Change: -1.81 | |
| Week Change: 2.94% Year-to-date Change: 1.2% | |
| AVB Links: Profile News Message Board | |
| Charts:- Daily , Weekly | |
| Add AVB to Watchlist: View: Get AVB Trend Analysis ➞ | |
 | TJX The TJX Companies, Inc. |
| Sector: Services & Goods | |
| SubSector: Department Stores | |
| MarketCap: 50656.2 Millions | |
| Recent Price: 94.97 Smart Investing & Trading Score: 52 | |
| Day Percent Change: -0.33% Day Change: -0.31 | |
| Week Change: 1.72% Year-to-date Change: 1.2% | |
| TJX Links: Profile News Message Board | |
| Charts:- Daily , Weekly | |
| Add TJX to Watchlist: View: Get TJX Trend Analysis ➞ | |
 | NEM Newmont Corporation |
| Sector: Materials | |
| SubSector: Gold | |
| MarketCap: 33928.8 Millions | |
| Recent Price: 41.88 Smart Investing & Trading Score: 100 | |
| Day Percent Change: 8.50% Day Change: 3.28 | |
| Week Change: 7.33% Year-to-date Change: 1.2% | |
| NEM Links: Profile News Message Board | |
| Charts:- Daily , Weekly | |
| Add NEM to Watchlist: View: Get NEM Trend Analysis ➞ | |
 | FFIV F5 Networks, Inc. |
| Sector: Technology | |
| SubSector: Business Software & Services | |
| MarketCap: 6675.38 Millions | |
| Recent Price: 181.05 Smart Investing & Trading Score: 32 | |
| Day Percent Change: -0.71% Day Change: -1.30 | |
| Week Change: 2.1% Year-to-date Change: 1.2% | |
| FFIV Links: Profile News Message Board | |
| Charts:- Daily , Weekly | |
| Add FFIV to Watchlist: View: Get FFIV Trend Analysis ➞ | |
 | LEN Lennar Corporation |
| Sector: Industrials | |
| SubSector: Residential Construction | |
| MarketCap: 11926.6 Millions | |
| Recent Price: 150.65 Smart Investing & Trading Score: 13 | |
| Day Percent Change: -2.25% Day Change: -3.47 | |
| Week Change: 0.31% Year-to-date Change: 1.1% | |
| LEN Links: Profile News Message Board | |
| Charts:- Daily , Weekly | |
| Add LEN to Watchlist: View: Get LEN Trend Analysis ➞ | |
 | CDNS Cadence Design Systems, Inc. |
| Sector: Technology | |
| SubSector: Application Software | |
| MarketCap: 16865.8 Millions | |
| Recent Price: 275.18 Smart Investing & Trading Score: 10 | |
| Day Percent Change: -0.89% Day Change: -2.48 | |
| Week Change: -1.81% Year-to-date Change: 1.0% | |
| CDNS Links: Profile News Message Board | |
| Charts:- Daily , Weekly | |
| Add CDNS to Watchlist: View: Get CDNS Trend Analysis ➞ | |
 | IQV IQVIA Holdings Inc. |
| Sector: Health Care | |
| SubSector: Medical Laboratories & Research | |
| MarketCap: 19616.5 Millions | |
| Recent Price: 233.70 Smart Investing & Trading Score: 53 | |
| Day Percent Change: -2.96% Day Change: -7.14 | |
| Week Change: 2.46% Year-to-date Change: 1.0% | |
| IQV Links: Profile News Message Board | |
| Charts:- Daily , Weekly | |
| Add IQV to Watchlist: View: Get IQV Trend Analysis ➞ | |
| For tabular summary view of above stock list: Summary View ➞ 0 - 25 , 25 - 50 , 50 - 75 , 75 - 100 , 100 - 125 , 125 - 150 , 150 - 175 , 175 - 200 , 200 - 225 , 225 - 250 , 250 - 275 , 275 - 300 , 300 - 325 , 325 - 350 , 350 - 375 , 375 - 400 , 400 - 425 , 425 - 450 , 450 - 475 , 475 - 500 | ||
| Click To Change The Sort Order: By Market Cap or Company Size Performance: Year-to-date, Week and Day | |
| Select Chart Type: | ||
|
Best Stocks Today 12Stocks.com |
© 2024 12Stocks.com Terms & Conditions Privacy Contact Us
All Information Provided Only For Education And Not To Be Used For Investing or Trading. See Terms & Conditions


One More Thing ... Get Best Stocks Delivered Daily!
Never Ever Miss A Move With Our Top Ten Stocks Lists
Find Best Stocks In Any Market - Bull or Bear Market
Take A Peek At Our Top Ten Stocks Lists: Daily, Weekly, Year-to-Date & Top Trends
Find Best Stocks In Any Market - Bull or Bear Market
Take A Peek At Our Top Ten Stocks Lists: Daily, Weekly, Year-to-Date & Top Trends
S&P 500 Stocks With Best Up Trends [0-bearish to 100-bullish]: Newmont [100], Dover [100], Chipotle Mexican[100], Merck [100], Northrop Grumman[100], EQT [100], Boston Scientific[100], Coca-Cola [100], Altria [100], Hess [100], Campbell Soup[100]
Best S&P 500 Stocks Year-to-Date:
NVIDIA [65.24%], Constellation [60.24%], NRG [39.81%], Targa Resources[34.22%], Marathon [33.86%], Chipotle Mexican[32.43%], Diamondback [32.2%], Progressive [31.71%], Eaton [30.97%], Western Digital[30.89%], Micron [30.34%] Best S&P 500 Stocks This Week:
Hasbro [17.46%], Globe Life[14.66%], Tesla [13.26%], Wabtec [12.29%], Teradyne [12.18%], Microchip [10.53%], Tyler Technologies[10.37%], Monolithic Power[10.19%], NXP Semiconductors[9.67%], ON Semiconductor[8.85%], Boston Scientific[8.79%] Best S&P 500 Stocks Daily:
Newmont [8.50%], Carrier Global[7.19%], Teradyne [6.91%], Tyler Technologies[6.24%], Dover [4.35%], ProShares UltraPro[4.05%], Keurig Dr[3.77%], United Rentals[3.69%], Union Pacific[3.50%], Chipotle Mexican[3.48%], Rollins [3.34%]