
 Login Sign Up


| |||||
 |  | ||||

| 12Stocks.com Market Intelligence |
Best S&P 500 Stocks
|
On this page, you will find the most comprehensive analysis of S&P 500 stocks and ETFs - from latest trends to performances to charts ➞. First, here are the year-to-date (YTD) performances of the most requested S&P 500 stocks at 12Stocks.com (click stock for review):
| NVIDIA 67% | ||
| Caterpillar 21% | ||
| Amazon.com 16% | ||
| Merck 15% | ||
| Walmart 13% | ||
| Google 11% | ||
| JPMorgan Chase 8% | ||
| Chevron 8% | ||
| Microsoft 7% | ||
| Goldman Sachs 5% | ||
| Johnson & Johnson -7% | ||
| Starbucks -8% | ||
| McDonald s -8% | ||
| Apple -14% | ||
| Gilead -18% | ||
| Intel -31% | ||
| Boeing -34% | ||
| Quick: S&P 500 Stocks Lists: Performances & Trends, S&P 500 Stock Charts
Sort S&P 500 stocks: Daily, Weekly, Year-to-Date, Market Cap & Trends. Filter S&P 500 stocks list by sector: Show all, Tech, Finance, Energy, Staples, Retail, Industrial, Materials, Utilities and HealthCare |
| 12Stocks.com S&P 500 Stocks Performances & Trends Daily Report | |||||||||
|
| 
The overall Smart Investing & Trading Score is 36 (0-bearish to 100-bullish) which puts S&P 500 index in short term bearish to neutral trend. The Smart Investing & Trading Score from previous trading session is 26 and an improvement of trend continues. | ||||||||
Here are the Smart Investing & Trading Scores of the most requested S&P 500 stocks at 12Stocks.com (click stock name for detailed review):
|


| 12Stocks.com: Top Performing S&P 500 Index Stocks | ||||||||||||||||||||||||||||||||||||||||||||||||
 The top performing S&P 500 Index stocks year to date are
Now, more recently, over last week, the top performing S&P 500 Index stocks on the move are


|
||||||||||||||||||||||||||||||||||||||||||||||||
| 12Stocks.com: Investing in S&P 500 Index with Stocks | |
|
The following table helps investors and traders sort through current performance and trends (as measured by Smart Investing & Trading Score) of various
stocks in the S&P 500 Index. Quick View: Move mouse or cursor over stock symbol (ticker) to view short-term technical chart and over stock name to view long term chart. Click on  to add stock symbol to your watchlist and to add stock symbol to your watchlist and  to view watchlist. Click on any ticker or stock name for detailed market intelligence report for that stock. to view watchlist. Click on any ticker or stock name for detailed market intelligence report for that stock. |
12Stocks.com Performance of Stocks in S&P 500 Index
| Ticker | Stock Name | Watchlist | Category | Recent Price | Smart Investing & Trading Score | Change % | YTD Change% |
| HON | Honeywell |   | Industrials | 193.87 | 32 | 1.46% | -7.55% |
| USB | U.S. Bancorp | | Financials | 39.99 | 17 | 1.41% | -7.59% |
| EQIX | Equinix | | Financials | 743.34 | 25 | 0.47% | -7.70% |
| O | Realty Income | | Financials | 52.98 | 52 | 1.83% | -7.73% |
| MNST | Monster Beverage | | Consumer Staples | 53.16 | 10 | -0.57% | -7.73% |
| KEYS | Keysight Technologies | | Technology | 146.50 | 10 | -0.27% | -7.91% |
| NCLH | Norwegian Cruise | | Services & Goods | 18.45 | 51 | 1.54% | -7.93% |
| AMGN | Amgen | | Health Care | 264.75 | 28 | 0.76% | -8.08% |
| TER | Teradyne | | Technology | 99.45 | 26 | -0.75% | -8.36% |
| SBUX | Starbucks | | Services & Goods | 87.94 | 49 | 0.91% | -8.41% |
| UPS | United Parcel | | Transports | 144.01 | 68 | 0.89% | -8.41% |
| BX | Blackstone | | Financials | 119.91 | 10 | -0.34% | -8.41% |
| MCD | McDonald s | | Services & Goods | 271.42 | 49 | 0.16% | -8.46% |
| BWA | BorgWarner | | Consumer Staples | 32.78 | 42 | 2.09% | -8.56% |
| CBRE | CBRE | | Financials | 85.08 | 18 | -0.07% | -8.60% |
| SWK | Stanley Black | | Industrials | 89.55 | 18 | 0.26% | -8.72% |
| FMC | FMC | | Materials | 57.53 | 68 | 1.04% | -8.75% |
| POOL | Pool | | Consumer Staples | 363.69 | 10 | 0.22% | -8.78% |
| APA | Apache | | Energy | 32.71 | 54 | 0.86% | -8.84% |
| KVUE | Kenvue | | Consumer Staples | 19.54 | 42 | 0.67% | -8.97% |
| CMCSA | Comcast | | Services & Goods | 39.91 | 32 | 0.73% | -8.99% |
| EXPD | Expeditors | | Transports | 115.57 | 25 | 0.70% | -9.15% |
| ZION | Zions Ban | | Financials | 39.83 | 35 | 1.49% | -9.22% |
| STE | STERIS | | Health Care | 199.35 | 25 | -0.73% | -9.32% |
| FDS | FactSet Research | | Technology | 431.73 | 42 | 0.53% | -9.50% |
| For chart view version of above stock list: Chart View ➞ 0 - 25 , 25 - 50 , 50 - 75 , 75 - 100 , 100 - 125 , 125 - 150 , 150 - 175 , 175 - 200 , 200 - 225 , 225 - 250 , 250 - 275 , 275 - 300 , 300 - 325 , 325 - 350 , 350 - 375 , 375 - 400 , 400 - 425 , 425 - 450 , 450 - 475 , 475 - 500 | ||
 | Click To Change The Sort Order: By Market Cap or Company Size Performance: Year-to-date, Week and Day |  |
|
Get the most comprehensive stock market coverage daily at 12Stocks.com ➞ Best Stocks Today ➞ Best Stocks Weekly ➞ Best Stocks Year-to-Date ➞ Best Stocks Trends ➞  Best Stocks Today 12Stocks.com Best Nasdaq Stocks ➞ Best S&P 500 Stocks ➞ Best Tech Stocks ➞ Best Biotech Stocks ➞ |
| Detailed Overview of S&P 500 Stocks |
| S&P 500 Technical Overview, Leaders & Laggards, Top S&P 500 ETF Funds & Detailed S&P 500 Stocks List, Charts, Trends & More |
| S&P 500: Technical Analysis, Trends & YTD Performance | |
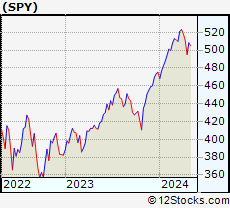
| S&P 500 index as represented by
SPY, an exchange-traded fund [ETF], holds basket of five hundred (mostly largecap) stocks from across all major sectors of the US stock market. The S&P 500 index (contains stocks like Apple and Exxon) is up by 4.95% and is currently outperforming the overall market by 0.87% year-to-date. Below is a quick view of technical charts and trends: | |
 SPY Weekly Chart |
|
| Long Term Trend: Good | |
| Medium Term Trend: Not Good | |
 SPY Daily Chart |
|
| Short Term Trend: Deteriorating | |
| Overall Trend Score: 36 | |
| YTD Performance: 4.95% | |
| **Trend Scores & Views Are Only For Educational Purposes And Not For Investing | |
| 12Stocks.com: Investing in S&P 500 Index using Exchange Traded Funds | |
|
The following table shows list of key exchange traded funds (ETF) that
help investors track S&P 500 index. The following list also includes leveraged ETF funds that track twice or thrice the daily returns of S&P 500 indices. Short or inverse ETF funds move in the opposite direction to the index they track and are useful during market pullbacks or during bear markets. Quick View: Move mouse or cursor over ETF symbol (ticker) to view short-term technical chart and over ETF name to view long term chart. Click on ticker or stock name for detailed view. Click on to add stock symbol to your watchlist and to view watchlist. |
12Stocks.com List of ETFs that track S&P 500 Index
| Ticker | ETF Name | Watchlist | Recent Price | Smart Investing & Trading Score | Change % | Week % | Year-to-date % |
| SPY | SPDR S&P 500 ETF | | 498.82 | 36 | -0.14 | -2.35 | 4.95% |
| OEF | iShares S&P 100 | | 236.60 | 36 | -0.43 | -2.69 | 5.91% |
| SSO | ProShares Ultra S&P500 | | 70.13 | 36 | -0.28 | -4.79 | 7.78% |
| UPRO | ProShares UltraPro S&P500 | | 60.52 | 36 | -0.43 | -7.18 | 10.56% |
| SH | ProShares Short S&P500 | | 12.50 | 69 | 0.24 | 2.54 | -3.77% |
| SDS | ProShares UltraShort S&P500 | | 27.50 | 69 | 0.33 | 5.08 | -8.09% |
| SPXU | ProShares UltraPro Short S&P500 | | 37.53 | 64 | 0.54 | 7.66 | -12.72% |
| 12Stocks.com: Charts, Trends, Fundamental Data and Performances of S&P 500 Stocks | |
|
We now take in-depth look at all S&P 500 stocks including charts, multi-period performances and overall trends (as measured by Smart Investing & Trading Score). One can sort S&P 500 stocks (click link to choose) by Daily, Weekly and by Year-to-Date performances. Also, one can sort by size of the company or by market capitalization. |
| Select Your Default Chart Type: | |||||
| |||||
| Click on stock symbol or name for detailed view. Click on to add stock symbol to your watchlist and to view watchlist. Quick View: Move mouse or cursor over "Daily" to quickly view daily technical stock chart and over "Weekly" to view weekly technical stock chart. | |||||

 | HON Honeywell International Inc. |
| Sector: Industrials | |
| SubSector: Diversified Machinery | |
| MarketCap: 91189.1 Millions | |
| Recent Price: 193.87 Smart Investing & Trading Score: 32 | |
| Day Percent Change: 1.46% Day Change: 2.79 | |
| Week Change: -1.17% Year-to-date Change: -7.6% | |
| HON Links: Profile News Message Board | |
| Charts:- Daily , Weekly | |
| Add HON to Watchlist: View: Get HON Trend Analysis ➞ | |
 | USB U.S. Bancorp |
| Sector: Financials | |
| SubSector: Regional - Midwest Banks | |
| MarketCap: 56757.8 Millions | |
| Recent Price: 39.99 Smart Investing & Trading Score: 17 | |
| Day Percent Change: 1.41% Day Change: 0.55 | |
| Week Change: -3.81% Year-to-date Change: -7.6% | |
| USB Links: Profile News Message Board | |
| Charts:- Daily , Weekly | |
| Add USB to Watchlist: View: Get USB Trend Analysis ➞ | |
 | EQIX Equinix, Inc. (REIT) |
| Sector: Financials | |
| SubSector: REIT - Diversified | |
| MarketCap: 45855.3 Millions | |
| Recent Price: 743.34 Smart Investing & Trading Score: 25 | |
| Day Percent Change: 0.47% Day Change: 3.49 | |
| Week Change: -3.94% Year-to-date Change: -7.7% | |
| EQIX Links: Profile News Message Board | |
| Charts:- Daily , Weekly | |
| Add EQIX to Watchlist: View: Get EQIX Trend Analysis ➞ | |
 | O Realty Income Corporation |
| Sector: Financials | |
| SubSector: REIT - Retail | |
| MarketCap: 17647.4 Millions | |
| Recent Price: 52.98 Smart Investing & Trading Score: 52 | |
| Day Percent Change: 1.83% Day Change: 0.95 | |
| Week Change: 1.85% Year-to-date Change: -7.7% | |
| O Links: Profile News Message Board | |
| Charts:- Daily , Weekly | |
| Add O to Watchlist: View: Get O Trend Analysis ➞ | |
 | MNST Monster Beverage Corporation |
| Sector: Consumer Staples | |
| SubSector: Beverages - Soft Drinks | |
| MarketCap: 30126.8 Millions | |
| Recent Price: 53.16 Smart Investing & Trading Score: 10 | |
| Day Percent Change: -0.57% Day Change: -0.30 | |
| Week Change: -3.37% Year-to-date Change: -7.7% | |
| MNST Links: Profile News Message Board | |
| Charts:- Daily , Weekly | |
| Add MNST to Watchlist: View: Get MNST Trend Analysis ➞ | |
 | KEYS Keysight Technologies, Inc. |
| Sector: Technology | |
| SubSector: Scientific & Technical Instruments | |
| MarketCap: 17355.1 Millions | |
| Recent Price: 146.50 Smart Investing & Trading Score: 10 | |
| Day Percent Change: -0.27% Day Change: -0.39 | |
| Week Change: -5.54% Year-to-date Change: -7.9% | |
| KEYS Links: Profile News Message Board | |
| Charts:- Daily , Weekly | |
| Add KEYS to Watchlist: View: Get KEYS Trend Analysis ➞ | |
 | NCLH Norwegian Cruise Line Holdings Ltd. |
| Sector: Services & Goods | |
| SubSector: Resorts & Casinos | |
| MarketCap: 2895.54 Millions | |
| Recent Price: 18.45 Smart Investing & Trading Score: 51 | |
| Day Percent Change: 1.54% Day Change: 0.28 | |
| Week Change: 3.83% Year-to-date Change: -7.9% | |
| NCLH Links: Profile News Message Board | |
| Charts:- Daily , Weekly | |
| Add NCLH to Watchlist: View: Get NCLH Trend Analysis ➞ | |
 | AMGN Amgen Inc. |
| Sector: Health Care | |
| SubSector: Biotechnology | |
| MarketCap: 121030 Millions | |
| Recent Price: 264.75 Smart Investing & Trading Score: 28 | |
| Day Percent Change: 0.76% Day Change: 2.00 | |
| Week Change: -0.95% Year-to-date Change: -8.1% | |
| AMGN Links: Profile News Message Board | |
| Charts:- Daily , Weekly | |
| Add AMGN to Watchlist: View: Get AMGN Trend Analysis ➞ | |
 | TER Teradyne, Inc. |
| Sector: Technology | |
| SubSector: Semiconductor Equipment & Materials | |
| MarketCap: 8135.68 Millions | |
| Recent Price: 99.45 Smart Investing & Trading Score: 26 | |
| Day Percent Change: -0.75% Day Change: -0.75 | |
| Week Change: -6.06% Year-to-date Change: -8.4% | |
| TER Links: Profile News Message Board | |
| Charts:- Daily , Weekly | |
| Add TER to Watchlist: View: Get TER Trend Analysis ➞ | |
 | SBUX Starbucks Corporation |
| Sector: Services & Goods | |
| SubSector: Specialty Eateries | |
| MarketCap: 74909.7 Millions | |
| Recent Price: 87.94 Smart Investing & Trading Score: 49 | |
| Day Percent Change: 0.91% Day Change: 0.79 | |
| Week Change: 3.56% Year-to-date Change: -8.4% | |
| SBUX Links: Profile News Message Board | |
| Charts:- Daily , Weekly | |
| Add SBUX to Watchlist: View: Get SBUX Trend Analysis ➞ | |
 | UPS United Parcel Service, Inc. |
| Sector: Transports | |
| SubSector: Air Delivery & Freight Services | |
| MarketCap: 81928.9 Millions | |
| Recent Price: 144.01 Smart Investing & Trading Score: 68 | |
| Day Percent Change: 0.89% Day Change: 1.26 | |
| Week Change: -0.62% Year-to-date Change: -8.4% | |
| UPS Links: Profile News Message Board | |
| Charts:- Daily , Weekly | |
| Add UPS to Watchlist: View: Get UPS Trend Analysis ➞ | |
 | BX The Blackstone Group Inc. |
| Sector: Financials | |
| SubSector: Asset Management | |
| MarketCap: 50957.7 Millions | |
| Recent Price: 119.91 Smart Investing & Trading Score: 10 | |
| Day Percent Change: -0.34% Day Change: -0.41 | |
| Week Change: -2.88% Year-to-date Change: -8.4% | |
| BX Links: Profile News Message Board | |
| Charts:- Daily , Weekly | |
| Add BX to Watchlist: View: Get BX Trend Analysis ➞ | |
 | MCD McDonald s Corporation |
| Sector: Services & Goods | |
| SubSector: Restaurants | |
| MarketCap: 122481 Millions | |
| Recent Price: 271.42 Smart Investing & Trading Score: 49 | |
| Day Percent Change: 0.16% Day Change: 0.44 | |
| Week Change: 1.51% Year-to-date Change: -8.5% | |
| MCD Links: Profile News Message Board | |
| Charts:- Daily , Weekly | |
| Add MCD to Watchlist: View: Get MCD Trend Analysis ➞ | |
 | BWA BorgWarner Inc. |
| Sector: Consumer Staples | |
| SubSector: Auto Parts | |
| MarketCap: 4604.09 Millions | |
| Recent Price: 32.78 Smart Investing & Trading Score: 42 | |
| Day Percent Change: 2.09% Day Change: 0.67 | |
| Week Change: -2.15% Year-to-date Change: -8.6% | |
| BWA Links: Profile News Message Board | |
| Charts:- Daily , Weekly | |
| Add BWA to Watchlist: View: Get BWA Trend Analysis ➞ | |
 | CBRE CBRE Group, Inc. |
| Sector: Financials | |
| SubSector: Property Management | |
| MarketCap: 12799.2 Millions | |
| Recent Price: 85.08 Smart Investing & Trading Score: 18 | |
| Day Percent Change: -0.07% Day Change: -0.06 | |
| Week Change: -4.82% Year-to-date Change: -8.6% | |
| CBRE Links: Profile News Message Board | |
| Charts:- Daily , Weekly | |
| Add CBRE to Watchlist: View: Get CBRE Trend Analysis ➞ | |
 | SWK Stanley Black & Decker, Inc. |
| Sector: Industrials | |
| SubSector: Machine Tools & Accessories | |
| MarketCap: 14274.8 Millions | |
| Recent Price: 89.55 Smart Investing & Trading Score: 18 | |
| Day Percent Change: 0.26% Day Change: 0.23 | |
| Week Change: -2.11% Year-to-date Change: -8.7% | |
| SWK Links: Profile News Message Board | |
| Charts:- Daily , Weekly | |
| Add SWK to Watchlist: View: Get SWK Trend Analysis ➞ | |
 | FMC FMC Corporation |
| Sector: Materials | |
| SubSector: Chemicals - Major Diversified | |
| MarketCap: 9068.36 Millions | |
| Recent Price: 57.53 Smart Investing & Trading Score: 68 | |
| Day Percent Change: 1.04% Day Change: 0.59 | |
| Week Change: 1.37% Year-to-date Change: -8.8% | |
| FMC Links: Profile News Message Board | |
| Charts:- Daily , Weekly | |
| Add FMC to Watchlist: View: Get FMC Trend Analysis ➞ | |
 | POOL Pool Corporation |
| Sector: Consumer Staples | |
| SubSector: Sporting Goods | |
| MarketCap: 7479.64 Millions | |
| Recent Price: 363.69 Smart Investing & Trading Score: 10 | |
| Day Percent Change: 0.22% Day Change: 0.78 | |
| Week Change: -4.34% Year-to-date Change: -8.8% | |
| POOL Links: Profile News Message Board | |
| Charts:- Daily , Weekly | |
| Add POOL to Watchlist: View: Get POOL Trend Analysis ➞ | |
 | APA Apache Corporation |
| Sector: Energy | |
| SubSector: Independent Oil & Gas | |
| MarketCap: 1937.53 Millions | |
| Recent Price: 32.71 Smart Investing & Trading Score: 54 | |
| Day Percent Change: 0.86% Day Change: 0.28 | |
| Week Change: -3% Year-to-date Change: -8.8% | |
| APA Links: Profile News Message Board | |
| Charts:- Daily , Weekly | |
| Add APA to Watchlist: View: Get APA Trend Analysis ➞ | |
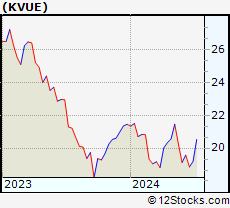 | KVUE Kenvue Inc. |
| Sector: Consumer Staples | |
| SubSector: Household & Personal Products | |
| MarketCap: 50220 Millions | |
| Recent Price: 19.54 Smart Investing & Trading Score: 42 | |
| Day Percent Change: 0.67% Day Change: 0.13 | |
| Week Change: 2.12% Year-to-date Change: -9.0% | |
| KVUE Links: Profile News Message Board | |
| Charts:- Daily , Weekly | |
| Add KVUE to Watchlist: View: Get KVUE Trend Analysis ➞ | |
 | CMCSA Comcast Corporation |
| Sector: Services & Goods | |
| SubSector: Entertainment - Diversified | |
| MarketCap: 164849 Millions | |
| Recent Price: 39.91 Smart Investing & Trading Score: 32 | |
| Day Percent Change: 0.73% Day Change: 0.29 | |
| Week Change: 1.37% Year-to-date Change: -9.0% | |
| CMCSA Links: Profile News Message Board | |
| Charts:- Daily , Weekly | |
| Add CMCSA to Watchlist: View: Get CMCSA Trend Analysis ➞ | |
 | EXPD Expeditors International of Washington, Inc. |
| Sector: Transports | |
| SubSector: Air Delivery & Freight Services | |
| MarketCap: 10129.8 Millions | |
| Recent Price: 115.57 Smart Investing & Trading Score: 25 | |
| Day Percent Change: 0.70% Day Change: 0.80 | |
| Week Change: -1.77% Year-to-date Change: -9.2% | |
| EXPD Links: Profile News Message Board | |
| Charts:- Daily , Weekly | |
| Add EXPD to Watchlist: View: Get EXPD Trend Analysis ➞ | |
 | ZION Zions Bancorporation, National Association |
| Sector: Financials | |
| SubSector: Regional - Pacific Banks | |
| MarketCap: 4577.89 Millions | |
| Recent Price: 39.83 Smart Investing & Trading Score: 35 | |
| Day Percent Change: 1.49% Day Change: 0.59 | |
| Week Change: -2.08% Year-to-date Change: -9.2% | |
| ZION Links: Profile News Message Board | |
| Charts:- Daily , Weekly | |
| Add ZION to Watchlist: View: Get ZION Trend Analysis ➞ | |
 | STE STERIS plc |
| Sector: Health Care | |
| SubSector: Medical Instruments & Supplies | |
| MarketCap: 10875 Millions | |
| Recent Price: 199.35 Smart Investing & Trading Score: 25 | |
| Day Percent Change: -0.73% Day Change: -1.46 | |
| Week Change: -2.28% Year-to-date Change: -9.3% | |
| STE Links: Profile News Message Board | |
| Charts:- Daily , Weekly | |
| Add STE to Watchlist: View: Get STE Trend Analysis ➞ | |
 | FDS FactSet Research Systems Inc. |
| Sector: Technology | |
| SubSector: Information & Delivery Services | |
| MarketCap: 9024.37 Millions | |
| Recent Price: 431.73 Smart Investing & Trading Score: 42 | |
| Day Percent Change: 0.53% Day Change: 2.27 | |
| Week Change: 1.29% Year-to-date Change: -9.5% | |
| FDS Links: Profile News Message Board | |
| Charts:- Daily , Weekly | |
| Add FDS to Watchlist: View: Get FDS Trend Analysis ➞ | |
| For tabular summary view of above stock list: Summary View ➞ 0 - 25 , 25 - 50 , 50 - 75 , 75 - 100 , 100 - 125 , 125 - 150 , 150 - 175 , 175 - 200 , 200 - 225 , 225 - 250 , 250 - 275 , 275 - 300 , 300 - 325 , 325 - 350 , 350 - 375 , 375 - 400 , 400 - 425 , 425 - 450 , 450 - 475 , 475 - 500 | ||
| Click To Change The Sort Order: By Market Cap or Company Size Performance: Year-to-date, Week and Day | |
| Select Chart Type: | ||
|
Best Stocks Today 12Stocks.com |
© 2024 12Stocks.com Terms & Conditions Privacy Contact Us
All Information Provided Only For Education And Not To Be Used For Investing or Trading. See Terms & Conditions


One More Thing ... Get Best Stocks Delivered Daily!
Never Ever Miss A Move With Our Top Ten Stocks Lists
Find Best Stocks In Any Market - Bull or Bear Market
Take A Peek At Our Top Ten Stocks Lists: Daily, Weekly, Year-to-Date & Top Trends
Find Best Stocks In Any Market - Bull or Bear Market
Take A Peek At Our Top Ten Stocks Lists: Daily, Weekly, Year-to-Date & Top Trends
S&P 500 Stocks With Best Up Trends [0-bearish to 100-bullish]: Kinder Morgan[100], Wells Fargo[100], Bunge [100], Consolidated Edison[100], Lockheed Martin[100], Charles Schwab[100], Conagra Brands[100], Genuine Parts[100], United Airlines[100], Dominion [95], Progressive [95]
Best S&P 500 Stocks Year-to-Date:
NVIDIA [66.66%], Constellation [57.45%], Meta Platforms[38.28%], NRG [36.11%], Progressive [34.35%], Marathon [33.2%], Targa Resources[31.03%], Diamondback [30.74%], Western Digital[29.2%], Eaton [28.4%], Micron [27.36%] Best S&P 500 Stocks This Week:
United Airlines[23.18%], UnitedHealth [14.33%], Genuine Parts[10.93%], Globe Life[10.86%], American Airlines[8.4%], ProShares UltraPro[7.66%], Southwest Airlines[7.43%], Wells Fargo[7.31%], V.F [6.11%], Morgan Stanley[5.88%], Centene [5.68%] Best S&P 500 Stocks Daily:
Fifth Third[5.13%], American Express[4.47%], Kinder Morgan[3.51%], Bank of America[3.40%], Wells Fargo[3.17%], Bunge [2.96%], PNC Financial[2.77%], Generac Holdings[2.63%], Synchrony Financial[2.48%], Citizens Financial[2.46%], Truist Financial[2.42%]