
 Login Sign Up


| |||||
 |  | ||||

| 12Stocks.com Market Intelligence |
Best S&P 500 Stocks
|
On this page, you will find the most comprehensive analysis of S&P 500 stocks and ETFs - from latest trends to performances to charts ➞. First, here are the year-to-date (YTD) performances of the most requested S&P 500 stocks at 12Stocks.com (click stock for review):
| NVIDIA 72% | ||
| Caterpillar 23% | ||
| Amazon.com 20% | ||
| Merck 15% | ||
| Walmart 13% | ||
| Google 12% | ||
| Microsoft 9% | ||
| JPMorgan Chase 8% | ||
| Chevron 6% | ||
| Goldman Sachs 5% | ||
| Johnson & Johnson -7% | ||
| McDonald s -9% | ||
| Starbucks -10% | ||
| Apple -13% | ||
| Gilead -18% | ||
| Intel -29% | ||
| Boeing -34% | ||
| Quick: S&P 500 Stocks Lists: Performances & Trends, S&P 500 Stock Charts
Sort S&P 500 stocks: Daily, Weekly, Year-to-Date, Market Cap & Trends. Filter S&P 500 stocks list by sector: Show all, Tech, Finance, Energy, Staples, Retail, Industrial, Materials, Utilities and HealthCare |
| 12Stocks.com S&P 500 Stocks Performances & Trends Daily Report | |||||||||
|
| 
The overall Smart Investing & Trading Score is 44 (0-bearish to 100-bullish) which puts S&P 500 index in short term neutral trend. The Smart Investing & Trading Score from previous trading session is 26 and hence an improvement of trend. | ||||||||
Here are the Smart Investing & Trading Scores of the most requested S&P 500 stocks at 12Stocks.com (click stock name for detailed review):
|


| 12Stocks.com: Top Performing S&P 500 Index Stocks | ||||||||||||||||||||||||||||||||||||||||||||||||
 The top performing S&P 500 Index stocks year to date are
Now, more recently, over last week, the top performing S&P 500 Index stocks on the move are


|
||||||||||||||||||||||||||||||||||||||||||||||||
| 12Stocks.com: Investing in S&P 500 Index with Stocks | |
|
The following table helps investors and traders sort through current performance and trends (as measured by Smart Investing & Trading Score) of various
stocks in the S&P 500 Index. Quick View: Move mouse or cursor over stock symbol (ticker) to view short-term technical chart and over stock name to view long term chart. Click on  to add stock symbol to your watchlist and to add stock symbol to your watchlist and  to view watchlist. Click on any ticker or stock name for detailed market intelligence report for that stock. to view watchlist. Click on any ticker or stock name for detailed market intelligence report for that stock. |
12Stocks.com Performance of Stocks in S&P 500 Index
| Ticker | Stock Name | Watchlist | Category | Recent Price | Smart Investing & Trading Score | Change % | YTD Change% |
| HII | Huntington Ingalls |   | Industrials | 273.15 | 36 | 0.71% | 5.20% |
| NEE | NextEra | | Utilities | 63.83 | 81 | 0.05% | 5.08% |
| HOLX | Hologic | | Health Care | 74.97 | 36 | 0.07% | 4.93% |
| V | Visa | | Financials | 273.04 | 31 | 0.13% | 4.87% |
| LYB | LyondellBasell Industries | | Materials | 99.70 | 51 | 0.00% | 4.86% |
| CDW | CDW | | Technology | 238.18 | 36 | 0.59% | 4.78% |
| PRU | Prudential Financial | | Financials | 108.66 | 43 | 1.22% | 4.77% |
| AJG | Arthur J. | | Financials | 235.57 | 58 | 2.19% | 4.75% |
| BG | Bunge | | Consumer Staples | 105.72 | 93 | 0.28% | 4.72% |
| LEN | Lennar | | Industrials | 156.01 | 43 | 2.72% | 4.68% |
| NOW | ServiceNow | | Technology | 739.06 | 0 | 0.35% | 4.61% |
| ADP | Automatic Data | | Technology | 243.60 | 18 | 0.29% | 4.56% |
| TAP | Molson Coors | | Consumer Staples | 63.99 | 36 | 0.71% | 4.54% |
| CAG | Conagra Brands | | Consumer Staples | 29.93 | 95 | -1.03% | 4.43% |
| FDX | FedEx | | Transports | 263.78 | 36 | 0.27% | 4.27% |
| IFF | Flavors | | Materials | 84.41 | 68 | 1.88% | 4.25% |
| CRM | salesforce.com | | Technology | 274.19 | 18 | -0.77% | 4.20% |
| HBAN | Huntington Bancshares | | Financials | 13.25 | 53 | 0.76% | 4.17% |
| LOW | Lowe s | | Services & Goods | 231.60 | 51 | 1.20% | 4.07% |
| AVY | Avery Dennison | | Consumer Staples | 210.09 | 36 | 0.56% | 3.92% |
| RMD | ResMed | | Health Care | 178.68 | 10 | 2.79% | 3.87% |
| SYY | Sysco | | Consumer Staples | 75.95 | 18 | 0.68% | 3.86% |
| GNRC | Generac Holdings | | Industrials | 134.23 | 63 | 3.06% | 3.86% |
| FOXA | Fox | | Services & Goods | 30.82 | 47 | 1.17% | 3.86% |
| NDAQ | Nasdaq | | Financials | 60.24 | 61 | 0.39% | 3.62% |
| For chart view version of above stock list: Chart View ➞ 0 - 25 , 25 - 50 , 50 - 75 , 75 - 100 , 100 - 125 , 125 - 150 , 150 - 175 , 175 - 200 , 200 - 225 , 225 - 250 , 250 - 275 , 275 - 300 , 300 - 325 , 325 - 350 , 350 - 375 , 375 - 400 , 400 - 425 , 425 - 450 , 450 - 475 | ||
 | Click To Change The Sort Order: By Market Cap or Company Size Performance: Year-to-date, Week and Day |  |
|
Get the most comprehensive stock market coverage daily at 12Stocks.com ➞ Best Stocks Today ➞ Best Stocks Weekly ➞ Best Stocks Year-to-Date ➞ Best Stocks Trends ➞  Best Stocks Today 12Stocks.com Best Nasdaq Stocks ➞ Best S&P 500 Stocks ➞ Best Tech Stocks ➞ Best Biotech Stocks ➞ |
| Detailed Overview of S&P 500 Stocks |
| S&P 500 Technical Overview, Leaders & Laggards, Top S&P 500 ETF Funds & Detailed S&P 500 Stocks List, Charts, Trends & More |
| S&P 500: Technical Analysis, Trends & YTD Performance | |
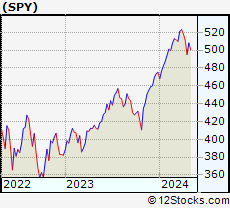
| S&P 500 index as represented by
SPY, an exchange-traded fund [ETF], holds basket of five hundred (mostly largecap) stocks from across all major sectors of the US stock market. The S&P 500 index (contains stocks like Apple and Exxon) is up by 5.9% and is currently outperforming the overall market by 0.85% year-to-date. Below is a quick view of technical charts and trends: | |
 SPY Weekly Chart |
|
| Long Term Trend: Good | |
| Medium Term Trend: Not Good | |
 SPY Daily Chart |
|
| Short Term Trend: Not Good | |
| Overall Trend Score: 44 | |
| YTD Performance: 5.9% | |
| **Trend Scores & Views Are Only For Educational Purposes And Not For Investing | |
| 12Stocks.com: Investing in S&P 500 Index using Exchange Traded Funds | |
|
The following table shows list of key exchange traded funds (ETF) that
help investors track S&P 500 index. The following list also includes leveraged ETF funds that track twice or thrice the daily returns of S&P 500 indices. Short or inverse ETF funds move in the opposite direction to the index they track and are useful during market pullbacks or during bear markets. Quick View: Move mouse or cursor over ETF symbol (ticker) to view short-term technical chart and over ETF name to view long term chart. Click on ticker or stock name for detailed view. Click on to add stock symbol to your watchlist and to view watchlist. |
12Stocks.com List of ETFs that track S&P 500 Index
| Ticker | ETF Name | Watchlist | Recent Price | Smart Investing & Trading Score | Change % | Week % | Year-to-date % |
| SPY | SPDR S&P 500 ETF | | 503.38 | 44 | 0.56 | -1.46 | 5.9% |
| IVV | iShares Core S&P 500 ETF | | 505.72 | 26 | 0.53 | -1.48 | 5.88% |
| VOO | Vanguard 500 ETF | | 462.63 | 26 | 0.57 | -1.48 | 5.91% |
| OEF | iShares S&P 100 | | 239.19 | 44 | 0.53 | -1.62 | 7.07% |
| SSO | ProShares Ultra S&P500 | | 71.43 | 36 | 1.09 | -3.03 | 9.77% |
| UPRO | ProShares UltraPro S&P500 | | 62.23 | 36 | 1.58 | -4.56 | 13.68% |
| SPXL | Direxion Daily S&P500 Bull 3X ETF | | 116.55 | 26 | 0.17 | -5.89 | 12.08% |
| SH | ProShares Short S&P500 | | 12.38 | 69 | -0.48 | 1.56 | -4.7% |
| SDS | ProShares UltraShort S&P500 | | 26.99 | 69 | -1.03 | 3.13 | -9.79% |
| SPXU | ProShares UltraPro Short S&P500 | | 36.49 | 69 | -1.56 | 4.68 | -15.14% |
| SPXS | Direxion Daily S&P 500 Bear 3X ETF | | 9.87 | 69 | -1.40 | 4.78 | -14.55% |
| 12Stocks.com: Charts, Trends, Fundamental Data and Performances of S&P 500 Stocks | |
|
We now take in-depth look at all S&P 500 stocks including charts, multi-period performances and overall trends (as measured by Smart Investing & Trading Score). One can sort S&P 500 stocks (click link to choose) by Daily, Weekly and by Year-to-Date performances. Also, one can sort by size of the company or by market capitalization. |
| Select Your Default Chart Type: | |||||
| |||||
| Click on stock symbol or name for detailed view. Click on to add stock symbol to your watchlist and to view watchlist. Quick View: Move mouse or cursor over "Daily" to quickly view daily technical stock chart and over "Weekly" to view weekly technical stock chart. | |||||

 | HII Huntington Ingalls Industries, Inc. |
| Sector: Industrials | |
| SubSector: Aerospace/Defense Products & Services | |
| MarketCap: 7276.11 Millions | |
| Recent Price: 273.15 Smart Investing & Trading Score: 36 | |
| Day Percent Change: 0.71% Day Change: 1.93 | |
| Week Change: -0.93% Year-to-date Change: 5.2% | |
| HII Links: Profile News Message Board | |
| Charts:- Daily , Weekly | |
| Add HII to Watchlist: View: Get HII Trend Analysis ➞ | |
 | NEE NextEra Energy, Inc. |
| Sector: Utilities | |
| SubSector: Electric Utilities | |
| MarketCap: 108288 Millions | |
| Recent Price: 63.83 Smart Investing & Trading Score: 81 | |
| Day Percent Change: 0.05% Day Change: 0.04 | |
| Week Change: 1.18% Year-to-date Change: 5.1% | |
| NEE Links: Profile News Message Board | |
| Charts:- Daily , Weekly | |
| Add NEE to Watchlist: View: Get NEE Trend Analysis ➞ | |
 | HOLX Hologic, Inc. |
| Sector: Health Care | |
| SubSector: Medical Instruments & Supplies | |
| MarketCap: 9075.2 Millions | |
| Recent Price: 74.97 Smart Investing & Trading Score: 36 | |
| Day Percent Change: 0.07% Day Change: 0.05 | |
| Week Change: -3.05% Year-to-date Change: 4.9% | |
| HOLX Links: Profile News Message Board | |
| Charts:- Daily , Weekly | |
| Add HOLX to Watchlist: View: Get HOLX Trend Analysis ➞ | |
 | V Visa Inc. |
| Sector: Financials | |
| SubSector: Credit Services | |
| MarketCap: 340798 Millions | |
| Recent Price: 273.04 Smart Investing & Trading Score: 31 | |
| Day Percent Change: 0.13% Day Change: 0.35 | |
| Week Change: -1.06% Year-to-date Change: 4.9% | |
| V Links: Profile News Message Board | |
| Charts:- Daily , Weekly | |
| Add V to Watchlist: View: Get V Trend Analysis ➞ | |
 | LYB LyondellBasell Industries N.V. |
| Sector: Materials | |
| SubSector: Specialty Chemicals | |
| MarketCap: 16420.7 Millions | |
| Recent Price: 99.70 Smart Investing & Trading Score: 51 | |
| Day Percent Change: 0.00% Day Change: 0.00 | |
| Week Change: -1.8% Year-to-date Change: 4.9% | |
| LYB Links: Profile News Message Board | |
| Charts:- Daily , Weekly | |
| Add LYB to Watchlist: View: Get LYB Trend Analysis ➞ | |
 | CDW CDW Corporation |
| Sector: Technology | |
| SubSector: Information Technology Services | |
| MarketCap: 12775 Millions | |
| Recent Price: 238.18 Smart Investing & Trading Score: 36 | |
| Day Percent Change: 0.59% Day Change: 1.40 | |
| Week Change: -1.95% Year-to-date Change: 4.8% | |
| CDW Links: Profile News Message Board | |
| Charts:- Daily , Weekly | |
| Add CDW to Watchlist: View: Get CDW Trend Analysis ➞ | |
 | PRU Prudential Financial, Inc. |
| Sector: Financials | |
| SubSector: Life Insurance | |
| MarketCap: 21001.6 Millions | |
| Recent Price: 108.66 Smart Investing & Trading Score: 43 | |
| Day Percent Change: 1.22% Day Change: 1.31 | |
| Week Change: -0.94% Year-to-date Change: 4.8% | |
| PRU Links: Profile News Message Board | |
| Charts:- Daily , Weekly | |
| Add PRU to Watchlist: View: Get PRU Trend Analysis ➞ | |
 | AJG Arthur J. Gallagher & Co. |
| Sector: Financials | |
| SubSector: Insurance Brokers | |
| MarketCap: 14852.2 Millions | |
| Recent Price: 235.57 Smart Investing & Trading Score: 58 | |
| Day Percent Change: 2.19% Day Change: 5.05 | |
| Week Change: 0.42% Year-to-date Change: 4.8% | |
| AJG Links: Profile News Message Board | |
| Charts:- Daily , Weekly | |
| Add AJG to Watchlist: View: Get AJG Trend Analysis ➞ | |
 | BG Bunge Limited |
| Sector: Consumer Staples | |
| SubSector: Farm Products | |
| MarketCap: 4975.77 Millions | |
| Recent Price: 105.72 Smart Investing & Trading Score: 93 | |
| Day Percent Change: 0.28% Day Change: 0.30 | |
| Week Change: 1.87% Year-to-date Change: 4.7% | |
| BG Links: Profile News Message Board | |
| Charts:- Daily , Weekly | |
| Add BG to Watchlist: View: Get BG Trend Analysis ➞ | |
 | LEN Lennar Corporation |
| Sector: Industrials | |
| SubSector: Residential Construction | |
| MarketCap: 11926.6 Millions | |
| Recent Price: 156.01 Smart Investing & Trading Score: 43 | |
| Day Percent Change: 2.72% Day Change: 4.13 | |
| Week Change: -2.43% Year-to-date Change: 4.7% | |
| LEN Links: Profile News Message Board | |
| Charts:- Daily , Weekly | |
| Add LEN to Watchlist: View: Get LEN Trend Analysis ➞ | |
 | NOW ServiceNow, Inc. |
| Sector: Technology | |
| SubSector: Information Technology Services | |
| MarketCap: 53599.1 Millions | |
| Recent Price: 739.06 Smart Investing & Trading Score: 0 | |
| Day Percent Change: 0.35% Day Change: 2.61 | |
| Week Change: -3.86% Year-to-date Change: 4.6% | |
| NOW Links: Profile News Message Board | |
| Charts:- Daily , Weekly | |
| Add NOW to Watchlist: View: Get NOW Trend Analysis ➞ | |
 | ADP Automatic Data Processing, Inc. |
| Sector: Technology | |
| SubSector: Business Software & Services | |
| MarketCap: 54966.5 Millions | |
| Recent Price: 243.60 Smart Investing & Trading Score: 18 | |
| Day Percent Change: 0.29% Day Change: 0.70 | |
| Week Change: -0.1% Year-to-date Change: 4.6% | |
| ADP Links: Profile News Message Board | |
| Charts:- Daily , Weekly | |
| Add ADP to Watchlist: View: Get ADP Trend Analysis ➞ | |
 | TAP Molson Coors Beverage Company |
| Sector: Consumer Staples | |
| SubSector: Beverages - Brewers | |
| MarketCap: 8619.97 Millions | |
| Recent Price: 63.99 Smart Investing & Trading Score: 36 | |
| Day Percent Change: 0.71% Day Change: 0.45 | |
| Week Change: -3.54% Year-to-date Change: 4.5% | |
| TAP Links: Profile News Message Board | |
| Charts:- Daily , Weekly | |
| Add TAP to Watchlist: View: Get TAP Trend Analysis ➞ | |
 | CAG Conagra Brands, Inc. |
| Sector: Consumer Staples | |
| SubSector: Processed & Packaged Goods | |
| MarketCap: 14084.1 Millions | |
| Recent Price: 29.93 Smart Investing & Trading Score: 95 | |
| Day Percent Change: -1.03% Day Change: -0.31 | |
| Week Change: 2.12% Year-to-date Change: 4.4% | |
| CAG Links: Profile News Message Board | |
| Charts:- Daily , Weekly | |
| Add CAG to Watchlist: View: Get CAG Trend Analysis ➞ | |
 | FDX FedEx Corporation |
| Sector: Transports | |
| SubSector: Air Delivery & Freight Services | |
| MarketCap: 33188 Millions | |
| Recent Price: 263.78 Smart Investing & Trading Score: 36 | |
| Day Percent Change: 0.27% Day Change: 0.71 | |
| Week Change: -1.5% Year-to-date Change: 4.3% | |
| FDX Links: Profile News Message Board | |
| Charts:- Daily , Weekly | |
| Add FDX to Watchlist: View: Get FDX Trend Analysis ➞ | |
 | IFF International Flavors & Fragrances Inc. |
| Sector: Materials | |
| SubSector: Specialty Chemicals | |
| MarketCap: 12178.7 Millions | |
| Recent Price: 84.41 Smart Investing & Trading Score: 68 | |
| Day Percent Change: 1.88% Day Change: 1.56 | |
| Week Change: 0.96% Year-to-date Change: 4.3% | |
| IFF Links: Profile News Message Board | |
| Charts:- Daily , Weekly | |
| Add IFF to Watchlist: View: Get IFF Trend Analysis ➞ | |
 | CRM salesforce.com, inc. |
| Sector: Technology | |
| SubSector: Application Software | |
| MarketCap: 137120 Millions | |
| Recent Price: 274.19 Smart Investing & Trading Score: 18 | |
| Day Percent Change: -0.77% Day Change: -2.13 | |
| Week Change: -6.84% Year-to-date Change: 4.2% | |
| CRM Links: Profile News Message Board | |
| Charts:- Daily , Weekly | |
| Add CRM to Watchlist: View: Get CRM Trend Analysis ➞ | |
 | HBAN Huntington Bancshares Incorporated |
| Sector: Financials | |
| SubSector: Regional - Midwest Banks | |
| MarketCap: 8468.1 Millions | |
| Recent Price: 13.25 Smart Investing & Trading Score: 53 | |
| Day Percent Change: 0.76% Day Change: 0.10 | |
| Week Change: -0.45% Year-to-date Change: 4.2% | |
| HBAN Links: Profile News Message Board | |
| Charts:- Daily , Weekly | |
| Add HBAN to Watchlist: View: Get HBAN Trend Analysis ➞ | |
 | LOW Lowe s Companies, Inc. |
| Sector: Services & Goods | |
| SubSector: Home Improvement Stores | |
| MarketCap: 56084.2 Millions | |
| Recent Price: 231.60 Smart Investing & Trading Score: 51 | |
| Day Percent Change: 1.20% Day Change: 2.74 | |
| Week Change: -0.19% Year-to-date Change: 4.1% | |
| LOW Links: Profile News Message Board | |
| Charts:- Daily , Weekly | |
| Add LOW to Watchlist: View: Get LOW Trend Analysis ➞ | |
 | AVY Avery Dennison Corporation |
| Sector: Consumer Staples | |
| SubSector: Business Equipment | |
| MarketCap: 8051.27 Millions | |
| Recent Price: 210.09 Smart Investing & Trading Score: 36 | |
| Day Percent Change: 0.56% Day Change: 1.17 | |
| Week Change: -0.54% Year-to-date Change: 3.9% | |
| AVY Links: Profile News Message Board | |
| Charts:- Daily , Weekly | |
| Add AVY to Watchlist: View: Get AVY Trend Analysis ➞ | |
 | RMD ResMed Inc. |
| Sector: Health Care | |
| SubSector: Medical Instruments & Supplies | |
| MarketCap: 18660.2 Millions | |
| Recent Price: 178.68 Smart Investing & Trading Score: 10 | |
| Day Percent Change: 2.79% Day Change: 4.85 | |
| Week Change: -3.86% Year-to-date Change: 3.9% | |
| RMD Links: Profile News Message Board | |
| Charts:- Daily , Weekly | |
| Add RMD to Watchlist: View: Get RMD Trend Analysis ➞ | |
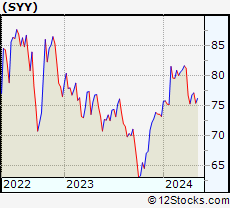 | SYY Sysco Corporation |
| Sector: Consumer Staples | |
| SubSector: Food Wholesale | |
| MarketCap: 22771.9 Millions | |
| Recent Price: 75.95 Smart Investing & Trading Score: 18 | |
| Day Percent Change: 0.68% Day Change: 0.51 | |
| Week Change: 0.93% Year-to-date Change: 3.9% | |
| SYY Links: Profile News Message Board | |
| Charts:- Daily , Weekly | |
| Add SYY to Watchlist: View: Get SYY Trend Analysis ➞ | |
 | GNRC Generac Holdings Inc. |
| Sector: Industrials | |
| SubSector: Diversified Machinery | |
| MarketCap: 5736.26 Millions | |
| Recent Price: 134.23 Smart Investing & Trading Score: 63 | |
| Day Percent Change: 3.06% Day Change: 3.98 | |
| Week Change: 1.87% Year-to-date Change: 3.9% | |
| GNRC Links: Profile News Message Board | |
| Charts:- Daily , Weekly | |
| Add GNRC to Watchlist: View: Get GNRC Trend Analysis ➞ | |
 | FOXA Fox Corporation |
| Sector: Services & Goods | |
| SubSector: Entertainment - Diversified | |
| MarketCap: 13440.7 Millions | |
| Recent Price: 30.82 Smart Investing & Trading Score: 47 | |
| Day Percent Change: 1.17% Day Change: 0.36 | |
| Week Change: 0.24% Year-to-date Change: 3.9% | |
| FOXA Links: Profile News Message Board | |
| Charts:- Daily , Weekly | |
| Add FOXA to Watchlist: View: Get FOXA Trend Analysis ➞ | |
 | NDAQ Nasdaq, Inc. |
| Sector: Financials | |
| SubSector: Diversified Investments | |
| MarketCap: 14885.2 Millions | |
| Recent Price: 60.24 Smart Investing & Trading Score: 61 | |
| Day Percent Change: 0.39% Day Change: 0.23 | |
| Week Change: -2.07% Year-to-date Change: 3.6% | |
| NDAQ Links: Profile News Message Board | |
| Charts:- Daily , Weekly | |
| Add NDAQ to Watchlist: View: Get NDAQ Trend Analysis ➞ | |
| For tabular summary view of above stock list: Summary View ➞ 0 - 25 , 25 - 50 , 50 - 75 , 75 - 100 , 100 - 125 , 125 - 150 , 150 - 175 , 175 - 200 , 200 - 225 , 225 - 250 , 250 - 275 , 275 - 300 , 300 - 325 , 325 - 350 , 350 - 375 , 375 - 400 , 400 - 425 , 425 - 450 , 450 - 475 | ||
| Click To Change The Sort Order: By Market Cap or Company Size Performance: Year-to-date, Week and Day | |
| Select Chart Type: | ||
|
Best Stocks Today 12Stocks.com |
© 2024 12Stocks.com Terms & Conditions Privacy Contact Us
All Information Provided Only For Education And Not To Be Used For Investing or Trading. See Terms & Conditions


One More Thing ... Get Best Stocks Delivered Daily!
Never Ever Miss A Move With Our Top Ten Stocks Lists
Find Best Stocks In Any Market - Bull or Bear Market
Take A Peek At Our Top Ten Stocks Lists: Daily, Weekly, Year-to-Date & Top Trends
Find Best Stocks In Any Market - Bull or Bear Market
Take A Peek At Our Top Ten Stocks Lists: Daily, Weekly, Year-to-Date & Top Trends
S&P 500 Stocks With Best Up Trends [0-bearish to 100-bullish]: Genuine Parts[100], United Airlines[100], Conagra Brands[95], Delta Air[93], Charles Schwab[93], Bunge [93], Lockheed Martin[93], Freeport-McMoRan [88], PepsiCo [85], Progressive [83], Google [83]
Best S&P 500 Stocks Year-to-Date:
NVIDIA [72.44%], Constellation [59.78%], Meta Platforms[44.17%], NRG [40.48%], Micron [35.16%], Western Digital[34.81%], Marathon [33.15%], Progressive [31.69%], Eaton [30.68%], Diamondback [29.89%], Targa Resources[29.2%] Best S&P 500 Stocks This Week:
United Airlines[21.81%], UnitedHealth [13.06%], Genuine Parts[10.85%], American Airlines[7.91%], Southwest Airlines[6.57%], Morgan Stanley[5.34%], Charles Schwab[4.84%], Norwegian Cruise[4.7%], ProShares UltraPro[4.68%], Centene [4.64%], Humana [4.57%] Best S&P 500 Stocks Daily:
Genuine Parts[11.86%], United Airlines[4.46%], Capital One[4.24%], Discover Financial[3.95%], Fair Isaac[3.70%], UnitedHealth [3.67%], Marsh & McLennan[3.63%], Allstate [3.62%], Builders FirstSource[3.39%], Synchrony Financial[3.35%], D.R. Horton[3.31%]