
 Login Sign Up


| |||||
 |  | ||||

| 12Stocks.com Market Intelligence |
Best S&P 500 Stocks
|
On this page, you will find the most comprehensive analysis of S&P 500 stocks and ETFs - from latest trends to performances to charts ➞. First, here are the year-to-date (YTD) performances of the most requested S&P 500 stocks at 12Stocks.com (click stock for review):
| NVIDIA 42% | ||
| Boeing 32% | ||
| Intel 24% | ||
| Microsoft 22% | ||
| Johnson & Johnson 19% | ||
| Gilead 18% | ||
| Goldman Sachs 15% | ||
| Google 13% | ||
| JPMorgan Chase 13% | ||
| Caterpillar 13% | ||
| McDonald s 11% | ||
| Chevron 8% | ||
| Walmart 2% | ||
| Apple 1% | ||
| Amazon.com -5% | ||
| Merck -13% | ||
| Starbucks -18% | ||
| Quick: S&P 500 Stocks Lists: Performances & Trends, S&P 500 Stock Charts
Sort S&P 500 stocks: Daily, Weekly, Year-to-Date, Market Cap & Trends. Filter S&P 500 stocks list by sector: Show all, Tech, Finance, Energy, Staples, Retail, Industrial, Materials, Utilities and HealthCare |
| 12Stocks.com S&P 500 Stocks Performances & Trends Daily Report | |||||||||
|
| 
The overall Smart Investing & Trading Score is 70 (0-bearish to 100-bullish) which puts S&P 500 index in short term neutral to bullish trend. The Smart Investing & Trading Score from previous trading session is 30 and hence an improvement of trend. | ||||||||
Here are the Smart Investing & Trading Scores of the most requested S&P 500 stocks at 12Stocks.com (click stock name for detailed review):
|


| 12Stocks.com: Top Performing S&P 500 Index Stocks | ||||||||||||||||||||||||||||||||||||||||||||||||
 The top performing S&P 500 Index stocks year to date are
Now, more recently, over last week, the top performing S&P 500 Index stocks on the move are


|
||||||||||||||||||||||||||||||||||||||||||||||||
| 12Stocks.com: Investing in S&P 500 Index with Stocks | |
|
The following table helps investors and traders sort through current performance and trends (as measured by Smart Investing & Trading Score) of various
stocks in the S&P 500 Index. Quick View: Move mouse or cursor over stock symbol (ticker) to view short-term technical chart and over stock name to view long term chart. Click on  to add stock symbol to your watchlist and to add stock symbol to your watchlist and  to view watchlist. Click on any ticker or stock name for detailed market intelligence report for that stock. to view watchlist. Click on any ticker or stock name for detailed market intelligence report for that stock. |
12Stocks.com Performance of Stocks in S&P 500 Index
| Ticker | Stock Name | Watchlist | Category | Recent Price | Smart Investing & Trading Score | Change % | Weekly Change% |
| GOOGL |   | Technology | 230.66 | 100 | 9.14% | 8.34% | |
| GOOG | | Technology | 231.1 | 100 | 9.01% | 8.23% | |
| ULTA | Ulta Beauty | | Services & Goods | 532.99 | 70 | 0.09% | 8.17% |
| BIIB | Biogen | | Health Care | 141.62 | 100 | 1.43% | 7.11% |
| WDC | Western Digital | | Technology | 85.36 | 100 | 4.21% | 6.25% |
| RL | Ralph Lauren | | Consumer Staples | 311.51 | 100 | 0.16% | 4.91% |
| CPB | Campbell Soup | | Consumer Staples | 33.28 | 90 | 5.79% | 4.23% |
| FCX | Freeport-McMoRan | | Materials | 46.18 | 100 | 2.76% | 4.01% |
| STX | Seagate | | Technology | 173.83 | 100 | 1.95% | 3.84% |
| CLX | Clorox | | Consumer Staples | 121.88 | 80 | 1.58% | 3.11% |
| NTAP | NetApp | | Technology | 115.97 | 90 | 0.52% | 2.82% |
| CNC | Centene | | Health Care | 29.85 | 70 | 0.78% | 2.79% |
| GLW | Corning | | Technology | 68.89 | 100 | 0.61% | 2.77% |
| AAPL | Apple | | Technology | 238.47 | 100 | 3.81% | 2.73% |
| FSLR | First Solar | | Technology | 200.27 | 90 | 2.29% | 2.60% |
| HUM | Humana | | Health Care | 311.43 | 100 | 0.44% | 2.56% |
| WMT | Walmart | | Services & Goods | 99.44 | 60 | 1.62% | 2.54% |
| ROST | Ross Stores | | Services & Goods | 150.84 | 90 | -0.27% | 2.50% |
| INCY | Incyte | | Health Care | 86.6 | 90 | 0.72% | 2.35% |
| TTWO | Take-Two Interactive | | Technology | 238.05 | 90 | -1.20% | 2.05% |
| DPZ | Domino s | | Services & Goods | 467.64 | 80 | 0.07% | 2.04% |
| VLO | Valero | | Energy | 155.04 | 100 | 0.49% | 1.99% |
| TJX | TJX | | Services & Goods | 139.29 | 100 | 0.52% | 1.96% |
| TPR | Tapestry | | Consumer Staples | 103.68 | 80 | 0.87% | 1.83% |
| PHM | Pulte | | Industrials | 134.15 | 90 | 1.56% | 1.61% |
| For chart view version of above stock list: Chart View ➞ 0 - 25 , 25 - 50 , 50 - 75 , 75 - 100 , 100 - 125 , 125 - 150 , 150 - 175 , 175 - 200 , 200 - 225 , 225 - 250 , 250 - 275 , 275 - 300 , 300 - 325 , 325 - 350 , 350 - 375 , 375 - 400 , 400 - 425 , 425 - 450 , 450 - 475 , 475 - 500 | ||
 | Click To Change The Sort Order: By Market Cap or Company Size Performance: Year-to-date, Week and Day |  |
|
Get the most comprehensive stock market coverage daily at 12Stocks.com ➞ Best Stocks Today ➞ Best Stocks Weekly ➞ Best Stocks Year-to-Date ➞ Best Stocks Trends ➞  Best Stocks Today 12Stocks.com Best Nasdaq Stocks ➞ Best S&P 500 Stocks ➞ Best Tech Stocks ➞ Best Biotech Stocks ➞ |
| Detailed Overview of S&P 500 Stocks |
| S&P 500 Technical Overview, Leaders & Laggards, Top S&P 500 ETF Funds & Detailed S&P 500 Stocks List, Charts, Trends & More |
| S&P 500: Technical Analysis, Trends & YTD Performance | |
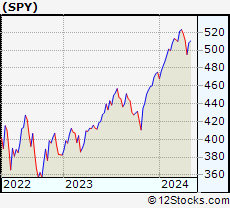
| S&P 500 index as represented by
SPY, an exchange-traded fund [ETF], holds basket of five hundred (mostly largecap) stocks from across all major sectors of the US stock market. The S&P 500 index (contains stocks like Apple and Exxon) is up by 7.61% and is currently outperforming the overall market by 0.64% year-to-date. Below is a quick view of technical charts and trends: | |
 SPY Weekly Chart |
|
| Long Term Trend: Very Good | |
| Medium Term Trend: Very Good | |
 SPY Daily Chart |
|
| Short Term Trend: Not Good | |
| Overall Trend Score: 70 | |
| YTD Performance: 7.61% | |
| **Trend Scores & Views Are Only For Educational Purposes And Not For Investing | |
| 12Stocks.com: Investing in S&P 500 Index using Exchange Traded Funds | |
|
The following table shows list of key exchange traded funds (ETF) that
help investors track S&P 500 index. The following list also includes leveraged ETF funds that track twice or thrice the daily returns of S&P 500 indices. Short or inverse ETF funds move in the opposite direction to the index they track and are useful during market pullbacks or during bear markets. Quick View: Move mouse or cursor over ETF symbol (ticker) to view short-term technical chart and over ETF name to view long term chart. Click on ticker or stock name for detailed view. Click on to add stock symbol to your watchlist and to view watchlist. |
12Stocks.com List of ETFs that track S&P 500 Index
| Ticker | ETF Name | Watchlist | Recent Price | Smart Investing & Trading Score | Change % | Week % | Year-to-date % |
| SPY | SPDR S&P 500 ETF | | 643.74 | 70 | 0.54 | -0.2 | 7.61% |
| IVV | iShares Core S&P 500 ETF | | 648.32 | 70 | -0.39 | -1.45 | 9.17% |
| VOO | Vanguard 500 ETF | | 593.08 | 70 | -0.39 | -1.45 | 9.15% |
| OEF | iShares S&P 100 | | 319.69 | 60 | 1.47 | -0.41 | 8.89% |
| SSO | ProShares Ultra S&P500 | | 104.75 | 60 | 1.02 | -0.5 | 8.55% |
| UPRO | ProShares UltraPro S&P500 | | 100.87 | 60 | 1.5 | -0.75 | 7.19% |
| SPXL | Direxion Daily S&P500 Bull 3X ETF | | 193.01 | 60 | -1.22 | -4.54 | 10.56% |
| SH | ProShares Short S&P500 | | 38.59 | 50 | -0.46 | 0.29 | -5.35% |
| SDS | ProShares UltraShort S&P500 | | 15.62 | 60 | -0.95 | 0.45 | -14.99% |
| SPXU | ProShares UltraPro Short S&P500 | | 15.17 | 60 | -1.49 | 0.8 | -25.94% |
| SPXS | Direxion Daily S&P 500 Bear 3X ETF | | 4.21 | 60 | 1.38 | 5.01 | -28.57% |
| 12Stocks.com: Charts, Trends, Fundamental Data and Performances of S&P 500 Stocks | |
|
We now take in-depth look at all S&P 500 stocks including charts, multi-period performances and overall trends (as measured by Smart Investing & Trading Score). One can sort S&P 500 stocks (click link to choose) by Daily, Weekly and by Year-to-Date performances. Also, one can sort by size of the company or by market capitalization. |
| Select Your Default Chart Type: | |||||
| |||||
| Click on stock symbol or name for detailed view. Click on to add stock symbol to your watchlist and to view watchlist. Quick View: Move mouse or cursor over "Daily" to quickly view daily technical stock chart and over "Weekly" to view weekly technical stock chart. | |||||

 | GOOGL Alphabet Inc. |
| Sector: Technology | |
| SubSector: Internet Information Providers | |
| MarketCap: 801264 Millions | |
| Recent Price: 230.66 Smart Investing & Trading Score: 100 | |
| Day Percent Change: 9.14% Day Change: 19.31 | |
| Week Change: 8.34% Year-to-date Change: 13.3% | |
| GOOGL Links: Profile News Message Board | |
| Charts:- Daily , Weekly | |
| Add GOOGL to Watchlist: View: Get GOOGL Trend Analysis ➞ | |
 | GOOG Alphabet Inc. |
| Sector: Technology | |
| SubSector: Internet Information Providers | |
| MarketCap: 730159 Millions | |
| Recent Price: 231.1 Smart Investing & Trading Score: 100 | |
| Day Percent Change: 9.01% Day Change: 19.11 | |
| Week Change: 8.23% Year-to-date Change: 12.7% | |
| GOOG Links: Profile News Message Board | |
| Charts:- Daily , Weekly | |
| Add GOOG to Watchlist: View: Get GOOG Trend Analysis ➞ | |
 | ULTA Ulta Beauty, Inc. |
| Sector: Services & Goods | |
| SubSector: Specialty Retail, Other | |
| MarketCap: 9429.94 Millions | |
| Recent Price: 532.99 Smart Investing & Trading Score: 70 | |
| Day Percent Change: 0.09% Day Change: 0.47 | |
| Week Change: 8.17% Year-to-date Change: 29.3% | |
| ULTA Links: Profile News Message Board | |
| Charts:- Daily , Weekly | |
| Add ULTA to Watchlist: View: Get ULTA Trend Analysis ➞ | |
 | BIIB Biogen Inc. |
| Sector: Health Care | |
| SubSector: Biotechnology | |
| MarketCap: 53102.6 Millions | |
| Recent Price: 141.62 Smart Investing & Trading Score: 100 | |
| Day Percent Change: 1.43% Day Change: 1.99 | |
| Week Change: 7.11% Year-to-date Change: -1.6% | |
| BIIB Links: Profile News Message Board | |
| Charts:- Daily , Weekly | |
| Add BIIB to Watchlist: View: Get BIIB Trend Analysis ➞ | |
 | WDC Western Digital Corporation |
| Sector: Technology | |
| SubSector: Data Storage Devices | |
| MarketCap: 10712.9 Millions | |
| Recent Price: 85.36 Smart Investing & Trading Score: 100 | |
| Day Percent Change: 4.21% Day Change: 3.45 | |
| Week Change: 6.25% Year-to-date Change: 73.7% | |
| WDC Links: Profile News Message Board | |
| Charts:- Daily , Weekly | |
| Add WDC to Watchlist: View: Get WDC Trend Analysis ➞ | |
 | RL Ralph Lauren Corporation |
| Sector: Consumer Staples | |
| SubSector: Textile - Apparel Clothing | |
| MarketCap: 5589.95 Millions | |
| Recent Price: 311.51 Smart Investing & Trading Score: 100 | |
| Day Percent Change: 0.16% Day Change: 0.49 | |
| Week Change: 4.91% Year-to-date Change: 25.6% | |
| RL Links: Profile News Message Board | |
| Charts:- Daily , Weekly | |
| Add RL to Watchlist: View: Get RL Trend Analysis ➞ | |
 | CPB Campbell Soup Company |
| Sector: Consumer Staples | |
| SubSector: Processed & Packaged Goods | |
| MarketCap: 14468.8 Millions | |
| Recent Price: 33.28 Smart Investing & Trading Score: 90 | |
| Day Percent Change: 5.79% Day Change: 1.82 | |
| Week Change: 4.23% Year-to-date Change: -12.2% | |
| CPB Links: Profile News Message Board | |
| Charts:- Daily , Weekly | |
| Add CPB to Watchlist: View: Get CPB Trend Analysis ➞ | |
 | FCX Freeport-McMoRan Inc. |
| Sector: Materials | |
| SubSector: Copper | |
| MarketCap: 9070.57 Millions | |
| Recent Price: 46.18 Smart Investing & Trading Score: 100 | |
| Day Percent Change: 2.76% Day Change: 1.24 | |
| Week Change: 4.01% Year-to-date Change: 29.8% | |
| FCX Links: Profile News Message Board | |
| Charts:- Daily , Weekly | |
| Add FCX to Watchlist: View: Get FCX Trend Analysis ➞ | |
 | STX Seagate Technology plc |
| Sector: Technology | |
| SubSector: Data Storage Devices | |
| MarketCap: 10814.7 Millions | |
| Recent Price: 173.83 Smart Investing & Trading Score: 100 | |
| Day Percent Change: 1.95% Day Change: 3.33 | |
| Week Change: 3.84% Year-to-date Change: 82.8% | |
| STX Links: Profile News Message Board | |
| Charts:- Daily , Weekly | |
| Add STX to Watchlist: View: Get STX Trend Analysis ➞ | |
 | CLX The Clorox Company |
| Sector: Consumer Staples | |
| SubSector: Housewares & Accessories | |
| MarketCap: 23688.3 Millions | |
| Recent Price: 121.88 Smart Investing & Trading Score: 80 | |
| Day Percent Change: 1.58% Day Change: 1.9 | |
| Week Change: 3.11% Year-to-date Change: -22.5% | |
| CLX Links: Profile News Message Board | |
| Charts:- Daily , Weekly | |
| Add CLX to Watchlist: View: Get CLX Trend Analysis ➞ | |
 | NTAP NetApp, Inc. |
| Sector: Technology | |
| SubSector: Data Storage Devices | |
| MarketCap: 9028.89 Millions | |
| Recent Price: 115.97 Smart Investing & Trading Score: 90 | |
| Day Percent Change: 0.52% Day Change: 0.6 | |
| Week Change: 2.82% Year-to-date Change: -4.0% | |
| NTAP Links: Profile News Message Board | |
| Charts:- Daily , Weekly | |
| Add NTAP to Watchlist: View: Get NTAP Trend Analysis ➞ | |
 | CNC Centene Corporation |
| Sector: Health Care | |
| SubSector: Health Care Plans | |
| MarketCap: 29075 Millions | |
| Recent Price: 29.85 Smart Investing & Trading Score: 70 | |
| Day Percent Change: 0.78% Day Change: 0.23 | |
| Week Change: 2.79% Year-to-date Change: -53.4% | |
| CNC Links: Profile News Message Board | |
| Charts:- Daily , Weekly | |
| Add CNC to Watchlist: View: Get CNC Trend Analysis ➞ | |
 | GLW Corning Incorporated |
| Sector: Technology | |
| SubSector: Diversified Electronics | |
| MarketCap: 16287.6 Millions | |
| Recent Price: 68.89 Smart Investing & Trading Score: 100 | |
| Day Percent Change: 0.61% Day Change: 0.42 | |
| Week Change: 2.77% Year-to-date Change: 33.8% | |
| GLW Links: Profile News Message Board | |
| Charts:- Daily , Weekly | |
| Add GLW to Watchlist: View: Get GLW Trend Analysis ➞ | |
 | AAPL Apple Inc. |
| Sector: Technology | |
| SubSector: Electronic Equipment | |
| MarketCap: 1112940 Millions | |
| Recent Price: 238.47 Smart Investing & Trading Score: 100 | |
| Day Percent Change: 3.81% Day Change: 8.75 | |
| Week Change: 2.73% Year-to-date Change: 1.4% | |
| AAPL Links: Profile News Message Board | |
| Charts:- Daily , Weekly | |
| Add AAPL to Watchlist: View: Get AAPL Trend Analysis ➞ | |
 | FSLR First Solar, Inc. |
| Sector: Technology | |
| SubSector: Semiconductor - Specialized | |
| MarketCap: 3617.9 Millions | |
| Recent Price: 200.27 Smart Investing & Trading Score: 90 | |
| Day Percent Change: 2.29% Day Change: 4.49 | |
| Week Change: 2.6% Year-to-date Change: 19.6% | |
| FSLR Links: Profile News Message Board | |
| Charts:- Daily , Weekly | |
| Add FSLR to Watchlist: View: Get FSLR Trend Analysis ➞ | |
 | HUM Humana Inc. |
| Sector: Health Care | |
| SubSector: Health Care Plans | |
| MarketCap: 34125.6 Millions | |
| Recent Price: 311.43 Smart Investing & Trading Score: 100 | |
| Day Percent Change: 0.44% Day Change: 1.37 | |
| Week Change: 2.56% Year-to-date Change: 7.0% | |
| HUM Links: Profile News Message Board | |
| Charts:- Daily , Weekly | |
| Add HUM to Watchlist: View: Get HUM Trend Analysis ➞ | |
 | WMT Walmart Inc. |
| Sector: Services & Goods | |
| SubSector: Discount, Variety Stores | |
| MarketCap: 355610 Millions | |
| Recent Price: 99.44 Smart Investing & Trading Score: 60 | |
| Day Percent Change: 1.62% Day Change: 1.59 | |
| Week Change: 2.54% Year-to-date Change: 1.8% | |
| WMT Links: Profile News Message Board | |
| Charts:- Daily , Weekly | |
| Add WMT to Watchlist: View: Get WMT Trend Analysis ➞ | |
 | ROST Ross Stores, Inc. |
| Sector: Services & Goods | |
| SubSector: Apparel Stores | |
| MarketCap: 24938.8 Millions | |
| Recent Price: 150.84 Smart Investing & Trading Score: 90 | |
| Day Percent Change: -0.27% Day Change: -0.41 | |
| Week Change: 2.5% Year-to-date Change: 0.8% | |
| ROST Links: Profile News Message Board | |
| Charts:- Daily , Weekly | |
| Add ROST to Watchlist: View: Get ROST Trend Analysis ➞ | |
 | INCY Incyte Corporation |
| Sector: Health Care | |
| SubSector: Biotechnology | |
| MarketCap: 15343.2 Millions | |
| Recent Price: 86.6 Smart Investing & Trading Score: 90 | |
| Day Percent Change: 0.72% Day Change: 0.62 | |
| Week Change: 2.35% Year-to-date Change: 16.8% | |
| INCY Links: Profile News Message Board | |
| Charts:- Daily , Weekly | |
| Add INCY to Watchlist: View: Get INCY Trend Analysis ➞ | |
 | TTWO Take-Two Interactive Software, Inc. |
| Sector: Technology | |
| SubSector: Multimedia & Graphics Software | |
| MarketCap: 12479.6 Millions | |
| Recent Price: 238.05 Smart Investing & Trading Score: 90 | |
| Day Percent Change: -1.2% Day Change: -2.9 | |
| Week Change: 2.05% Year-to-date Change: 28.3% | |
| TTWO Links: Profile News Message Board | |
| Charts:- Daily , Weekly | |
| Add TTWO to Watchlist: View: Get TTWO Trend Analysis ➞ | |
 | DPZ Domino s Pizza, Inc. |
| Sector: Services & Goods | |
| SubSector: Restaurants | |
| MarketCap: 12166 Millions | |
| Recent Price: 467.64 Smart Investing & Trading Score: 80 | |
| Day Percent Change: 0.07% Day Change: 0.34 | |
| Week Change: 2.04% Year-to-date Change: 5.0% | |
| DPZ Links: Profile News Message Board | |
| Charts:- Daily , Weekly | |
| Add DPZ to Watchlist: View: Get DPZ Trend Analysis ➞ | |
 | VLO Valero Energy Corporation |
| Sector: Energy | |
| SubSector: Oil & Gas Refining & Marketing | |
| MarketCap: 19590.5 Millions | |
| Recent Price: 155.04 Smart Investing & Trading Score: 100 | |
| Day Percent Change: 0.49% Day Change: 0.76 | |
| Week Change: 1.99% Year-to-date Change: 18.5% | |
| VLO Links: Profile News Message Board | |
| Charts:- Daily , Weekly | |
| Add VLO to Watchlist: View: Get VLO Trend Analysis ➞ | |
 | TJX The TJX Companies, Inc. |
| Sector: Services & Goods | |
| SubSector: Department Stores | |
| MarketCap: 50656.2 Millions | |
| Recent Price: 139.29 Smart Investing & Trading Score: 100 | |
| Day Percent Change: 0.52% Day Change: 0.72 | |
| Week Change: 1.96% Year-to-date Change: 12.3% | |
| TJX Links: Profile News Message Board | |
| Charts:- Daily , Weekly | |
| Add TJX to Watchlist: View: Get TJX Trend Analysis ➞ | |
 | TPR Tapestry, Inc. |
| Sector: Consumer Staples | |
| SubSector: Textile - Apparel Footwear & Accessories | |
| MarketCap: 3890.1 Millions | |
| Recent Price: 103.68 Smart Investing & Trading Score: 80 | |
| Day Percent Change: 0.87% Day Change: 0.89 | |
| Week Change: 1.83% Year-to-date Change: 43.4% | |
| TPR Links: Profile News Message Board | |
| Charts:- Daily , Weekly | |
| Add TPR to Watchlist: View: Get TPR Trend Analysis ➞ | |
 | PHM PulteGroup, Inc. |
| Sector: Industrials | |
| SubSector: Residential Construction | |
| MarketCap: 6186.46 Millions | |
| Recent Price: 134.15 Smart Investing & Trading Score: 90 | |
| Day Percent Change: 1.56% Day Change: 2.06 | |
| Week Change: 1.61% Year-to-date Change: 18.4% | |
| PHM Links: Profile News Message Board | |
| Charts:- Daily , Weekly | |
| Add PHM to Watchlist: View: Get PHM Trend Analysis ➞ | |
| For tabular summary view of above stock list: Summary View ➞ 0 - 25 , 25 - 50 , 50 - 75 , 75 - 100 , 100 - 125 , 125 - 150 , 150 - 175 , 175 - 200 , 200 - 225 , 225 - 250 , 250 - 275 , 275 - 300 , 300 - 325 , 325 - 350 , 350 - 375 , 375 - 400 , 400 - 425 , 425 - 450 , 450 - 475 , 475 - 500 | ||
| Click To Change The Sort Order: By Market Cap or Company Size Performance: Year-to-date, Week and Day | |
| Select Chart Type: | ||
|
Best Stocks Today 12Stocks.com |
© 2025 12Stocks.com Terms & Conditions Privacy Contact Us
All Information Provided Only For Education And Not To Be Used For Investing or Trading. See Terms & Conditions


One More Thing ... Get Best Stocks Delivered Daily!
Never Ever Miss A Move With Our Top Ten Stocks Lists
Find Best Stocks In Any Market - Bull or Bear Market
Take A Peek At Our Top Ten Stocks Lists: Daily, Weekly, Year-to-Date & Top Trends
Find Best Stocks In Any Market - Bull or Bear Market
Take A Peek At Our Top Ten Stocks Lists: Daily, Weekly, Year-to-Date & Top Trends
S&P 500 Stocks With Best Up Trends [0-bearish to 100-bullish]: Google [100], Google [100], Western Digital[100], Apple [100], Freeport-McMoRan [100], Seagate [100], Biogen [100], United Airlines[100], Boston Properties[100], Corning [100], Kimco Realty[100]
Best S&P 500 Stocks Year-to-Date:
Seagate [82.84%], Newmont [78.44%], Western Digital[73.72%], Dollar General[55.87%], Amphenol [54.97%], IDEXX [48.98%], Wynn Resorts[45.3%], NRG [44.44%], Tapestry [43.39%], NVIDIA [42.12%], Hasbro [39.88%] Best S&P 500 Stocks This Week:
Google [8.34%], Google [8.23%], Ulta Beauty[8.17%], Biogen [7.11%], Western Digital[6.25%], Ralph Lauren[4.91%], Campbell Soup[4.23%], Freeport-McMoRan [4.01%], Seagate [3.84%], Clorox [3.11%], NetApp [2.82%] Best S&P 500 Stocks Daily:
Google [9.14%], Google [9.01%], Campbell Soup[5.79%], Western Digital[4.21%], Apple [3.81%], Kraft Heinz[3.5%], DexCom [2.83%], Freeport-McMoRan [2.76%], First Solar[2.29%], Norwegian Cruise[2.02%], J. M.[2%]