
 Login Sign Up


| |||||
 |  | ||||

| 12Stocks.com Market Intelligence |
Best Healthcare Stocks
 | "Discover best trending healthcare stocks with 12Stocks.com." |
| - Subu Vdaygiri, Founder, 12Stocks.com |
| In a hurry? Healthcare Stocks Lists: Performance Trends Table, Stock Charts
Sort Healthcare stocks: Daily, Weekly, Year-to-Date, Market Cap & Trends. Filter Healthcare stocks list by size:All Healthcare Large Mid-Range Small |
| 12Stocks.com Healthcare Stocks Performances & Trends Daily | |||||||||
|
|  The overall Smart Investing & Trading Score is 57 (0-bearish to 100-bullish) which puts Healthcare sector in short term neutral trend. The Smart Investing & Trading Score from previous trading session is 60 and a deterioration of trend continues.
| ||||||||
Here are the Smart Investing & Trading Scores of the most requested Healthcare stocks at 12Stocks.com (click stock name for detailed review):
|


| 12Stocks.com: Investing in Healthcare sector with Stocks | |
|
The following table helps investors and traders sort through current performance and trends (as measured by Smart Investing & Trading Score) of various
stocks in the Healthcare sector. Quick View: Move mouse or cursor over stock symbol (ticker) to view short-term Technical chart and over stock name to view long term chart. Click on  to add stock symbol to your watchlist and to add stock symbol to your watchlist and  to view watchlist. Click on any ticker or stock name for detailed market intelligence report for that stock. to view watchlist. Click on any ticker or stock name for detailed market intelligence report for that stock. |
12Stocks.com Performance of Stocks in Healthcare Sector
| Ticker | Stock Name | Watchlist | Category | Recent Price | Smart Investing & Trading Score | Change % | YTD Change% |
| FBIO | Fortress Biotech |   | Biotechnology | 1.80 | 24 | 3.45% | -40.20% |
| RPRX | Royalty Pharma | | Biotechnology | 28.76 | 24 | 2.46% | 2.39% |
| ELAN | Elanco Animal | | Pharmaceutical | 13.47 | 24 | 2.43% | -9.60% |
| AIQ | Alliance | | Laboratories | 32.71 | 24 | 2.31% | 4.91% |
| RCUS | Arcus Biosciences | | Biotechnology | 15.50 | 24 | 0.00% | -18.85% |
| ANNX | Annexon | | Biotechnology | 4.66 | 24 | -1.89% | 2.19% |
| INBX | Inhibrx | | Biotechnology | 34.01 | 24 | -0.85% | -10.52% |
| ITGR | Integer | | Equipment | 109.92 | 23 | 0.13% | 10.94% |
| DOCS | Doximity | | Health Information | 24.15 | 23 | -0.27% | -15.05% |
| HRTX | Heron | | Biotechnology | 2.55 | 22 | 8.97% | 50.00% |
| NVRO | Nevro | | Equipment | 11.15 | 22 | 7.11% | -48.19% |
| PRLD | Prelude | | Biotechnology | 3.99 | 22 | 6.97% | -8.28% |
| ZCMD | Zhongchao | | Health Information | 1.75 | 22 | 6.36% | 380.69% |
| OSUR | OraSure Technologies | | Instruments | 5.48 | 22 | 2.81% | -33.17% |
| ALLO | Allogene | | Biotechnology | 2.97 | 22 | 1.71% | -7.48% |
| NEOG | Neogen | | Diagnostic | 12.45 | 22 | 1.63% | -38.09% |
| GLMD | Galmed | | Biotechnology | 0.39 | 22 | 1.47% | -13.67% |
| TAK | Takeda | | Pharmaceutical | 13.27 | 22 | 0.61% | -7.01% |
| IPSC | Century | | Biotechnology | 2.96 | 22 | -2.31% | -10.15% |
| DNA | Ginkgo Bioworks | | Biotechnology | 0.83 | 22 | -1.00% | -50.38% |
| BLUE | bluebird bio | | Biotechnology | 0.90 | 22 | -0.66% | -34.54% |
| CIVI | Civitas | | Long-Term | 70.55 | 22 | -0.30% | 3.17% |
| ADTX | ADiTx | | Biotechnology | 2.47 | 20 | 2.49% | -62.35% |
| HROW | Harrow Health | | Pharmaceutical | 10.64 | 20 | 2.01% | -5.00% |
| SIBN | SI-BONE | | Equipment | 14.61 | 20 | 0.69% | -30.40% |
| For chart view version of above stock list: Chart View ➞ 0 - 25 , 25 - 50 , 50 - 75 , 75 - 100 , 100 - 125 , 125 - 150 , 150 - 175 , 175 - 200 , 200 - 225 , 225 - 250 , 250 - 275 , 275 - 300 , 300 - 325 , 325 - 350 , 350 - 375 , 375 - 400 , 400 - 425 , 425 - 450 , 450 - 475 , 475 - 500 , 500 - 525 , 525 - 550 , 550 - 575 , 575 - 600 , 600 - 625 , 625 - 650 , 650 - 675 , 675 - 700 , 700 - 725 | ||
 | Click To Change The Sort Order: By Market Cap or Company Size Performance: Year-to-date, Week and Day |  |
|
Get the most comprehensive stock market coverage daily at 12Stocks.com ➞ Best Stocks Today ➞ Best Stocks Weekly ➞ Best Stocks Year-to-Date ➞ Best Stocks Trends ➞  Best Stocks Today 12Stocks.com Best Nasdaq Stocks ➞ Best S&P 500 Stocks ➞ Best Tech Stocks ➞ Best Biotech Stocks ➞ |
| Detailed Overview of Healthcare Stocks |
| Healthcare Technical Overview, Leaders & Laggards, Top Healthcare ETF Funds & Detailed Healthcare Stocks List, Charts, Trends & More |
| Healthcare Sector: Technical Analysis, Trends & YTD Performance | |
| Healthcare sector is composed of stocks
from pharmaceutical, biotech, diagnostics labs, insurance providers
and healthcare services. Healthcare sector, as represented by XLV, an exchange-traded fund [ETF] that holds basket of Healthcare stocks (e.g, Merck, Amgen) is up by 3.01% and is currently underperforming the overall market by -2.61% year-to-date. Below is a quick view of Technical charts and trends: |
|
 XLV Weekly Chart |
|
| Long Term Trend: Not Good | |
| Medium Term Trend: Good | |
 XLV Daily Chart |
|
| Short Term Trend: Very Good | |
| Overall Trend Score: 57 | |
| YTD Performance: 3.01% | |
| **Trend Scores & Views Are Only For Educational Purposes And Not For Investing | |
| 12Stocks.com: Top Performing Healthcare Sector Stocks | ||||||||||||||||||||||||||||||||||||||||||||||||
 The top performing Healthcare sector stocks year to date are
Now, more recently, over last week, the top performing Healthcare sector stocks on the move are


|
||||||||||||||||||||||||||||||||||||||||||||||||
| 12Stocks.com: Investing in Healthcare Sector using Exchange Traded Funds | |
|
The following table shows list of key exchange traded funds (ETF) that
help investors track Healthcare Index. For detailed view, check out our ETF Funds section of our website. Quick View: Move mouse or cursor over ETF symbol (ticker) to view short-term Technical chart and over ETF name to view long term chart. Click on ticker or stock name for detailed view. Click on to add stock symbol to your watchlist and to view watchlist. |
12Stocks.com List of ETFs that track Healthcare Index
| Ticker | ETF Name | Watchlist | Recent Price | Smart Investing & Trading Score | Change % | Week % | Year-to-date % |
| XLV | Health Care | | 140.48 | 57 | -0.07 | 0.37 | 3.01% |
| XBI | Biotech | | 88.34 | 50 | 1.16 | 5.81 | -1.06% |
| IBB | Biotechnology | | 130.65 | 64 | 0.90 | 3.29 | -3.83% |
| BBH | Biotech | | 160.51 | 64 | 1.18 | 3.12 | -2.9% |
| VHT | Health Care | | 257.14 | 37 | -0.05 | 0.71 | 2.57% |
| IYH | Healthcare | | 59.12 | 37 | -0.10 | 0.87 | 3.27% |
| IHF | Healthcare Providers | | 51.65 | 15 | 0.41 | -0.52 | -1.64% |
| IHI | Medical Devices | | 55.16 | 0 | 0.25 | -0.67 | 2.2% |
| BIB | Biotechnology | | 53.80 | 69 | 2.32 | 8.34 | -5.7% |
| BIS | Short Biotech | | 18.66 | 36 | -2.36 | -7.72 | 3.26% |
| XHE | Health Care Equipment | | 84.89 | 47 | 1.16 | 2.98 | 0.75% |
| CURE | Healthcare Bull 3X | | 105.81 | 35 | -0.70 | 0.48 | 4% |
| LABU | Biotech Bull 3X | | 102.99 | 42 | 3.19 | 17.69 | -15.56% |
| LABD | Biotech Bear 3X | | 8.76 | 44 | -2.99 | -16.73 | -9.6% |
| PSCH | SmallCap Health Care | | 42.05 | 30 | 1.33 | 3.32 | -1.75% |
| XHS | Health Care Services | | 88.14 | 27 | -0.19 | 0.31 | -0.91% |
| PTH | DWA Healthcare Momentum | | 41.74 | 22 | 1.14 | 4.64 | 6.64% |
| BTEC | Principal Healthcare Innovators | | 35.98 | 42 | 0.25 | 5.07 | -0.95% |
| RXL | Health Care | | 95.21 | 54 | -0.12 | 0.41 | 4.16% |
| RXD | Short Health Care | | 11.34 | 49 | -0.18 | -0.96 | -4.91% |
| 12Stocks.com: Charts, Trends, Fundamental Data and Performances of Healthcare Stocks | |
|
We now take in-depth look at all Healthcare stocks including charts, multi-period performances and overall trends (as measured by Smart Investing & Trading Score). One can sort Healthcare stocks (click link to choose) by Daily, Weekly and by Year-to-Date performances. Also, one can sort by size of the company or by market capitalization. |
| Select Your Default Chart Type: | |||||
| |||||
| Click on stock symbol or name for detailed view. Click on to add stock symbol to your watchlist and to view watchlist. Quick View: Move mouse or cursor over "Daily" to quickly view daily Technical stock chart and over "Weekly" to view weekly Technical stock chart. | |||||

 | FBIO Fortress Biotech, Inc. |
| Sector: Health Care | |
| SubSector: Biotechnology | |
| MarketCap: 116.885 Millions | |
| Recent Price: 1.80 Smart Investing & Trading Score: 24 | |
| Day Percent Change: 3.45% Day Change: 0.06 | |
| Week Change: 4.65% Year-to-date Change: -40.2% | |
| FBIO Links: Profile News Message Board | |
| Charts:- Daily , Weekly | |
| Add FBIO to Watchlist: View: Get Complete FBIO Trend Analysis ➞ | |
 | RPRX Royalty Pharma plc |
| Sector: Health Care | |
| SubSector: Biotechnology | |
| MarketCap: 28457 Millions | |
| Recent Price: 28.76 Smart Investing & Trading Score: 24 | |
| Day Percent Change: 2.46% Day Change: 0.69 | |
| Week Change: 2.71% Year-to-date Change: 2.4% | |
| RPRX Links: Profile News Message Board | |
| Charts:- Daily , Weekly | |
| Add RPRX to Watchlist: View: Get Complete RPRX Trend Analysis ➞ | |
 | ELAN Elanco Animal Health Incorporated |
| Sector: Health Care | |
| SubSector: Drugs - Generic | |
| MarketCap: 7752.15 Millions | |
| Recent Price: 13.47 Smart Investing & Trading Score: 24 | |
| Day Percent Change: 2.43% Day Change: 0.32 | |
| Week Change: 1.58% Year-to-date Change: -9.6% | |
| ELAN Links: Profile News Message Board | |
| Charts:- Daily , Weekly | |
| Add ELAN to Watchlist: View: Get Complete ELAN Trend Analysis ➞ | |
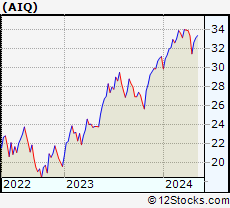 | AIQ Alliance Healthcare Services, Inc. |
| Sector: Health Care | |
| SubSector: Medical Laboratories & Research | |
| MarketCap: 105.79 Millions | |
| Recent Price: 32.71 Smart Investing & Trading Score: 24 | |
| Day Percent Change: 2.31% Day Change: 0.74 | |
| Week Change: 0.18% Year-to-date Change: 4.9% | |
| AIQ Links: Profile News Message Board | |
| Charts:- Daily , Weekly | |
| Add AIQ to Watchlist: View: Get Complete AIQ Trend Analysis ➞ | |
 | RCUS Arcus Biosciences, Inc. |
| Sector: Health Care | |
| SubSector: Biotechnology | |
| MarketCap: 539.285 Millions | |
| Recent Price: 15.50 Smart Investing & Trading Score: 24 | |
| Day Percent Change: 0.00% Day Change: 0.00 | |
| Week Change: -0.32% Year-to-date Change: -18.9% | |
| RCUS Links: Profile News Message Board | |
| Charts:- Daily , Weekly | |
| Add RCUS to Watchlist: View: Get Complete RCUS Trend Analysis ➞ | |
 | ANNX Annexon, Inc. |
| Sector: Health Care | |
| SubSector: Biotechnology | |
| MarketCap: 94487 Millions | |
| Recent Price: 4.66 Smart Investing & Trading Score: 24 | |
| Day Percent Change: -1.89% Day Change: -0.09 | |
| Week Change: -0.85% Year-to-date Change: 2.2% | |
| ANNX Links: Profile News Message Board | |
| Charts:- Daily , Weekly | |
| Add ANNX to Watchlist: View: Get Complete ANNX Trend Analysis ➞ | |
 | INBX Inhibrx, Inc. |
| Sector: Health Care | |
| SubSector: Biotechnology | |
| MarketCap: 14187 Millions | |
| Recent Price: 34.01 Smart Investing & Trading Score: 24 | |
| Day Percent Change: -0.85% Day Change: -0.29 | |
| Week Change: -0.15% Year-to-date Change: -10.5% | |
| INBX Links: Profile News Message Board | |
| Charts:- Daily , Weekly | |
| Add INBX to Watchlist: View: Get Complete INBX Trend Analysis ➞ | |
 | ITGR Integer Holdings Corporation |
| Sector: Health Care | |
| SubSector: Medical Appliances & Equipment | |
| MarketCap: 1794.8 Millions | |
| Recent Price: 109.92 Smart Investing & Trading Score: 23 | |
| Day Percent Change: 0.13% Day Change: 0.14 | |
| Week Change: 0.31% Year-to-date Change: 10.9% | |
| ITGR Links: Profile News Message Board | |
| Charts:- Daily , Weekly | |
| Add ITGR to Watchlist: View: Get Complete ITGR Trend Analysis ➞ | |
 | DOCS Doximity, Inc. |
| Sector: Health Care | |
| SubSector: Health Information Services | |
| MarketCap: 6540 Millions | |
| Recent Price: 24.15 Smart Investing & Trading Score: 23 | |
| Day Percent Change: -0.27% Day Change: -0.07 | |
| Week Change: 1.39% Year-to-date Change: -15.1% | |
| DOCS Links: Profile News Message Board | |
| Charts:- Daily , Weekly | |
| Add DOCS to Watchlist: View: Get Complete DOCS Trend Analysis ➞ | |
 | HRTX Heron Therapeutics, Inc. |
| Sector: Health Care | |
| SubSector: Biotechnology | |
| MarketCap: 1172.75 Millions | |
| Recent Price: 2.55 Smart Investing & Trading Score: 22 | |
| Day Percent Change: 8.97% Day Change: 0.21 | |
| Week Change: 4.08% Year-to-date Change: 50.0% | |
| HRTX Links: Profile News Message Board | |
| Charts:- Daily , Weekly | |
| Add HRTX to Watchlist: View: Get Complete HRTX Trend Analysis ➞ | |
 | NVRO Nevro Corp. |
| Sector: Health Care | |
| SubSector: Medical Appliances & Equipment | |
| MarketCap: 2489.3 Millions | |
| Recent Price: 11.15 Smart Investing & Trading Score: 22 | |
| Day Percent Change: 7.11% Day Change: 0.74 | |
| Week Change: -1.5% Year-to-date Change: -48.2% | |
| NVRO Links: Profile News Message Board | |
| Charts:- Daily , Weekly | |
| Add NVRO to Watchlist: View: Get Complete NVRO Trend Analysis ➞ | |
 | PRLD Prelude Therapeutics Incorporated |
| Sector: Health Care | |
| SubSector: Biotechnology | |
| MarketCap: 26087 Millions | |
| Recent Price: 3.99 Smart Investing & Trading Score: 22 | |
| Day Percent Change: 6.97% Day Change: 0.26 | |
| Week Change: -1.97% Year-to-date Change: -8.3% | |
| PRLD Links: Profile News Message Board | |
| Charts:- Daily , Weekly | |
| Add PRLD to Watchlist: View: Get Complete PRLD Trend Analysis ➞ | |
 | ZCMD Zhongchao Inc. |
| Sector: Health Care | |
| SubSector: Health Information Services | |
| MarketCap: 41487 Millions | |
| Recent Price: 1.75 Smart Investing & Trading Score: 22 | |
| Day Percent Change: 6.36% Day Change: 0.10 | |
| Week Change: 3.85% Year-to-date Change: 380.7% | |
| ZCMD Links: Profile News Message Board | |
| Charts:- Daily , Weekly | |
| Add ZCMD to Watchlist: View: Get Complete ZCMD Trend Analysis ➞ | |
 | OSUR OraSure Technologies, Inc. |
| Sector: Health Care | |
| SubSector: Medical Instruments & Supplies | |
| MarketCap: 468.26 Millions | |
| Recent Price: 5.48 Smart Investing & Trading Score: 22 | |
| Day Percent Change: 2.81% Day Change: 0.15 | |
| Week Change: 3.01% Year-to-date Change: -33.2% | |
| OSUR Links: Profile News Message Board | |
| Charts:- Daily , Weekly | |
| Add OSUR to Watchlist: View: Get Complete OSUR Trend Analysis ➞ | |
 | ALLO Allogene Therapeutics, Inc. |
| Sector: Health Care | |
| SubSector: Biotechnology | |
| MarketCap: 2858.65 Millions | |
| Recent Price: 2.97 Smart Investing & Trading Score: 22 | |
| Day Percent Change: 1.71% Day Change: 0.05 | |
| Week Change: 2.77% Year-to-date Change: -7.5% | |
| ALLO Links: Profile News Message Board | |
| Charts:- Daily , Weekly | |
| Add ALLO to Watchlist: View: Get Complete ALLO Trend Analysis ➞ | |
 | NEOG Neogen Corporation |
| Sector: Health Care | |
| SubSector: Diagnostic Substances | |
| MarketCap: 3234.71 Millions | |
| Recent Price: 12.45 Smart Investing & Trading Score: 22 | |
| Day Percent Change: 1.63% Day Change: 0.20 | |
| Week Change: 2.55% Year-to-date Change: -38.1% | |
| NEOG Links: Profile News Message Board | |
| Charts:- Daily , Weekly | |
| Add NEOG to Watchlist: View: Get Complete NEOG Trend Analysis ➞ | |
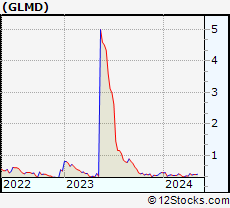 | GLMD Galmed Pharmaceuticals Ltd. |
| Sector: Health Care | |
| SubSector: Biotechnology | |
| MarketCap: 93.8785 Millions | |
| Recent Price: 0.39 Smart Investing & Trading Score: 22 | |
| Day Percent Change: 1.47% Day Change: 0.01 | |
| Week Change: 0.31% Year-to-date Change: -13.7% | |
| GLMD Links: Profile News Message Board | |
| Charts:- Daily , Weekly | |
| Add GLMD to Watchlist: View: Get Complete GLMD Trend Analysis ➞ | |
 | TAK Takeda Pharmaceutical Company Limited |
| Sector: Health Care | |
| SubSector: Drugs - Generic | |
| MarketCap: 41342.5 Millions | |
| Recent Price: 13.27 Smart Investing & Trading Score: 22 | |
| Day Percent Change: 0.61% Day Change: 0.08 | |
| Week Change: 1.84% Year-to-date Change: -7.0% | |
| TAK Links: Profile News Message Board | |
| Charts:- Daily , Weekly | |
| Add TAK to Watchlist: View: Get Complete TAK Trend Analysis ➞ | |
 | IPSC Century Therapeutics, Inc. |
| Sector: Health Care | |
| SubSector: Biotechnology | |
| MarketCap: 187 Millions | |
| Recent Price: 2.96 Smart Investing & Trading Score: 22 | |
| Day Percent Change: -2.31% Day Change: -0.07 | |
| Week Change: 2.95% Year-to-date Change: -10.2% | |
| IPSC Links: Profile News Message Board | |
| Charts:- Daily , Weekly | |
| Add IPSC to Watchlist: View: Get Complete IPSC Trend Analysis ➞ | |
 | DNA Ginkgo Bioworks Holdings, Inc. |
| Sector: Health Care | |
| SubSector: Biotechnology | |
| MarketCap: 3680 Millions | |
| Recent Price: 0.83 Smart Investing & Trading Score: 22 | |
| Day Percent Change: -1.00% Day Change: -0.01 | |
| Week Change: -3.07% Year-to-date Change: -50.4% | |
| DNA Links: Profile News Message Board | |
| Charts:- Daily , Weekly | |
| Add DNA to Watchlist: View: Get Complete DNA Trend Analysis ➞ | |
 | BLUE bluebird bio, Inc. |
| Sector: Health Care | |
| SubSector: Biotechnology | |
| MarketCap: 3365.05 Millions | |
| Recent Price: 0.90 Smart Investing & Trading Score: 22 | |
| Day Percent Change: -0.66% Day Change: -0.01 | |
| Week Change: -2.11% Year-to-date Change: -34.5% | |
| BLUE Links: Profile News Message Board | |
| Charts:- Daily , Weekly | |
| Add BLUE to Watchlist: View: Get Complete BLUE Trend Analysis ➞ | |
 | CIVI Civitas Solutions, Inc. |
| Sector: Health Care | |
| SubSector: Long-Term Care Facilities | |
| MarketCap: 625.74 Millions | |
| Recent Price: 70.55 Smart Investing & Trading Score: 22 | |
| Day Percent Change: -0.30% Day Change: -0.21 | |
| Week Change: -4.68% Year-to-date Change: 3.2% | |
| CIVI Links: Profile News Message Board | |
| Charts:- Daily , Weekly | |
| Add CIVI to Watchlist: View: Get Complete CIVI Trend Analysis ➞ | |
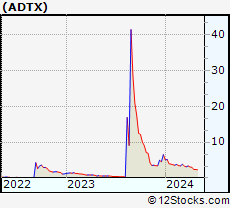 | ADTX ADiTx Therapeutics, Inc. |
| Sector: Health Care | |
| SubSector: Biotechnology | |
| MarketCap: 21487 Millions | |
| Recent Price: 2.47 Smart Investing & Trading Score: 20 | |
| Day Percent Change: 2.49% Day Change: 0.06 | |
| Week Change: 3.35% Year-to-date Change: -62.4% | |
| ADTX Links: Profile News Message Board | |
| Charts:- Daily , Weekly | |
| Add ADTX to Watchlist: View: Get Complete ADTX Trend Analysis ➞ | |
 | HROW Harrow Health, Inc. |
| Sector: Health Care | |
| SubSector: Drug Manufacturers - Other | |
| MarketCap: 104.033 Millions | |
| Recent Price: 10.64 Smart Investing & Trading Score: 20 | |
| Day Percent Change: 2.01% Day Change: 0.21 | |
| Week Change: 1.04% Year-to-date Change: -5.0% | |
| HROW Links: Profile News Message Board | |
| Charts:- Daily , Weekly | |
| Add HROW to Watchlist: View: Get Complete HROW Trend Analysis ➞ | |
 | SIBN SI-BONE, Inc. |
| Sector: Health Care | |
| SubSector: Medical Appliances & Equipment | |
| MarketCap: 234.78 Millions | |
| Recent Price: 14.61 Smart Investing & Trading Score: 20 | |
| Day Percent Change: 0.69% Day Change: 0.10 | |
| Week Change: 0.27% Year-to-date Change: -30.4% | |
| SIBN Links: Profile News Message Board | |
| Charts:- Daily , Weekly | |
| Add SIBN to Watchlist: View: Get Complete SIBN Trend Analysis ➞ | |
| For tabular summary view of above stock list: Summary View ➞ 0 - 25 , 25 - 50 , 50 - 75 , 75 - 100 , 100 - 125 , 125 - 150 , 150 - 175 , 175 - 200 , 200 - 225 , 225 - 250 , 250 - 275 , 275 - 300 , 300 - 325 , 325 - 350 , 350 - 375 , 375 - 400 , 400 - 425 , 425 - 450 , 450 - 475 , 475 - 500 , 500 - 525 , 525 - 550 , 550 - 575 , 575 - 600 , 600 - 625 , 625 - 650 , 650 - 675 , 675 - 700 , 700 - 725 | ||
| Click To Change The Sort Order: By Market Cap or Company Size Performance: Year-to-date, Week and Day | |
| Select Chart Type: | ||
|
Best Stocks Today 12Stocks.com |
© 2024 12Stocks.com Terms & Conditions Privacy Contact Us
All Information Provided Only For Education And Not To Be Used For Investing or Trading. See Terms & Conditions


One More Thing ... Get Best Stocks Delivered Daily!
Never Ever Miss A Move With Our Top Ten Stocks Lists
Find Best Stocks In Any Market - Bull or Bear Market
Take A Peek At Our Top Ten Stocks Lists: Daily, Weekly, Year-to-Date & Top Trends
Find Best Stocks In Any Market - Bull or Bear Market
Take A Peek At Our Top Ten Stocks Lists: Daily, Weekly, Year-to-Date & Top Trends
Healthcare Stocks With Best Up Trends [0-bearish to 100-bullish]: Emergent Bio[100], Lantheus [100], Blueprint Medicines[100], Glaukos [100], TransMedics [100], Corcept [100], Avanos [100], Maravai LifeSciences[100], IRadimed [100], Anika [100], Castle Biosciences[100]
Best Healthcare Stocks Year-to-Date:
Pieris [6075.82%], Precision BioSciences[2869.86%], Avenue [2850.31%], Inovio [2254.9%], Assembly Biosciences[1462%], Agenus [1412.26%], Aurora Cannabis[1363.67%], NuCana [1240.43%], Adverum Biotechnologies[1228.37%], Affimed N.V[748%], CareMax [674.23%] Best Healthcare Stocks This Week:
CytomX [183.02%], GeneDx [75.99%], Deciphera [73.24%], Emergent Bio[71.88%], P3 Health[38.51%], Cue Biopharma[37.73%], TransMedics [35.14%], Seres [34.55%], Surmodics [32.02%], Phibro Animal[31.66%], Poseida [30.99%] Best Healthcare Stocks Daily:
Emergent Bio[70.98%], Regencell Bioscience[23.15%], Pulmonx [21.50%], Orchestra BioMed[18.83%], Cellectis S.A[17.90%], Ocular Therapeutix[16.93%], Lantheus [16.01%], Butterfly Network[13.09%], Blueprint Medicines[12.80%], Moderna [12.68%], Mustang Bio[12.65%]