
 Login Sign Up


| |||||
 |  | ||||

| 12Stocks.com Market Intelligence |
Best Healthcare Stocks
 | "Discover best trending healthcare stocks with 12Stocks.com." |
| - Subu Vdaygiri, Founder, 12Stocks.com |
| In a hurry? Healthcare Stocks Lists: Performance Trends Table, Stock Charts
Sort Healthcare stocks: Daily, Weekly, Year-to-Date, Market Cap & Trends. Filter Healthcare stocks list by size:All Healthcare Large Mid-Range Small |
| 12Stocks.com Healthcare Stocks Performances & Trends Daily | |||||||||
|
|  The overall Smart Investing & Trading Score is 57 (0-bearish to 100-bullish) which puts Healthcare sector in short term neutral trend. The Smart Investing & Trading Score from previous trading session is 60 and hence a deterioration of trend.
| ||||||||
Here are the Smart Investing & Trading Scores of the most requested Healthcare stocks at 12Stocks.com (click stock name for detailed review):
|


| 12Stocks.com: Investing in Healthcare sector with Stocks | |
|
The following table helps investors and traders sort through current performance and trends (as measured by Smart Investing & Trading Score) of various
stocks in the Healthcare sector. Quick View: Move mouse or cursor over stock symbol (ticker) to view short-term Technical chart and over stock name to view long term chart. Click on  to add stock symbol to your watchlist and to add stock symbol to your watchlist and  to view watchlist. Click on any ticker or stock name for detailed market intelligence report for that stock. to view watchlist. Click on any ticker or stock name for detailed market intelligence report for that stock. |
12Stocks.com Performance of Stocks in Healthcare Sector
| Ticker | Stock Name | Watchlist | Category | Recent Price | Smart Investing & Trading Score | Change % | YTD Change% |
| CABA | Cabaletta Bio |   | Biotechnology | 12.41 | 42 | 16.58% | -45.33% |
| KZR | Kezar Life | | Biotechnology | 0.84 | 42 | 1.70% | -11.49% |
| AKRO | Akero | | Biotechnology | 20.08 | 42 | 0.96% | -14.00% |
| TAK | Takeda | | Pharmaceutical | 13.19 | 42 | 0.84% | -7.57% |
| ZLAB | Zai Lab | | Biotechnology | 15.90 | 42 | 0.63% | -41.82% |
| ARWR | Arrowhead | | Biotechnology | 23.17 | 42 | 0.56% | -24.28% |
| AVAH | Aveanna | | Medical Care Facilities | 2.26 | 42 | 0.44% | -16.14% |
| MEIP | MEI Pharma | | Biotechnology | 3.06 | 42 | 0.33% | -47.24% |
| CTLT | Catalent | | Pharmaceutical | 56.00 | 42 | 0.27% | 24.64% |
| CLLS | Cellectis S.A | | Biotechnology | 2.54 | 42 | -0.94% | -17.66% |
| GOSS | Gossamer Bio | | Biotechnology | 0.71 | 42 | -0.35% | -22.47% |
| KALA | Kala | | Biotechnology | 6.81 | 42 | -0.15% | -2.71% |
| GPCR | Structure | | Biotechnology | 39.31 | 42 | -0.03% | 3.24% |
| NVCR | NovoCure | | Equipment | 12.74 | 42 | 4.08% | -14.67% |
| RCUS | Arcus Biosciences | | Biotechnology | 15.50 | 42 | 1.77% | -18.85% |
| INBX | Inhibrx | | Biotechnology | 34.29 | 42 | 0.73% | -9.79% |
| DOCS | Doximity | | Health Information | 24.22 | 40 | -0.31% | -14.83% |
| ZCMD | Zhongchao | | Health Information | 1.71 | 40 | 6.74% | 368.36% |
| QURE | uniQure N.V | | Biotechnology | 4.57 | 40 | 3.51% | -32.50% |
| SPRB | Spruce Biosciences | | Biotechnology | 0.73 | 40 | 2.75% | -75.09% |
| NVS | Novartis AG | | Pharmaceutical | 97.50 | 40 | 0.38% | -3.44% |
| ABBV | AbbVie | | Pharmaceutical | 161.72 | 40 | -0.57% | 4.36% |
| BDX | Becton Dickinson | | Instruments | 233.72 | 40 | -0.38% | -4.15% |
| SPRO | Spero | | Biotechnology | 1.54 | 39 | 8.80% | 5.10% |
| ZYXI | Zynex | | Equipment | 11.77 | 39 | 7.29% | 8.08% |
| For chart view version of above stock list: Chart View ➞ 0 - 25 , 25 - 50 , 50 - 75 , 75 - 100 , 100 - 125 , 125 - 150 , 150 - 175 , 175 - 200 , 200 - 225 , 225 - 250 , 250 - 275 , 275 - 300 , 300 - 325 , 325 - 350 , 350 - 375 , 375 - 400 , 400 - 425 , 425 - 450 , 450 - 475 , 475 - 500 , 500 - 525 , 525 - 550 , 550 - 575 , 575 - 600 , 600 - 625 , 625 - 650 , 650 - 675 , 675 - 700 , 700 - 725 | ||
 | Click To Change The Sort Order: By Market Cap or Company Size Performance: Year-to-date, Week and Day |  |
|
Get the most comprehensive stock market coverage daily at 12Stocks.com ➞ Best Stocks Today ➞ Best Stocks Weekly ➞ Best Stocks Year-to-Date ➞ Best Stocks Trends ➞  Best Stocks Today 12Stocks.com Best Nasdaq Stocks ➞ Best S&P 500 Stocks ➞ Best Tech Stocks ➞ Best Biotech Stocks ➞ |
| Detailed Overview of Healthcare Stocks |
| Healthcare Technical Overview, Leaders & Laggards, Top Healthcare ETF Funds & Detailed Healthcare Stocks List, Charts, Trends & More |
| Healthcare Sector: Technical Analysis, Trends & YTD Performance | |
| Healthcare sector is composed of stocks
from pharmaceutical, biotech, diagnostics labs, insurance providers
and healthcare services. Healthcare sector, as represented by XLV, an exchange-traded fund [ETF] that holds basket of Healthcare stocks (e.g, Merck, Amgen) is up by 3.08% and is currently underperforming the overall market by -1.46% year-to-date. Below is a quick view of Technical charts and trends: |
|
 XLV Weekly Chart |
|
| Long Term Trend: Not Good | |
| Medium Term Trend: Good | |
 XLV Daily Chart |
|
| Short Term Trend: Very Good | |
| Overall Trend Score: 57 | |
| YTD Performance: 3.08% | |
| **Trend Scores & Views Are Only For Educational Purposes And Not For Investing | |
| 12Stocks.com: Top Performing Healthcare Sector Stocks | ||||||||||||||||||||||||||||||||||||||||||||||||
 The top performing Healthcare sector stocks year to date are
Now, more recently, over last week, the top performing Healthcare sector stocks on the move are


|
||||||||||||||||||||||||||||||||||||||||||||||||
| 12Stocks.com: Investing in Healthcare Sector using Exchange Traded Funds | |
|
The following table shows list of key exchange traded funds (ETF) that
help investors track Healthcare Index. For detailed view, check out our ETF Funds section of our website. Quick View: Move mouse or cursor over ETF symbol (ticker) to view short-term Technical chart and over ETF name to view long term chart. Click on ticker or stock name for detailed view. Click on to add stock symbol to your watchlist and to view watchlist. |
12Stocks.com List of ETFs that track Healthcare Index
| Ticker | ETF Name | Watchlist | Recent Price | Smart Investing & Trading Score | Change % | Week % | Year-to-date % |
| XLV | Health Care | | 140.58 | 57 | 0.18 | 0.44 | 3.08% |
| XBI | Biotech | | 87.33 | 49 | 3.20 | 4.6 | -2.2% |
| IBB | Biotechnology | | 129.49 | 57 | 2.02 | 2.37 | -4.68% |
| BBH | Biotech | | 158.86 | 64 | 1.55 | 2.06 | -3.9% |
| VHT | Health Care | | 257.28 | 32 | 0.48 | 0.77 | 2.62% |
| IYH | Healthcare | | 59.18 | 57 | 0.59 | 0.97 | 3.37% |
| IHF | Healthcare Providers | | 51.44 | 15 | -0.77 | -0.92 | -2.04% |
| IHI | Medical Devices | | 55.02 | 7 | 0.02 | -0.92 | 1.95% |
| BIB | Biotechnology | | 52.58 | 64 | 4.43 | 5.88 | -7.84% |
| BIS | Short Biotech | | 19.05 | 36 | -3.98 | -5.79 | 5.42% |
| XHE | Health Care Equipment | | 84.08 | 24 | 2.40 | 2 | -0.21% |
| CURE | Healthcare Bull 3X | | 106.56 | 64 | 0.61 | 1.19 | 4.74% |
| LABU | Biotech Bull 3X | | 99.81 | 49 | 9.84 | 14.06 | -18.17% |
| LABD | Biotech Bear 3X | | 9.03 | 56 | -10.24 | -14.16 | -6.81% |
| PSCH | SmallCap Health Care | | 42.08 | 42 | 2.75 | 3.38 | -1.69% |
| XHS | Health Care Services | | 88.41 | 25 | -0.30 | 0.61 | -0.61% |
| PTH | DWA Healthcare Momentum | | 41.30 | 49 | 2.00 | 3.53 | 5.52% |
| BTEC | Principal Healthcare Innovators | | 36.34 | 39 | 4.88 | 6.1 | 0.03% |
| RXL | Health Care | | 95.32 | 57 | 0.34 | 0.52 | 4.29% |
| RXD | Short Health Care | | 11.32 | 41 | -0.39 | -1.17 | -5.11% |
| 12Stocks.com: Charts, Trends, Fundamental Data and Performances of Healthcare Stocks | |
|
We now take in-depth look at all Healthcare stocks including charts, multi-period performances and overall trends (as measured by Smart Investing & Trading Score). One can sort Healthcare stocks (click link to choose) by Daily, Weekly and by Year-to-Date performances. Also, one can sort by size of the company or by market capitalization. |
| Select Your Default Chart Type: | |||||
| |||||
| Click on stock symbol or name for detailed view. Click on to add stock symbol to your watchlist and to view watchlist. Quick View: Move mouse or cursor over "Daily" to quickly view daily Technical stock chart and over "Weekly" to view weekly Technical stock chart. | |||||

 | CABA Cabaletta Bio, Inc. |
| Sector: Health Care | |
| SubSector: Biotechnology | |
| MarketCap: 222.085 Millions | |
| Recent Price: 12.41 Smart Investing & Trading Score: 42 | |
| Day Percent Change: 16.58% Day Change: 1.77 | |
| Week Change: 12.72% Year-to-date Change: -45.3% | |
| CABA Links: Profile News Message Board | |
| Charts:- Daily , Weekly | |
| Add CABA to Watchlist: View: Get Complete CABA Trend Analysis ➞ | |
 | KZR Kezar Life Sciences, Inc. |
| Sector: Health Care | |
| SubSector: Biotechnology | |
| MarketCap: 174.885 Millions | |
| Recent Price: 0.84 Smart Investing & Trading Score: 42 | |
| Day Percent Change: 1.70% Day Change: 0.01 | |
| Week Change: 4.17% Year-to-date Change: -11.5% | |
| KZR Links: Profile News Message Board | |
| Charts:- Daily , Weekly | |
| Add KZR to Watchlist: View: Get Complete KZR Trend Analysis ➞ | |
 | AKRO Akero Therapeutics, Inc. |
| Sector: Health Care | |
| SubSector: Biotechnology | |
| MarketCap: 675.085 Millions | |
| Recent Price: 20.08 Smart Investing & Trading Score: 42 | |
| Day Percent Change: 0.96% Day Change: 0.19 | |
| Week Change: 1.72% Year-to-date Change: -14.0% | |
| AKRO Links: Profile News Message Board | |
| Charts:- Daily , Weekly | |
| Add AKRO to Watchlist: View: Get Complete AKRO Trend Analysis ➞ | |
 | TAK Takeda Pharmaceutical Company Limited |
| Sector: Health Care | |
| SubSector: Drugs - Generic | |
| MarketCap: 41342.5 Millions | |
| Recent Price: 13.19 Smart Investing & Trading Score: 42 | |
| Day Percent Change: 0.84% Day Change: 0.11 | |
| Week Change: 1.23% Year-to-date Change: -7.6% | |
| TAK Links: Profile News Message Board | |
| Charts:- Daily , Weekly | |
| Add TAK to Watchlist: View: Get Complete TAK Trend Analysis ➞ | |
 | ZLAB Zai Lab Limited |
| Sector: Health Care | |
| SubSector: Biotechnology | |
| MarketCap: 3970.35 Millions | |
| Recent Price: 15.90 Smart Investing & Trading Score: 42 | |
| Day Percent Change: 0.63% Day Change: 0.10 | |
| Week Change: -0.06% Year-to-date Change: -41.8% | |
| ZLAB Links: Profile News Message Board | |
| Charts:- Daily , Weekly | |
| Add ZLAB to Watchlist: View: Get Complete ZLAB Trend Analysis ➞ | |
 | ARWR Arrowhead Pharmaceuticals, Inc. |
| Sector: Health Care | |
| SubSector: Biotechnology | |
| MarketCap: 3226.15 Millions | |
| Recent Price: 23.17 Smart Investing & Trading Score: 42 | |
| Day Percent Change: 0.56% Day Change: 0.13 | |
| Week Change: 4.75% Year-to-date Change: -24.3% | |
| ARWR Links: Profile News Message Board | |
| Charts:- Daily , Weekly | |
| Add ARWR to Watchlist: View: Get Complete ARWR Trend Analysis ➞ | |
 | AVAH Aveanna Healthcare Holdings Inc. |
| Sector: Health Care | |
| SubSector: Medical Care Facilities | |
| MarketCap: 305 Millions | |
| Recent Price: 2.26 Smart Investing & Trading Score: 42 | |
| Day Percent Change: 0.44% Day Change: 0.01 | |
| Week Change: 2.73% Year-to-date Change: -16.1% | |
| AVAH Links: Profile News Message Board | |
| Charts:- Daily , Weekly | |
| Add AVAH to Watchlist: View: Get Complete AVAH Trend Analysis ➞ | |
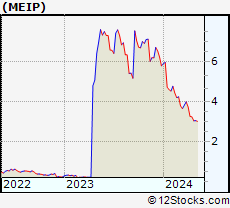 | MEIP MEI Pharma, Inc. |
| Sector: Health Care | |
| SubSector: Biotechnology | |
| MarketCap: 145.185 Millions | |
| Recent Price: 3.06 Smart Investing & Trading Score: 42 | |
| Day Percent Change: 0.33% Day Change: 0.01 | |
| Week Change: 0.33% Year-to-date Change: -47.2% | |
| MEIP Links: Profile News Message Board | |
| Charts:- Daily , Weekly | |
| Add MEIP to Watchlist: View: Get Complete MEIP Trend Analysis ➞ | |
 | CTLT Catalent, Inc. |
| Sector: Health Care | |
| SubSector: Drugs - Generic | |
| MarketCap: 6351.95 Millions | |
| Recent Price: 56.00 Smart Investing & Trading Score: 42 | |
| Day Percent Change: 0.27% Day Change: 0.15 | |
| Week Change: 0.14% Year-to-date Change: 24.6% | |
| CTLT Links: Profile News Message Board | |
| Charts:- Daily , Weekly | |
| Add CTLT to Watchlist: View: Get Complete CTLT Trend Analysis ➞ | |
 | CLLS Cellectis S.A. |
| Sector: Health Care | |
| SubSector: Biotechnology | |
| MarketCap: 398.685 Millions | |
| Recent Price: 2.54 Smart Investing & Trading Score: 42 | |
| Day Percent Change: -0.94% Day Change: -0.02 | |
| Week Change: 1.2% Year-to-date Change: -17.7% | |
| CLLS Links: Profile News Message Board | |
| Charts:- Daily , Weekly | |
| Add CLLS to Watchlist: View: Get Complete CLLS Trend Analysis ➞ | |
 | GOSS Gossamer Bio, Inc. |
| Sector: Health Care | |
| SubSector: Biotechnology | |
| MarketCap: 653.285 Millions | |
| Recent Price: 0.71 Smart Investing & Trading Score: 42 | |
| Day Percent Change: -0.35% Day Change: 0.00 | |
| Week Change: 5.91% Year-to-date Change: -22.5% | |
| GOSS Links: Profile News Message Board | |
| Charts:- Daily , Weekly | |
| Add GOSS to Watchlist: View: Get Complete GOSS Trend Analysis ➞ | |
 | KALA Kala Pharmaceuticals, Inc. |
| Sector: Health Care | |
| SubSector: Biotechnology | |
| MarketCap: 276.485 Millions | |
| Recent Price: 6.81 Smart Investing & Trading Score: 42 | |
| Day Percent Change: -0.15% Day Change: -0.01 | |
| Week Change: 8.1% Year-to-date Change: -2.7% | |
| KALA Links: Profile News Message Board | |
| Charts:- Daily , Weekly | |
| Add KALA to Watchlist: View: Get Complete KALA Trend Analysis ➞ | |
 | GPCR Structure Therapeutics Inc. |
| Sector: Health Care | |
| SubSector: Biotechnology | |
| MarketCap: 1530 Millions | |
| Recent Price: 39.31 Smart Investing & Trading Score: 42 | |
| Day Percent Change: -0.03% Day Change: -0.01 | |
| Week Change: 1.04% Year-to-date Change: 3.2% | |
| GPCR Links: Profile News Message Board | |
| Charts:- Daily , Weekly | |
| Add GPCR to Watchlist: View: Get Complete GPCR Trend Analysis ➞ | |
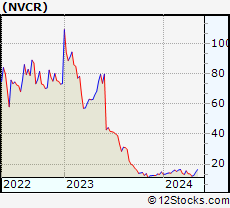 | NVCR NovoCure Limited |
| Sector: Health Care | |
| SubSector: Medical Appliances & Equipment | |
| MarketCap: 5939.5 Millions | |
| Recent Price: 12.74 Smart Investing & Trading Score: 42 | |
| Day Percent Change: 4.08% Day Change: 0.50 | |
| Week Change: 0.83% Year-to-date Change: -14.7% | |
| NVCR Links: Profile News Message Board | |
| Charts:- Daily , Weekly | |
| Add NVCR to Watchlist: View: Get Complete NVCR Trend Analysis ➞ | |
 | RCUS Arcus Biosciences, Inc. |
| Sector: Health Care | |
| SubSector: Biotechnology | |
| MarketCap: 539.285 Millions | |
| Recent Price: 15.50 Smart Investing & Trading Score: 42 | |
| Day Percent Change: 1.77% Day Change: 0.27 | |
| Week Change: -0.32% Year-to-date Change: -18.9% | |
| RCUS Links: Profile News Message Board | |
| Charts:- Daily , Weekly | |
| Add RCUS to Watchlist: View: Get Complete RCUS Trend Analysis ➞ | |
 | INBX Inhibrx, Inc. |
| Sector: Health Care | |
| SubSector: Biotechnology | |
| MarketCap: 14187 Millions | |
| Recent Price: 34.29 Smart Investing & Trading Score: 42 | |
| Day Percent Change: 0.73% Day Change: 0.25 | |
| Week Change: 0.68% Year-to-date Change: -9.8% | |
| INBX Links: Profile News Message Board | |
| Charts:- Daily , Weekly | |
| Add INBX to Watchlist: View: Get Complete INBX Trend Analysis ➞ | |
 | DOCS Doximity, Inc. |
| Sector: Health Care | |
| SubSector: Health Information Services | |
| MarketCap: 6540 Millions | |
| Recent Price: 24.22 Smart Investing & Trading Score: 40 | |
| Day Percent Change: -0.31% Day Change: -0.07 | |
| Week Change: 1.66% Year-to-date Change: -14.8% | |
| DOCS Links: Profile News Message Board | |
| Charts:- Daily , Weekly | |
| Add DOCS to Watchlist: View: Get Complete DOCS Trend Analysis ➞ | |
 | ZCMD Zhongchao Inc. |
| Sector: Health Care | |
| SubSector: Health Information Services | |
| MarketCap: 41487 Millions | |
| Recent Price: 1.71 Smart Investing & Trading Score: 40 | |
| Day Percent Change: 6.74% Day Change: 0.11 | |
| Week Change: 1.18% Year-to-date Change: 368.4% | |
| ZCMD Links: Profile News Message Board | |
| Charts:- Daily , Weekly | |
| Add ZCMD to Watchlist: View: Get Complete ZCMD Trend Analysis ➞ | |
 | QURE uniQure N.V. |
| Sector: Health Care | |
| SubSector: Biotechnology | |
| MarketCap: 2267.25 Millions | |
| Recent Price: 4.57 Smart Investing & Trading Score: 40 | |
| Day Percent Change: 3.51% Day Change: 0.16 | |
| Week Change: 0.88% Year-to-date Change: -32.5% | |
| QURE Links: Profile News Message Board | |
| Charts:- Daily , Weekly | |
| Add QURE to Watchlist: View: Get Complete QURE Trend Analysis ➞ | |
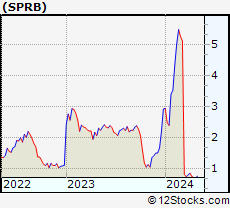 | SPRB Spruce Biosciences, Inc. |
| Sector: Health Care | |
| SubSector: Biotechnology | |
| MarketCap: 49487 Millions | |
| Recent Price: 0.73 Smart Investing & Trading Score: 40 | |
| Day Percent Change: 2.75% Day Change: 0.02 | |
| Week Change: 3.93% Year-to-date Change: -75.1% | |
| SPRB Links: Profile News Message Board | |
| Charts:- Daily , Weekly | |
| Add SPRB to Watchlist: View: Get Complete SPRB Trend Analysis ➞ | |
 | NVS Novartis AG |
| Sector: Health Care | |
| SubSector: Drug Manufacturers - Major | |
| MarketCap: 203929 Millions | |
| Recent Price: 97.50 Smart Investing & Trading Score: 40 | |
| Day Percent Change: 0.38% Day Change: 0.37 | |
| Week Change: 0.06% Year-to-date Change: -3.4% | |
| NVS Links: Profile News Message Board | |
| Charts:- Daily , Weekly | |
| Add NVS to Watchlist: View: Get Complete NVS Trend Analysis ➞ | |
 | ABBV AbbVie Inc. |
| Sector: Health Care | |
| SubSector: Drug Manufacturers - Major | |
| MarketCap: 110080 Millions | |
| Recent Price: 161.72 Smart Investing & Trading Score: 40 | |
| Day Percent Change: -0.57% Day Change: -0.92 | |
| Week Change: 1.32% Year-to-date Change: 4.4% | |
| ABBV Links: Profile News Message Board | |
| Charts:- Daily , Weekly | |
| Add ABBV to Watchlist: View: Get Complete ABBV Trend Analysis ➞ | |
 | BDX Becton, Dickinson and Company |
| Sector: Health Care | |
| SubSector: Medical Instruments & Supplies | |
| MarketCap: 62758.4 Millions | |
| Recent Price: 233.72 Smart Investing & Trading Score: 40 | |
| Day Percent Change: -0.38% Day Change: -0.88 | |
| Week Change: 0.94% Year-to-date Change: -4.2% | |
| BDX Links: Profile News Message Board | |
| Charts:- Daily , Weekly | |
| Add BDX to Watchlist: View: Get Complete BDX Trend Analysis ➞ | |
 | SPRO Spero Therapeutics, Inc. |
| Sector: Health Care | |
| SubSector: Biotechnology | |
| MarketCap: 121.085 Millions | |
| Recent Price: 1.54 Smart Investing & Trading Score: 39 | |
| Day Percent Change: 8.80% Day Change: 0.13 | |
| Week Change: 5.82% Year-to-date Change: 5.1% | |
| SPRO Links: Profile News Message Board | |
| Charts:- Daily , Weekly | |
| Add SPRO to Watchlist: View: Get Complete SPRO Trend Analysis ➞ | |
 | ZYXI Zynex, Inc. |
| Sector: Health Care | |
| SubSector: Medical Appliances & Equipment | |
| MarketCap: 388.58 Millions | |
| Recent Price: 11.77 Smart Investing & Trading Score: 39 | |
| Day Percent Change: 7.29% Day Change: 0.80 | |
| Week Change: 5% Year-to-date Change: 8.1% | |
| ZYXI Links: Profile News Message Board | |
| Charts:- Daily , Weekly | |
| Add ZYXI to Watchlist: View: Get Complete ZYXI Trend Analysis ➞ | |
| For tabular summary view of above stock list: Summary View ➞ 0 - 25 , 25 - 50 , 50 - 75 , 75 - 100 , 100 - 125 , 125 - 150 , 150 - 175 , 175 - 200 , 200 - 225 , 225 - 250 , 250 - 275 , 275 - 300 , 300 - 325 , 325 - 350 , 350 - 375 , 375 - 400 , 400 - 425 , 425 - 450 , 450 - 475 , 475 - 500 , 500 - 525 , 525 - 550 , 550 - 575 , 575 - 600 , 600 - 625 , 625 - 650 , 650 - 675 , 675 - 700 , 700 - 725 | ||
| Click To Change The Sort Order: By Market Cap or Company Size Performance: Year-to-date, Week and Day | |
| Select Chart Type: | ||
|
Best Stocks Today 12Stocks.com |
© 2024 12Stocks.com Terms & Conditions Privacy Contact Us
All Information Provided Only For Education And Not To Be Used For Investing or Trading. See Terms & Conditions


One More Thing ... Get Best Stocks Delivered Daily!
Never Ever Miss A Move With Our Top Ten Stocks Lists
Find Best Stocks In Any Market - Bull or Bear Market
Take A Peek At Our Top Ten Stocks Lists: Daily, Weekly, Year-to-Date & Top Trends
Find Best Stocks In Any Market - Bull or Bear Market
Take A Peek At Our Top Ten Stocks Lists: Daily, Weekly, Year-to-Date & Top Trends
Healthcare Stocks With Best Up Trends [0-bearish to 100-bullish]: CytomX [100], Surmodics [100], TransMedics [100], GeneDx [100], Summit [100], PROCEPT BioRobotics[100], Xencor [100], LivaNova [100], Humacyte [100], Mesoblast [100], United [100]
Best Healthcare Stocks Year-to-Date:
Pieris [6317.58%], Avenue [2856.52%], Precision BioSciences[2771.23%], Inovio [2172.55%], Assembly Biosciences[1518.1%], Agenus [1501.64%], Aurora Cannabis[1445.57%], NuCana [1245.5%], Adverum Biotechnologies[1200.48%], Affimed N.V[756%], CareMax [722.68%] Best Healthcare Stocks This Week:
CytomX [222.64%], GeneDx [88.13%], Deciphera [73.11%], Cue Biopharma[39.56%], Seres [30.91%], Poseida [30.52%], P3 Health[29.62%], Concord [29.33%], Phibro Animal[28.44%], Canopy Growth[28.4%], CareMax [27.88%] Best Healthcare Stocks Daily:
CytomX [214.72%], Surmodics [29.74%], TransMedics [24.93%], Ventyx Biosciences[24.63%], GeneDx [22.11%], Summit [19.59%], MiMedx [18.67%], Cabaletta Bio[16.58%], TG [16.25%], Bio-Techne [16.22%], Brainstorm Cell[15.10%]