
 Login Sign Up


| |||||
 |  | ||||

| 12Stocks.com Market Intelligence |
Best Healthcare Stocks
 | "Discover best trending healthcare stocks with 12Stocks.com." |
| - Subu Vdaygiri, Founder, 12Stocks.com |
| In a hurry? Healthcare Stocks Lists: Performance Trends Table, Stock Charts
Sort Healthcare stocks: Daily, Weekly, Year-to-Date, Market Cap & Trends. Filter Healthcare stocks list by size:All Healthcare Large Mid-Range Small |
| 12Stocks.com Healthcare Stocks Performances & Trends Daily | |||||||||
|
|  The overall Smart Investing & Trading Score is 57 (0-bearish to 100-bullish) which puts Healthcare sector in short term neutral trend. The Smart Investing & Trading Score from previous trading session is 60 and a deterioration of trend continues.
| ||||||||
Here are the Smart Investing & Trading Scores of the most requested Healthcare stocks at 12Stocks.com (click stock name for detailed review):
|


| 12Stocks.com: Investing in Healthcare sector with Stocks | |
|
The following table helps investors and traders sort through current performance and trends (as measured by Smart Investing & Trading Score) of various
stocks in the Healthcare sector. Quick View: Move mouse or cursor over stock symbol (ticker) to view short-term Technical chart and over stock name to view long term chart. Click on  to add stock symbol to your watchlist and to add stock symbol to your watchlist and  to view watchlist. Click on any ticker or stock name for detailed market intelligence report for that stock. to view watchlist. Click on any ticker or stock name for detailed market intelligence report for that stock. |
12Stocks.com Performance of Stocks in Healthcare Sector
| Ticker | Stock Name | Watchlist | Category | Recent Price | Smart Investing & Trading Score | Change % | YTD Change% |
| ATEC | Alphatec |   | Instruments | 13.22 | 42 | 1.93% | -12.51% |
| CABA | Cabaletta Bio | | Biotechnology | 12.62 | 42 | 1.69% | -44.41% |
| NVCT | Nuvectis Pharma | | Biotechnology | 6.62 | 42 | 1.30% | -19.95% |
| IRON | Disc Medicine | | Biotechnology | 28.85 | 42 | 1.17% | -50.26% |
| RCKT | Rocket | | Biotechnology | 22.77 | 42 | 1.07% | -24.02% |
| IMVT | Immunovant | | Biotechnology | 28.77 | 42 | 0.88% | -31.71% |
| AVRO | AVROBIO | | Biotechnology | 1.23 | 42 | 0.82% | -9.56% |
| MLTX | MoonLake Immuno | | Biotechnology | 43.23 | 42 | 0.79% | -31.14% |
| IMRX | Immuneering | | Biotechnology | 1.55 | 42 | 0.65% | -79.58% |
| GLPG | Galapagos NV | | Biotechnology | 29.48 | 42 | 0.46% | -27.49% |
| DVAX | Dynavax Technologies | | Biotechnology | 11.73 | 42 | 0.39% | -16.13% |
| PEN | Penumbra | | Instruments | 206.06 | 42 | 0.38% | -18.08% |
| HBIO | Harvard Bioscience | | Instruments | 3.83 | 42 | 0.26% | -28.41% |
| VERO | Venus Concept | | Equipment | 0.67 | 42 | 0.00% | -43.50% |
| ARCT | Arcturus | | Biotechnology | 26.54 | 42 | -4.91% | -15.83% |
| FGEN | FibroGen | | Biotechnology | 1.13 | 42 | -3.42% | 27.50% |
| ACIU | AC Immune | | Biotechnology | 2.42 | 42 | -3.20% | -51.60% |
| CMPS | COMPASS Pathways | | Medical Care Facilities | 8.26 | 42 | -2.59% | -5.49% |
| BTMD | biote | | Medical Care Facilities | 5.58 | 42 | -1.06% | 12.50% |
| ORGO | Organogenesis | | Pharmaceutical | 2.50 | 42 | -0.60% | -39.00% |
| IGMS | IGM Biosciences | | Biotechnology | 9.44 | 42 | -0.42% | 13.60% |
| FOLD | Amicus | | Biotechnology | 10.41 | 42 | -0.19% | -26.64% |
| TERN | Terns | | Biotechnology | 5.14 | 42 | 0.78% | -22.24% |
| ADVM | Adverum Biotechnologies | | Biotechnology | 10.00 | 41 | 2.15% | NA |
| XFOR | X4 | | Biotechnology | 1.09 | 41 | -1.36% | 29.99% |
| For chart view version of above stock list: Chart View ➞ 0 - 25 , 25 - 50 , 50 - 75 , 75 - 100 , 100 - 125 , 125 - 150 , 150 - 175 , 175 - 200 , 200 - 225 , 225 - 250 , 250 - 275 , 275 - 300 , 300 - 325 , 325 - 350 , 350 - 375 , 375 - 400 , 400 - 425 , 425 - 450 , 450 - 475 , 475 - 500 , 500 - 525 , 525 - 550 , 550 - 575 , 575 - 600 , 600 - 625 , 625 - 650 , 650 - 675 , 675 - 700 , 700 - 725 | ||
 | Click To Change The Sort Order: By Market Cap or Company Size Performance: Year-to-date, Week and Day |  |
|
Get the most comprehensive stock market coverage daily at 12Stocks.com ➞ Best Stocks Today ➞ Best Stocks Weekly ➞ Best Stocks Year-to-Date ➞ Best Stocks Trends ➞  Best Stocks Today 12Stocks.com Best Nasdaq Stocks ➞ Best S&P 500 Stocks ➞ Best Tech Stocks ➞ Best Biotech Stocks ➞ |
| Detailed Overview of Healthcare Stocks |
| Healthcare Technical Overview, Leaders & Laggards, Top Healthcare ETF Funds & Detailed Healthcare Stocks List, Charts, Trends & More |
| Healthcare Sector: Technical Analysis, Trends & YTD Performance | |
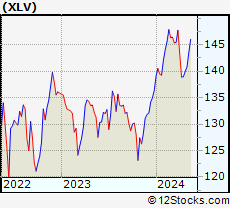
| Healthcare sector is composed of stocks
from pharmaceutical, biotech, diagnostics labs, insurance providers
and healthcare services. Healthcare sector, as represented by XLV, an exchange-traded fund [ETF] that holds basket of Healthcare stocks (e.g, Merck, Amgen) is up by 3.01% and is currently underperforming the overall market by -2.61% year-to-date. Below is a quick view of Technical charts and trends: |
|
 XLV Weekly Chart |
|
| Long Term Trend: Not Good | |
| Medium Term Trend: Good | |
 XLV Daily Chart |
|
| Short Term Trend: Very Good | |
| Overall Trend Score: 57 | |
| YTD Performance: 3.01% | |
| **Trend Scores & Views Are Only For Educational Purposes And Not For Investing | |
| 12Stocks.com: Top Performing Healthcare Sector Stocks | ||||||||||||||||||||||||||||||||||||||||||||||||
 The top performing Healthcare sector stocks year to date are
Now, more recently, over last week, the top performing Healthcare sector stocks on the move are


|
||||||||||||||||||||||||||||||||||||||||||||||||
| 12Stocks.com: Investing in Healthcare Sector using Exchange Traded Funds | |
|
The following table shows list of key exchange traded funds (ETF) that
help investors track Healthcare Index. For detailed view, check out our ETF Funds section of our website. Quick View: Move mouse or cursor over ETF symbol (ticker) to view short-term Technical chart and over ETF name to view long term chart. Click on ticker or stock name for detailed view. Click on to add stock symbol to your watchlist and to view watchlist. |
12Stocks.com List of ETFs that track Healthcare Index
| Ticker | ETF Name | Watchlist | Recent Price | Smart Investing & Trading Score | Change % | Week % | Year-to-date % |
| XLV | Health Care | | 140.48 | 57 | -0.07 | 0.37 | 3.01% |
| XBI | Biotech | | 88.34 | 50 | 1.16 | 5.81 | -1.06% |
| IBB | Biotechnology | | 130.64 | 64 | 0.89 | 3.28 | -3.84% |
| BBH | Biotech | | 160.51 | 64 | 1.18 | 3.12 | -2.9% |
| VHT | Health Care | | 257.14 | 37 | -0.05 | 0.71 | 2.57% |
| IYH | Healthcare | | 59.12 | 37 | -0.10 | 0.87 | 3.27% |
| IHF | Healthcare Providers | | 51.64 | 15 | 0.39 | -0.54 | -1.66% |
| IHI | Medical Devices | | 55.16 | 0 | 0.25 | -0.67 | 2.2% |
| BIB | Biotechnology | | 52.58 | 57 | 0.00 | 5.88 | -7.84% |
| BIS | Short Biotech | | 18.61 | 36 | -2.62 | -7.96 | 2.99% |
| XHE | Health Care Equipment | | 84.89 | 47 | 1.16 | 2.98 | 0.75% |
| CURE | Healthcare Bull 3X | | 105.11 | 40 | -1.36 | -0.19 | 3.31% |
| LABU | Biotech Bull 3X | | 102.99 | 42 | 3.19 | 17.69 | -15.56% |
| LABD | Biotech Bear 3X | | 8.76 | 44 | -2.99 | -16.73 | -9.6% |
| PSCH | SmallCap Health Care | | 41.83 | 30 | 0.80 | 2.78 | -2.27% |
| XHS | Health Care Services | | 88.14 | 27 | -0.19 | 0.31 | -0.91% |
| PTH | DWA Healthcare Momentum | | 41.27 | 22 | 0.00 | 3.46 | 5.44% |
| BTEC | Principal Healthcare Innovators | | 35.90 | 42 | 0.00 | 4.81 | -1.19% |
| RXL | Health Care | | 95.21 | 47 | -0.12 | 0.41 | 4.16% |
| RXD | Short Health Care | | 11.34 | 64 | -0.18 | -0.96 | -4.91% |
| 12Stocks.com: Charts, Trends, Fundamental Data and Performances of Healthcare Stocks | |
|
We now take in-depth look at all Healthcare stocks including charts, multi-period performances and overall trends (as measured by Smart Investing & Trading Score). One can sort Healthcare stocks (click link to choose) by Daily, Weekly and by Year-to-Date performances. Also, one can sort by size of the company or by market capitalization. |
| Select Your Default Chart Type: | |||||
| |||||
| Click on stock symbol or name for detailed view. Click on to add stock symbol to your watchlist and to view watchlist. Quick View: Move mouse or cursor over "Daily" to quickly view daily Technical stock chart and over "Weekly" to view weekly Technical stock chart. | |||||

 | ATEC Alphatec Holdings, Inc. |
| Sector: Health Care | |
| SubSector: Medical Instruments & Supplies | |
| MarketCap: 181.16 Millions | |
| Recent Price: 13.22 Smart Investing & Trading Score: 42 | |
| Day Percent Change: 1.93% Day Change: 0.25 | |
| Week Change: 6.27% Year-to-date Change: -12.5% | |
| ATEC Links: Profile News Message Board | |
| Charts:- Daily , Weekly | |
| Add ATEC to Watchlist: View: Get Complete ATEC Trend Analysis ➞ | |
 | CABA Cabaletta Bio, Inc. |
| Sector: Health Care | |
| SubSector: Biotechnology | |
| MarketCap: 222.085 Millions | |
| Recent Price: 12.62 Smart Investing & Trading Score: 42 | |
| Day Percent Change: 1.69% Day Change: 0.21 | |
| Week Change: 14.62% Year-to-date Change: -44.4% | |
| CABA Links: Profile News Message Board | |
| Charts:- Daily , Weekly | |
| Add CABA to Watchlist: View: Get Complete CABA Trend Analysis ➞ | |
 | NVCT Nuvectis Pharma, Inc. |
| Sector: Health Care | |
| SubSector: Biotechnology | |
| MarketCap: 258 Millions | |
| Recent Price: 6.62 Smart Investing & Trading Score: 42 | |
| Day Percent Change: 1.30% Day Change: 0.08 | |
| Week Change: 1.85% Year-to-date Change: -20.0% | |
| NVCT Links: Profile News Message Board | |
| Charts:- Daily , Weekly | |
| Add NVCT to Watchlist: View: Get Complete NVCT Trend Analysis ➞ | |
 | IRON Disc Medicine Opco Inc |
| Sector: Health Care | |
| SubSector: Biotechnology | |
| MarketCap: 1100 Millions | |
| Recent Price: 28.85 Smart Investing & Trading Score: 42 | |
| Day Percent Change: 1.17% Day Change: 0.34 | |
| Week Change: 4.89% Year-to-date Change: -50.3% | |
| IRON Links: Profile News Message Board | |
| Charts:- Daily , Weekly | |
| Add IRON to Watchlist: View: Get Complete IRON Trend Analysis ➞ | |
 | RCKT Rocket Pharmaceuticals, Inc. |
| Sector: Health Care | |
| SubSector: Biotechnology | |
| MarketCap: 899.585 Millions | |
| Recent Price: 22.77 Smart Investing & Trading Score: 42 | |
| Day Percent Change: 1.07% Day Change: 0.24 | |
| Week Change: 3.59% Year-to-date Change: -24.0% | |
| RCKT Links: Profile News Message Board | |
| Charts:- Daily , Weekly | |
| Add RCKT to Watchlist: View: Get Complete RCKT Trend Analysis ➞ | |
 | IMVT Immunovant, Inc. |
| Sector: Health Care | |
| SubSector: Biotechnology | |
| MarketCap: 552.885 Millions | |
| Recent Price: 28.77 Smart Investing & Trading Score: 42 | |
| Day Percent Change: 0.88% Day Change: 0.25 | |
| Week Change: 5.89% Year-to-date Change: -31.7% | |
| IMVT Links: Profile News Message Board | |
| Charts:- Daily , Weekly | |
| Add IMVT to Watchlist: View: Get Complete IMVT Trend Analysis ➞ | |
 | AVRO AVROBIO, Inc. |
| Sector: Health Care | |
| SubSector: Biotechnology | |
| MarketCap: 626.185 Millions | |
| Recent Price: 1.23 Smart Investing & Trading Score: 42 | |
| Day Percent Change: 0.82% Day Change: 0.01 | |
| Week Change: 1.65% Year-to-date Change: -9.6% | |
| AVRO Links: Profile News Message Board | |
| Charts:- Daily , Weekly | |
| Add AVRO to Watchlist: View: Get Complete AVRO Trend Analysis ➞ | |
 | MLTX MoonLake Immunotherapeutics |
| Sector: Health Care | |
| SubSector: Biotechnology | |
| MarketCap: 2670 Millions | |
| Recent Price: 43.23 Smart Investing & Trading Score: 42 | |
| Day Percent Change: 0.79% Day Change: 0.34 | |
| Week Change: 1.79% Year-to-date Change: -31.1% | |
| MLTX Links: Profile News Message Board | |
| Charts:- Daily , Weekly | |
| Add MLTX to Watchlist: View: Get Complete MLTX Trend Analysis ➞ | |
 | IMRX Immuneering Corporation |
| Sector: Health Care | |
| SubSector: Biotechnology | |
| MarketCap: 303 Millions | |
| Recent Price: 1.55 Smart Investing & Trading Score: 42 | |
| Day Percent Change: 0.65% Day Change: 0.01 | |
| Week Change: 5.44% Year-to-date Change: -79.6% | |
| IMRX Links: Profile News Message Board | |
| Charts:- Daily , Weekly | |
| Add IMRX to Watchlist: View: Get Complete IMRX Trend Analysis ➞ | |
 | GLPG Galapagos NV |
| Sector: Health Care | |
| SubSector: Biotechnology | |
| MarketCap: 9541.55 Millions | |
| Recent Price: 29.48 Smart Investing & Trading Score: 42 | |
| Day Percent Change: 0.46% Day Change: 0.14 | |
| Week Change: 2.49% Year-to-date Change: -27.5% | |
| GLPG Links: Profile News Message Board | |
| Charts:- Daily , Weekly | |
| Add GLPG to Watchlist: View: Get Complete GLPG Trend Analysis ➞ | |
 | DVAX Dynavax Technologies Corporation |
| Sector: Health Care | |
| SubSector: Biotechnology | |
| MarketCap: 276.885 Millions | |
| Recent Price: 11.73 Smart Investing & Trading Score: 42 | |
| Day Percent Change: 0.39% Day Change: 0.04 | |
| Week Change: 4.59% Year-to-date Change: -16.1% | |
| DVAX Links: Profile News Message Board | |
| Charts:- Daily , Weekly | |
| Add DVAX to Watchlist: View: Get Complete DVAX Trend Analysis ➞ | |
 | PEN Penumbra, Inc. |
| Sector: Health Care | |
| SubSector: Medical Instruments & Supplies | |
| MarketCap: 4854.1 Millions | |
| Recent Price: 206.06 Smart Investing & Trading Score: 42 | |
| Day Percent Change: 0.38% Day Change: 0.77 | |
| Week Change: 0.81% Year-to-date Change: -18.1% | |
| PEN Links: Profile News Message Board | |
| Charts:- Daily , Weekly | |
| Add PEN to Watchlist: View: Get Complete PEN Trend Analysis ➞ | |
 | HBIO Harvard Bioscience, Inc. |
| Sector: Health Care | |
| SubSector: Medical Instruments & Supplies | |
| MarketCap: 63.086 Millions | |
| Recent Price: 3.83 Smart Investing & Trading Score: 42 | |
| Day Percent Change: 0.26% Day Change: 0.01 | |
| Week Change: 5.8% Year-to-date Change: -28.4% | |
| HBIO Links: Profile News Message Board | |
| Charts:- Daily , Weekly | |
| Add HBIO to Watchlist: View: Get Complete HBIO Trend Analysis ➞ | |
 | VERO Venus Concept Inc. |
| Sector: Health Care | |
| SubSector: Medical Appliances & Equipment | |
| MarketCap: 101.08 Millions | |
| Recent Price: 0.67 Smart Investing & Trading Score: 42 | |
| Day Percent Change: 0.00% Day Change: 0.00 | |
| Week Change: -2.57% Year-to-date Change: -43.5% | |
| VERO Links: Profile News Message Board | |
| Charts:- Daily , Weekly | |
| Add VERO to Watchlist: View: Get Complete VERO Trend Analysis ➞ | |
 | ARCT Arcturus Therapeutics Holdings Inc. |
| Sector: Health Care | |
| SubSector: Biotechnology | |
| MarketCap: 241.385 Millions | |
| Recent Price: 26.54 Smart Investing & Trading Score: 42 | |
| Day Percent Change: -4.91% Day Change: -1.37 | |
| Week Change: -0.04% Year-to-date Change: -15.8% | |
| ARCT Links: Profile News Message Board | |
| Charts:- Daily , Weekly | |
| Add ARCT to Watchlist: View: Get Complete ARCT Trend Analysis ➞ | |
 | FGEN FibroGen, Inc. |
| Sector: Health Care | |
| SubSector: Biotechnology | |
| MarketCap: 2502.95 Millions | |
| Recent Price: 1.13 Smart Investing & Trading Score: 42 | |
| Day Percent Change: -3.42% Day Change: -0.04 | |
| Week Change: 8.65% Year-to-date Change: 27.5% | |
| FGEN Links: Profile News Message Board | |
| Charts:- Daily , Weekly | |
| Add FGEN to Watchlist: View: Get Complete FGEN Trend Analysis ➞ | |
 | ACIU AC Immune SA |
| Sector: Health Care | |
| SubSector: Biotechnology | |
| MarketCap: 356.585 Millions | |
| Recent Price: 2.42 Smart Investing & Trading Score: 42 | |
| Day Percent Change: -3.20% Day Change: -0.08 | |
| Week Change: 2.98% Year-to-date Change: -51.6% | |
| ACIU Links: Profile News Message Board | |
| Charts:- Daily , Weekly | |
| Add ACIU to Watchlist: View: Get Complete ACIU Trend Analysis ➞ | |
 | CMPS COMPASS Pathways plc |
| Sector: Health Care | |
| SubSector: Medical Care Facilities | |
| MarketCap: 19587 Millions | |
| Recent Price: 8.26 Smart Investing & Trading Score: 42 | |
| Day Percent Change: -2.59% Day Change: -0.22 | |
| Week Change: 4.03% Year-to-date Change: -5.5% | |
| CMPS Links: Profile News Message Board | |
| Charts:- Daily , Weekly | |
| Add CMPS to Watchlist: View: Get Complete CMPS Trend Analysis ➞ | |
 | BTMD biote Corp. |
| Sector: Health Care | |
| SubSector: Medical Care Facilities | |
| MarketCap: 468 Millions | |
| Recent Price: 5.58 Smart Investing & Trading Score: 42 | |
| Day Percent Change: -1.06% Day Change: -0.06 | |
| Week Change: 1.09% Year-to-date Change: 12.5% | |
| BTMD Links: Profile News Message Board | |
| Charts:- Daily , Weekly | |
| Add BTMD to Watchlist: View: Get Complete BTMD Trend Analysis ➞ | |
 | ORGO Organogenesis Holdings Inc. |
| Sector: Health Care | |
| SubSector: Drugs - Generic | |
| MarketCap: 239.685 Millions | |
| Recent Price: 2.50 Smart Investing & Trading Score: 42 | |
| Day Percent Change: -0.60% Day Change: -0.01 | |
| Week Change: 6.17% Year-to-date Change: -39.0% | |
| ORGO Links: Profile News Message Board | |
| Charts:- Daily , Weekly | |
| Add ORGO to Watchlist: View: Get Complete ORGO Trend Analysis ➞ | |
 | IGMS IGM Biosciences, Inc. |
| Sector: Health Care | |
| SubSector: Biotechnology | |
| MarketCap: 2000.05 Millions | |
| Recent Price: 9.44 Smart Investing & Trading Score: 42 | |
| Day Percent Change: -0.42% Day Change: -0.04 | |
| Week Change: 0.43% Year-to-date Change: 13.6% | |
| IGMS Links: Profile News Message Board | |
| Charts:- Daily , Weekly | |
| Add IGMS to Watchlist: View: Get Complete IGMS Trend Analysis ➞ | |
 | FOLD Amicus Therapeutics, Inc. |
| Sector: Health Care | |
| SubSector: Biotechnology | |
| MarketCap: 2676.75 Millions | |
| Recent Price: 10.41 Smart Investing & Trading Score: 42 | |
| Day Percent Change: -0.19% Day Change: -0.02 | |
| Week Change: 1.26% Year-to-date Change: -26.6% | |
| FOLD Links: Profile News Message Board | |
| Charts:- Daily , Weekly | |
| Add FOLD to Watchlist: View: Get Complete FOLD Trend Analysis ➞ | |
 | TERN Terns Pharmaceuticals, Inc. |
| Sector: Health Care | |
| SubSector: Biotechnology | |
| MarketCap: 611 Millions | |
| Recent Price: 5.14 Smart Investing & Trading Score: 42 | |
| Day Percent Change: 0.78% Day Change: 0.04 | |
| Week Change: 4.68% Year-to-date Change: -22.2% | |
| TERN Links: Profile News Message Board | |
| Charts:- Daily , Weekly | |
| Add TERN to Watchlist: View: Get Complete TERN Trend Analysis ➞ | |
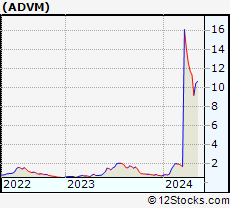 | ADVM Adverum Biotechnologies, Inc. |
| Sector: Health Care | |
| SubSector: Biotechnology | |
| MarketCap: 902.585 Millions | |
| Recent Price: 10.00 Smart Investing & Trading Score: 41 | |
| Day Percent Change: 2.15% Day Change: 0.21 | |
| Week Change: 8.81% Year-to-date Change: 1,228.4% | |
| ADVM Links: Profile News Message Board | |
| Charts:- Daily , Weekly | |
| Add ADVM to Watchlist: View: Get Complete ADVM Trend Analysis ➞ | |
 | XFOR X4 Pharmaceuticals, Inc. |
| Sector: Health Care | |
| SubSector: Biotechnology | |
| MarketCap: 143.385 Millions | |
| Recent Price: 1.09 Smart Investing & Trading Score: 41 | |
| Day Percent Change: -1.36% Day Change: -0.01 | |
| Week Change: -6.44% Year-to-date Change: 30.0% | |
| XFOR Links: Profile News Message Board | |
| Charts:- Daily , Weekly | |
| Add XFOR to Watchlist: View: Get Complete XFOR Trend Analysis ➞ | |
| For tabular summary view of above stock list: Summary View ➞ 0 - 25 , 25 - 50 , 50 - 75 , 75 - 100 , 100 - 125 , 125 - 150 , 150 - 175 , 175 - 200 , 200 - 225 , 225 - 250 , 250 - 275 , 275 - 300 , 300 - 325 , 325 - 350 , 350 - 375 , 375 - 400 , 400 - 425 , 425 - 450 , 450 - 475 , 475 - 500 , 500 - 525 , 525 - 550 , 550 - 575 , 575 - 600 , 600 - 625 , 625 - 650 , 650 - 675 , 675 - 700 , 700 - 725 | ||
| Click To Change The Sort Order: By Market Cap or Company Size Performance: Year-to-date, Week and Day | |
| Select Chart Type: | ||
|
Best Stocks Today 12Stocks.com |
© 2024 12Stocks.com Terms & Conditions Privacy Contact Us
All Information Provided Only For Education And Not To Be Used For Investing or Trading. See Terms & Conditions


One More Thing ... Get Best Stocks Delivered Daily!
Never Ever Miss A Move With Our Top Ten Stocks Lists
Find Best Stocks In Any Market - Bull or Bear Market
Take A Peek At Our Top Ten Stocks Lists: Daily, Weekly, Year-to-Date & Top Trends
Find Best Stocks In Any Market - Bull or Bear Market
Take A Peek At Our Top Ten Stocks Lists: Daily, Weekly, Year-to-Date & Top Trends
Healthcare Stocks With Best Up Trends [0-bearish to 100-bullish]: Emergent Bio[100], Lantheus [100], Blueprint Medicines[100], Glaukos [100], TransMedics [100], Corcept [100], Avanos [100], IRadimed [100], Castle Biosciences[100], Anika [100], Surmodics [100]
Best Healthcare Stocks Year-to-Date:
Pieris [6064.83%], Avenue [2924.84%], Precision BioSciences[2842.47%], Inovio [2249.02%], Assembly Biosciences[1493.71%], Agenus [1414.68%], Aurora Cannabis[1362.62%], NuCana [1245.5%], Adverum Biotechnologies[1228.37%], Affimed N.V[740%], CareMax [674.23%] Best Healthcare Stocks This Week:
CytomX [182.08%], GeneDx [75.99%], Deciphera [73.17%], Emergent Bio[71.88%], P3 Health[38.51%], Cue Biopharma[36.26%], TransMedics [35.13%], Seres [33.33%], Surmodics [31.94%], Phibro Animal[31.58%], Poseida [31.22%] Best Healthcare Stocks Daily:
Emergent Bio[70.98%], Pulmonx [21.37%], Regencell Bioscience[21.25%], Orchestra BioMed[18.83%], Ocular Therapeutix[16.53%], Lantheus [16.01%], Cellectis S.A[14.75%], Butterfly Network[13.09%], Blueprint Medicines[12.75%], Moderna [12.70%], Mustang Bio[12.65%]