
 Login Sign Up


| |||||
 |  | ||||

| 12Stocks.com Market Intelligence |
Best Healthcare Stocks
 | "Discover best trending healthcare stocks with 12Stocks.com." |
| - Subu Vdaygiri, Founder, 12Stocks.com |
| In a hurry? Healthcare Stocks Lists: Performance Trends Table, Stock Charts
Sort Healthcare stocks: Daily, Weekly, Year-to-Date, Market Cap & Trends. Filter Healthcare stocks list by size:All Healthcare Large Mid-Range Small |
| 12Stocks.com Healthcare Stocks Performances & Trends Daily | |||||||||
|
|  The overall Smart Investing & Trading Score is 57 (0-bearish to 100-bullish) which puts Healthcare sector in short term neutral trend. The Smart Investing & Trading Score from previous trading session is 60 and a deterioration of trend continues.
| ||||||||
Here are the Smart Investing & Trading Scores of the most requested Healthcare stocks at 12Stocks.com (click stock name for detailed review):
|


| 12Stocks.com: Investing in Healthcare sector with Stocks | |
|
The following table helps investors and traders sort through current performance and trends (as measured by Smart Investing & Trading Score) of various
stocks in the Healthcare sector. Quick View: Move mouse or cursor over stock symbol (ticker) to view short-term Technical chart and over stock name to view long term chart. Click on  to add stock symbol to your watchlist and to add stock symbol to your watchlist and  to view watchlist. Click on any ticker or stock name for detailed market intelligence report for that stock. to view watchlist. Click on any ticker or stock name for detailed market intelligence report for that stock. |
12Stocks.com Performance of Stocks in Healthcare Sector
| Ticker | Stock Name | Watchlist | Category | Recent Price | Smart Investing & Trading Score | Change % | YTD Change% |
| HALO | Halozyme |   | Biotechnology | 39.82 | 69 | 1.32% | 7.74% |
| MRUS | Merus N.V | | Biotechnology | 47.50 | 69 | 1.02% | 72.73% |
| TNYA | Tenaya | | Biotechnology | 4.74 | 69 | 0.96% | 48.90% |
| ICUI | ICU | | Instruments | 99.04 | 69 | 0.76% | -0.70% |
| KYMR | Kymera | | Biotechnology | 36.30 | 69 | 0.17% | 42.86% |
| CUE | Cue Biopharma | | Biotechnology | 1.88 | 69 | -1.31% | -28.79% |
| LMAT | LeMaitre Vascular | | Instruments | 66.77 | 69 | -0.01% | 17.64% |
| TNDM | Tandem Diabetes | | Instruments | 36.56 | 68 | 0.99% | 23.60% |
| CYH | Community Health | | Hospitals | 3.29 | 68 | -4.36% | 5.11% |
| ESTA | Establishment Labs | | Equipment | 49.50 | 68 | -2.19% | 91.19% |
| CRON | Cronos | | Biotechnology | 2.66 | 68 | -1.85% | 27.27% |
| DGX | Quest Diagnostics | | Laboratories | 136.34 | 68 | -0.88% | -1.12% |
| NCNA | NuCana | | Biotechnology | 3.96 | 68 | -0.38% | NA |
| AGTI | Agiliti | | Health Information | 10.09 | 68 | -0.15% | 27.98% |
| HUM | Humana | | Insurance | 320.98 | 67 | 2.15% | -29.89% |
| AMED | Amedisys | | Home Care | 92.43 | 67 | 0.59% | -2.77% |
| CTKB | Cytek Biosciences | | Medical Devices | 6.34 | 67 | -0.55% | -31.05% |
| QDEL | Quidel | | Diagnostic | 42.22 | 67 | 6.40% | -42.71% |
| RLAY | Relay | | Biotechnology | 7.08 | 67 | 6.31% | -35.64% |
| BFLY | Butterfly Network | | Medical Devices | 0.89 | 67 | 13.09% | -21.24% |
| MLYS | Mineralys | | Biotechnology | 12.93 | 67 | 0.23% | 48.22% |
| SNDX | Syndax | | Biotechnology | 21.86 | 67 | -0.50% | 1.16% |
| OCS | Oculis Holding | | Biotechnology | 12.81 | 66 | -0.62% | 15.40% |
| ATRI | Atrion | | Instruments | 414.95 | 65 | -2.79% | 9.55% |
| OCX | OncoCyte | | Biotechnology | 2.78 | 64 | 8.98% | 11.16% |
| For chart view version of above stock list: Chart View ➞ 0 - 25 , 25 - 50 , 50 - 75 , 75 - 100 , 100 - 125 , 125 - 150 , 150 - 175 , 175 - 200 , 200 - 225 , 225 - 250 , 250 - 275 , 275 - 300 , 300 - 325 , 325 - 350 , 350 - 375 , 375 - 400 , 400 - 425 , 425 - 450 , 450 - 475 , 475 - 500 , 500 - 525 , 525 - 550 , 550 - 575 , 575 - 600 , 600 - 625 , 625 - 650 , 650 - 675 , 675 - 700 , 700 - 725 | ||
 | Click To Change The Sort Order: By Market Cap or Company Size Performance: Year-to-date, Week and Day |  |
|
Get the most comprehensive stock market coverage daily at 12Stocks.com ➞ Best Stocks Today ➞ Best Stocks Weekly ➞ Best Stocks Year-to-Date ➞ Best Stocks Trends ➞  Best Stocks Today 12Stocks.com Best Nasdaq Stocks ➞ Best S&P 500 Stocks ➞ Best Tech Stocks ➞ Best Biotech Stocks ➞ |
| Detailed Overview of Healthcare Stocks |
| Healthcare Technical Overview, Leaders & Laggards, Top Healthcare ETF Funds & Detailed Healthcare Stocks List, Charts, Trends & More |
| Healthcare Sector: Technical Analysis, Trends & YTD Performance | |
| Healthcare sector is composed of stocks
from pharmaceutical, biotech, diagnostics labs, insurance providers
and healthcare services. Healthcare sector, as represented by XLV, an exchange-traded fund [ETF] that holds basket of Healthcare stocks (e.g, Merck, Amgen) is up by 3.01% and is currently underperforming the overall market by -2.61% year-to-date. Below is a quick view of Technical charts and trends: |
|
 XLV Weekly Chart |
|
| Long Term Trend: Not Good | |
| Medium Term Trend: Good | |
 XLV Daily Chart |
|
| Short Term Trend: Very Good | |
| Overall Trend Score: 57 | |
| YTD Performance: 3.01% | |
| **Trend Scores & Views Are Only For Educational Purposes And Not For Investing | |
| 12Stocks.com: Top Performing Healthcare Sector Stocks | ||||||||||||||||||||||||||||||||||||||||||||||||
 The top performing Healthcare sector stocks year to date are
Now, more recently, over last week, the top performing Healthcare sector stocks on the move are


|
||||||||||||||||||||||||||||||||||||||||||||||||
| 12Stocks.com: Investing in Healthcare Sector using Exchange Traded Funds | |
|
The following table shows list of key exchange traded funds (ETF) that
help investors track Healthcare Index. For detailed view, check out our ETF Funds section of our website. Quick View: Move mouse or cursor over ETF symbol (ticker) to view short-term Technical chart and over ETF name to view long term chart. Click on ticker or stock name for detailed view. Click on to add stock symbol to your watchlist and to view watchlist. |
12Stocks.com List of ETFs that track Healthcare Index
| Ticker | ETF Name | Watchlist | Recent Price | Smart Investing & Trading Score | Change % | Week % | Year-to-date % |
| XLV | Health Care | | 140.48 | 57 | -0.07 | 0.37 | 3.01% |
| XBI | Biotech | | 88.34 | 50 | 1.16 | 5.81 | -1.06% |
| IBB | Biotechnology | | 130.65 | 64 | 0.90 | 3.29 | -3.83% |
| BBH | Biotech | | 160.51 | 64 | 1.18 | 3.12 | -2.9% |
| VHT | Health Care | | 257.14 | 50 | -0.05 | 0.71 | 2.57% |
| IYH | Healthcare | | 59.12 | 50 | -0.10 | 0.87 | 3.27% |
| IHF | Healthcare Providers | | 51.65 | 15 | 0.41 | -0.52 | -1.64% |
| IHI | Medical Devices | | 55.16 | 10 | 0.25 | -0.67 | 2.2% |
| BIB | Biotechnology | | 53.80 | 69 | 2.32 | 8.34 | -5.7% |
| BIS | Short Biotech | | 18.66 | 36 | -2.36 | -7.72 | 3.26% |
| XHE | Health Care Equipment | | 84.89 | 80 | 1.16 | 2.98 | 0.75% |
| CURE | Healthcare Bull 3X | | 105.81 | 35 | -0.70 | 0.48 | 4% |
| LABU | Biotech Bull 3X | | 102.99 | 42 | 3.19 | 17.69 | -15.56% |
| LABD | Biotech Bear 3X | | 8.76 | 36 | -2.99 | -16.73 | -9.6% |
| PSCH | SmallCap Health Care | | 42.05 | 62 | 1.33 | 3.32 | -1.75% |
| XHS | Health Care Services | | 88.14 | 20 | -0.19 | 0.31 | -0.91% |
| PTH | DWA Healthcare Momentum | | 41.74 | 50 | 1.14 | 4.64 | 6.64% |
| BTEC | Principal Healthcare Innovators | | 35.98 | 55 | 0.25 | 5.07 | -0.95% |
| RXL | Health Care | | 95.21 | 54 | -0.12 | 0.41 | 4.16% |
| RXD | Short Health Care | | 11.34 | 49 | -0.18 | -0.96 | -4.91% |
| 12Stocks.com: Charts, Trends, Fundamental Data and Performances of Healthcare Stocks | |
|
We now take in-depth look at all Healthcare stocks including charts, multi-period performances and overall trends (as measured by Smart Investing & Trading Score). One can sort Healthcare stocks (click link to choose) by Daily, Weekly and by Year-to-Date performances. Also, one can sort by size of the company or by market capitalization. |
| Select Your Default Chart Type: | |||||
| |||||
| Click on stock symbol or name for detailed view. Click on to add stock symbol to your watchlist and to view watchlist. Quick View: Move mouse or cursor over "Daily" to quickly view daily Technical stock chart and over "Weekly" to view weekly Technical stock chart. | |||||

 | HALO Halozyme Therapeutics, Inc. |
| Sector: Health Care | |
| SubSector: Biotechnology | |
| MarketCap: 2383.75 Millions | |
| Recent Price: 39.82 Smart Investing & Trading Score: 69 | |
| Day Percent Change: 1.32% Day Change: 0.52 | |
| Week Change: 3.24% Year-to-date Change: 7.7% | |
| HALO Links: Profile News Message Board | |
| Charts:- Daily , Weekly | |
| Add HALO to Watchlist: View: Get Complete HALO Trend Analysis ➞ | |
 | MRUS Merus N.V. |
| Sector: Health Care | |
| SubSector: Biotechnology | |
| MarketCap: 417.385 Millions | |
| Recent Price: 47.50 Smart Investing & Trading Score: 69 | |
| Day Percent Change: 1.02% Day Change: 0.48 | |
| Week Change: 5.46% Year-to-date Change: 72.7% | |
| MRUS Links: Profile News Message Board | |
| Charts:- Daily , Weekly | |
| Add MRUS to Watchlist: View: Get Complete MRUS Trend Analysis ➞ | |
 | TNYA Tenaya Therapeutics, Inc. |
| Sector: Health Care | |
| SubSector: Biotechnology | |
| MarketCap: 395 Millions | |
| Recent Price: 4.74 Smart Investing & Trading Score: 69 | |
| Day Percent Change: 0.96% Day Change: 0.04 | |
| Week Change: 9.86% Year-to-date Change: 48.9% | |
| TNYA Links: Profile News Message Board | |
| Charts:- Daily , Weekly | |
| Add TNYA to Watchlist: View: Get Complete TNYA Trend Analysis ➞ | |
 | ICUI ICU Medical, Inc. |
| Sector: Health Care | |
| SubSector: Medical Instruments & Supplies | |
| MarketCap: 3640.7 Millions | |
| Recent Price: 99.04 Smart Investing & Trading Score: 69 | |
| Day Percent Change: 0.76% Day Change: 0.75 | |
| Week Change: 4.43% Year-to-date Change: -0.7% | |
| ICUI Links: Profile News Message Board | |
| Charts:- Daily , Weekly | |
| Add ICUI to Watchlist: View: Get Complete ICUI Trend Analysis ➞ | |
 | KYMR Kymera Therapeutics, Inc. |
| Sector: Health Care | |
| SubSector: Biotechnology | |
| MarketCap: 27087 Millions | |
| Recent Price: 36.30 Smart Investing & Trading Score: 69 | |
| Day Percent Change: 0.17% Day Change: 0.06 | |
| Week Change: 8.78% Year-to-date Change: 42.9% | |
| KYMR Links: Profile News Message Board | |
| Charts:- Daily , Weekly | |
| Add KYMR to Watchlist: View: Get Complete KYMR Trend Analysis ➞ | |
 | CUE Cue Biopharma, Inc. |
| Sector: Health Care | |
| SubSector: Biotechnology | |
| MarketCap: 352.785 Millions | |
| Recent Price: 1.88 Smart Investing & Trading Score: 69 | |
| Day Percent Change: -1.31% Day Change: -0.03 | |
| Week Change: 37.73% Year-to-date Change: -28.8% | |
| CUE Links: Profile News Message Board | |
| Charts:- Daily , Weekly | |
| Add CUE to Watchlist: View: Get Complete CUE Trend Analysis ➞ | |
 | LMAT LeMaitre Vascular, Inc. |
| Sector: Health Care | |
| SubSector: Medical Instruments & Supplies | |
| MarketCap: 522.16 Millions | |
| Recent Price: 66.77 Smart Investing & Trading Score: 69 | |
| Day Percent Change: -0.01% Day Change: -0.01 | |
| Week Change: 2% Year-to-date Change: 17.6% | |
| LMAT Links: Profile News Message Board | |
| Charts:- Daily , Weekly | |
| Add LMAT to Watchlist: View: Get Complete LMAT Trend Analysis ➞ | |
 | TNDM Tandem Diabetes Care, Inc. |
| Sector: Health Care | |
| SubSector: Medical Instruments & Supplies | |
| MarketCap: 3359.1 Millions | |
| Recent Price: 36.56 Smart Investing & Trading Score: 68 | |
| Day Percent Change: 0.99% Day Change: 0.36 | |
| Week Change: 3.75% Year-to-date Change: 23.6% | |
| TNDM Links: Profile News Message Board | |
| Charts:- Daily , Weekly | |
| Add TNDM to Watchlist: View: Get Complete TNDM Trend Analysis ➞ | |
 | CYH Community Health Systems, Inc. |
| Sector: Health Care | |
| SubSector: Hospitals | |
| MarketCap: 371.546 Millions | |
| Recent Price: 3.29 Smart Investing & Trading Score: 68 | |
| Day Percent Change: -4.36% Day Change: -0.15 | |
| Week Change: -2.95% Year-to-date Change: 5.1% | |
| CYH Links: Profile News Message Board | |
| Charts:- Daily , Weekly | |
| Add CYH to Watchlist: View: Get Complete CYH Trend Analysis ➞ | |
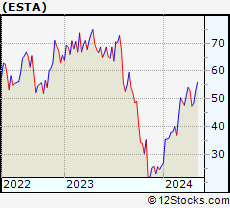 | ESTA Establishment Labs Holdings Inc. |
| Sector: Health Care | |
| SubSector: Medical Appliances & Equipment | |
| MarketCap: 301.78 Millions | |
| Recent Price: 49.50 Smart Investing & Trading Score: 68 | |
| Day Percent Change: -2.19% Day Change: -1.11 | |
| Week Change: 2.13% Year-to-date Change: 91.2% | |
| ESTA Links: Profile News Message Board | |
| Charts:- Daily , Weekly | |
| Add ESTA to Watchlist: View: Get Complete ESTA Trend Analysis ➞ | |
 | CRON Cronos Group Inc. |
| Sector: Health Care | |
| SubSector: Biotechnology | |
| MarketCap: 1935.95 Millions | |
| Recent Price: 2.66 Smart Investing & Trading Score: 68 | |
| Day Percent Change: -1.85% Day Change: -0.05 | |
| Week Change: 2.7% Year-to-date Change: 27.3% | |
| CRON Links: Profile News Message Board | |
| Charts:- Daily , Weekly | |
| Add CRON to Watchlist: View: Get Complete CRON Trend Analysis ➞ | |
 | DGX Quest Diagnostics Incorporated |
| Sector: Health Care | |
| SubSector: Medical Laboratories & Research | |
| MarketCap: 11076.1 Millions | |
| Recent Price: 136.34 Smart Investing & Trading Score: 68 | |
| Day Percent Change: -0.88% Day Change: -1.21 | |
| Week Change: 1.55% Year-to-date Change: -1.1% | |
| DGX Links: Profile News Message Board | |
| Charts:- Daily , Weekly | |
| Add DGX to Watchlist: View: Get Complete DGX Trend Analysis ➞ | |
 | NCNA NuCana plc |
| Sector: Health Care | |
| SubSector: Biotechnology | |
| MarketCap: 185.785 Millions | |
| Recent Price: 3.96 Smart Investing & Trading Score: 68 | |
| Day Percent Change: -0.38% Day Change: -0.02 | |
| Week Change: -0.88% Year-to-date Change: 1,240.4% | |
| NCNA Links: Profile News Message Board | |
| Charts:- Daily , Weekly | |
| Add NCNA to Watchlist: View: Get Complete NCNA Trend Analysis ➞ | |
 | AGTI Agiliti, Inc. |
| Sector: Health Care | |
| SubSector: Health Information Services | |
| MarketCap: 2270 Millions | |
| Recent Price: 10.09 Smart Investing & Trading Score: 68 | |
| Day Percent Change: -0.15% Day Change: -0.01 | |
| Week Change: 0.35% Year-to-date Change: 28.0% | |
| AGTI Links: Profile News Message Board | |
| Charts:- Daily , Weekly | |
| Add AGTI to Watchlist: View: Get Complete AGTI Trend Analysis ➞ | |
 | HUM Humana Inc. |
| Sector: Health Care | |
| SubSector: Health Care Plans | |
| MarketCap: 34125.6 Millions | |
| Recent Price: 320.98 Smart Investing & Trading Score: 67 | |
| Day Percent Change: 2.15% Day Change: 6.77 | |
| Week Change: 4.93% Year-to-date Change: -29.9% | |
| HUM Links: Profile News Message Board | |
| Charts:- Daily , Weekly | |
| Add HUM to Watchlist: View: Get Complete HUM Trend Analysis ➞ | |
 | AMED Amedisys, Inc. |
| Sector: Health Care | |
| SubSector: Home Health Care | |
| MarketCap: 6058.95 Millions | |
| Recent Price: 92.43 Smart Investing & Trading Score: 67 | |
| Day Percent Change: 0.59% Day Change: 0.54 | |
| Week Change: 0.7% Year-to-date Change: -2.8% | |
| AMED Links: Profile News Message Board | |
| Charts:- Daily , Weekly | |
| Add AMED to Watchlist: View: Get Complete AMED Trend Analysis ➞ | |
 | CTKB Cytek Biosciences, Inc. |
| Sector: Health Care | |
| SubSector: Medical Devices | |
| MarketCap: 1140 Millions | |
| Recent Price: 6.34 Smart Investing & Trading Score: 67 | |
| Day Percent Change: -0.55% Day Change: -0.04 | |
| Week Change: 10.07% Year-to-date Change: -31.1% | |
| CTKB Links: Profile News Message Board | |
| Charts:- Daily , Weekly | |
| Add CTKB to Watchlist: View: Get Complete CTKB Trend Analysis ➞ | |
 | QDEL Quidel Corporation |
| Sector: Health Care | |
| SubSector: Diagnostic Substances | |
| MarketCap: 4104.91 Millions | |
| Recent Price: 42.22 Smart Investing & Trading Score: 67 | |
| Day Percent Change: 6.40% Day Change: 2.54 | |
| Week Change: 6.51% Year-to-date Change: -42.7% | |
| QDEL Links: Profile News Message Board | |
| Charts:- Daily , Weekly | |
| Add QDEL to Watchlist: View: Get Complete QDEL Trend Analysis ➞ | |
 | RLAY Relay Therapeutics, Inc. |
| Sector: Health Care | |
| SubSector: Biotechnology | |
| MarketCap: 45887 Millions | |
| Recent Price: 7.08 Smart Investing & Trading Score: 67 | |
| Day Percent Change: 6.31% Day Change: 0.42 | |
| Week Change: 11.15% Year-to-date Change: -35.6% | |
| RLAY Links: Profile News Message Board | |
| Charts:- Daily , Weekly | |
| Add RLAY to Watchlist: View: Get Complete RLAY Trend Analysis ➞ | |
 | BFLY Butterfly Network, Inc. |
| Sector: Health Care | |
| SubSector: Medical Devices | |
| MarketCap: 461 Millions | |
| Recent Price: 0.89 Smart Investing & Trading Score: 67 | |
| Day Percent Change: 13.09% Day Change: 0.10 | |
| Week Change: 14.28% Year-to-date Change: -21.2% | |
| BFLY Links: Profile News Message Board | |
| Charts:- Daily , Weekly | |
| Add BFLY to Watchlist: View: Get Complete BFLY Trend Analysis ➞ | |
 | MLYS Mineralys Therapeutics, Inc. |
| Sector: Health Care | |
| SubSector: Biotechnology | |
| MarketCap: 719 Millions | |
| Recent Price: 12.93 Smart Investing & Trading Score: 67 | |
| Day Percent Change: 0.23% Day Change: 0.03 | |
| Week Change: 8.98% Year-to-date Change: 48.2% | |
| MLYS Links: Profile News Message Board | |
| Charts:- Daily , Weekly | |
| Add MLYS to Watchlist: View: Get Complete MLYS Trend Analysis ➞ | |
 | SNDX Syndax Pharmaceuticals, Inc. |
| Sector: Health Care | |
| SubSector: Biotechnology | |
| MarketCap: 365.985 Millions | |
| Recent Price: 21.86 Smart Investing & Trading Score: 67 | |
| Day Percent Change: -0.50% Day Change: -0.11 | |
| Week Change: 3.8% Year-to-date Change: 1.2% | |
| SNDX Links: Profile News Message Board | |
| Charts:- Daily , Weekly | |
| Add SNDX to Watchlist: View: Get Complete SNDX Trend Analysis ➞ | |
 | OCS Oculis Holding AG |
| Sector: Health Care | |
| SubSector: Biotechnology | |
| MarketCap: 460 Millions | |
| Recent Price: 12.81 Smart Investing & Trading Score: 66 | |
| Day Percent Change: -0.62% Day Change: -0.08 | |
| Week Change: 6.57% Year-to-date Change: 15.4% | |
| OCS Links: Profile News Message Board | |
| Charts:- Daily , Weekly | |
| Add OCS to Watchlist: View: Get Complete OCS Trend Analysis ➞ | |
 | ATRI Atrion Corporation |
| Sector: Health Care | |
| SubSector: Medical Instruments & Supplies | |
| MarketCap: 1234.6 Millions | |
| Recent Price: 414.95 Smart Investing & Trading Score: 65 | |
| Day Percent Change: -2.79% Day Change: -11.93 | |
| Week Change: 5.05% Year-to-date Change: 9.6% | |
| ATRI Links: Profile News Message Board | |
| Charts:- Daily , Weekly | |
| Add ATRI to Watchlist: View: Get Complete ATRI Trend Analysis ➞ | |
 | OCX OncoCyte Corporation |
| Sector: Health Care | |
| SubSector: Biotechnology | |
| MarketCap: 131.485 Millions | |
| Recent Price: 2.78 Smart Investing & Trading Score: 64 | |
| Day Percent Change: 8.98% Day Change: 0.23 | |
| Week Change: 12.06% Year-to-date Change: 11.2% | |
| OCX Links: Profile News Message Board | |
| Charts:- Daily , Weekly | |
| Add OCX to Watchlist: View: Get Complete OCX Trend Analysis ➞ | |
| For tabular summary view of above stock list: Summary View ➞ 0 - 25 , 25 - 50 , 50 - 75 , 75 - 100 , 100 - 125 , 125 - 150 , 150 - 175 , 175 - 200 , 200 - 225 , 225 - 250 , 250 - 275 , 275 - 300 , 300 - 325 , 325 - 350 , 350 - 375 , 375 - 400 , 400 - 425 , 425 - 450 , 450 - 475 , 475 - 500 , 500 - 525 , 525 - 550 , 550 - 575 , 575 - 600 , 600 - 625 , 625 - 650 , 650 - 675 , 675 - 700 , 700 - 725 | ||
| Click To Change The Sort Order: By Market Cap or Company Size Performance: Year-to-date, Week and Day | |
| Select Chart Type: | ||
|
Best Stocks Today 12Stocks.com |
© 2024 12Stocks.com Terms & Conditions Privacy Contact Us
All Information Provided Only For Education And Not To Be Used For Investing or Trading. See Terms & Conditions


One More Thing ... Get Best Stocks Delivered Daily!
Never Ever Miss A Move With Our Top Ten Stocks Lists
Find Best Stocks In Any Market - Bull or Bear Market
Take A Peek At Our Top Ten Stocks Lists: Daily, Weekly, Year-to-Date & Top Trends
Find Best Stocks In Any Market - Bull or Bear Market
Take A Peek At Our Top Ten Stocks Lists: Daily, Weekly, Year-to-Date & Top Trends
Healthcare Stocks With Best Up Trends [0-bearish to 100-bullish]: Emergent Bio[100], Lantheus [100], Blueprint Medicines[100], Moderna [100], Veru [100], Palatin Technologies[100], Avid Bioservices[100], Glaukos [100], Rockwell [100], TransMedics [100], Repro Med[100]
Best Healthcare Stocks Year-to-Date:
Pieris [6075.82%], Precision BioSciences[2869.86%], Avenue [2850.31%], Inovio [2254.9%], Assembly Biosciences[1462%], Agenus [1412.26%], Aurora Cannabis[1363.67%], NuCana [1240.43%], Adverum Biotechnologies[1228.37%], Affimed N.V[748%], CareMax [674.23%] Best Healthcare Stocks This Week:
CytomX [183.02%], GeneDx [75.99%], Deciphera [73.24%], Emergent Bio[71.88%], P3 Health[38.51%], Cue Biopharma[37.73%], TransMedics [35.14%], Seres [34.55%], Surmodics [32.02%], Phibro Animal[31.66%], Poseida [30.99%] Best Healthcare Stocks Daily:
Emergent Bio[70.98%], Regencell Bioscience[23.15%], Pulmonx [21.50%], Orchestra BioMed[18.83%], Cellectis S.A[17.90%], Ocular Therapeutix[16.93%], Lantheus [16.01%], Butterfly Network[13.09%], Blueprint Medicines[12.80%], Moderna [12.68%], Mustang Bio[12.65%]