
 Login Sign Up


| |||||
 |  | ||||

| 12Stocks.com Market Intelligence |
Best Healthcare Stocks
 | "Discover best trending healthcare stocks with 12Stocks.com." |
| - Subu Vdaygiri, Founder, 12Stocks.com |
| In a hurry? Healthcare Stocks Lists: Performance Trends Table, Stock Charts
Sort Healthcare stocks: Daily, Weekly, Year-to-Date, Market Cap & Trends. Filter Healthcare stocks list by size:All Healthcare Large Mid-Range Small |
| 12Stocks.com Healthcare Stocks Performances & Trends Daily | |||||||||
|
|  The overall Smart Investing & Trading Score is 25 (0-bearish to 100-bullish) which puts Healthcare sector in short term bearish to neutral trend. The Smart Investing & Trading Score from previous trading session is 18 and hence an improvement of trend.
| ||||||||
Here are the Smart Investing & Trading Scores of the most requested Healthcare stocks at 12Stocks.com (click stock name for detailed review):
|


| 12Stocks.com: Investing in Healthcare sector with Stocks | |
|
The following table helps investors and traders sort through current performance and trends (as measured by Smart Investing & Trading Score) of various
stocks in the Healthcare sector. Quick View: Move mouse or cursor over stock symbol (ticker) to view short-term Technical chart and over stock name to view long term chart. Click on  to add stock symbol to your watchlist and to add stock symbol to your watchlist and  to view watchlist. Click on any ticker or stock name for detailed market intelligence report for that stock. to view watchlist. Click on any ticker or stock name for detailed market intelligence report for that stock. |
12Stocks.com Performance of Stocks in Healthcare Sector
| Ticker | Stock Name | Watchlist | Category | Recent Price | Smart Investing & Trading Score | Change % | YTD Change% |
| WGS | GeneDx |   | Health Information | 9.64 | 76 | 0.78% | 254.41% |
| VRCA | Verrica | | Biotechnology | 6.96 | 76 | 0.72% | -4.92% |
| PBH | Prestige Consumer | | Equipment | 69.67 | 75 | 1.93% | 13.80% |
| UNH | UnitedHealth | | Insurance | 501.13 | 74 | 1.61% | -4.81% |
| NCNA | NuCana | | Biotechnology | 3.81 | 73 | -5.93% | NA |
| ZCMD | Zhongchao | | Health Information | 1.87 | 73 | -44.67% | 412.19% |
| AZN | AstraZeneca | | Pharmaceutical | 68.55 | 71 | 0.28% | 1.78% |
| STAA | STAAR Surgical | | Instruments | 46.39 | 71 | -0.81% | 48.64% |
| KIDS | OrthoPediatrics | | Equipment | 30.35 | 69 | 3.02% | -6.64% |
| EBS | Emergent Bio | | Biotechnology | 2.04 | 68 | 9.68% | -15.00% |
| AGEN | Agenus | | Biotechnology | 5.31 | 68 | 6.84% | 541.38% |
| TRVI | Trevi | | Biotechnology | 2.82 | 68 | 5.22% | 110.45% |
| JYNT | Joint | | Hospitals | 12.18 | 68 | 2.18% | 26.74% |
| CGC | Canopy Growth | | Pharmaceutical | 7.94 | 68 | 1.40% | 55.38% |
| ADMA | ADMA Biologics | | Biotechnology | 6.27 | 68 | 1.13% | 38.72% |
| CI | Cigna | | Insurance | 352.39 | 68 | 1.04% | 17.68% |
| ITCI | Intra-Cellular Therapies | | Biotechnology | 72.37 | 68 | 0.51% | 1.05% |
| AQST | Aquestive | | Biotechnology | 4.11 | 68 | -8.77% | 103.47% |
| BCYC | Bicycle | | Biotechnology | 23.41 | 68 | -4.49% | 29.48% |
| PROK | ProKidney | | Biotechnology | 2.04 | 68 | -11.69% | 16.91% |
| AVDL | Avadel | | Biotechnology | 17.33 | 68 | -0.29% | 22.73% |
| OM | Outset | | Medical Devices | 2.29 | 67 | 2.01% | -57.76% |
| CNC | Centene | | Insurance | 75.15 | 67 | 1.90% | 1.27% |
| PDEX | Pro-Dex | | Instruments | 19.00 | 67 | 0.01% | 8.45% |
| GKOS | Glaukos | | Instruments | 96.50 | 66 | 1.44% | 21.40% |
| For chart view version of above stock list: Chart View ➞ 0 - 25 , 25 - 50 , 50 - 75 , 75 - 100 , 100 - 125 , 125 - 150 , 150 - 175 , 175 - 200 , 200 - 225 , 225 - 250 , 250 - 275 , 275 - 300 , 300 - 325 , 325 - 350 , 350 - 375 , 375 - 400 , 400 - 425 , 425 - 450 , 450 - 475 , 475 - 500 , 500 - 525 , 525 - 550 , 550 - 575 , 575 - 600 , 600 - 625 , 625 - 650 , 650 - 675 , 675 - 700 , 700 - 725 | ||
 | Click To Change The Sort Order: By Market Cap or Company Size Performance: Year-to-date, Week and Day |  |
|
Get the most comprehensive stock market coverage daily at 12Stocks.com ➞ Best Stocks Today ➞ Best Stocks Weekly ➞ Best Stocks Year-to-Date ➞ Best Stocks Trends ➞  Best Stocks Today 12Stocks.com Best Nasdaq Stocks ➞ Best S&P 500 Stocks ➞ Best Tech Stocks ➞ Best Biotech Stocks ➞ |
| Detailed Overview of Healthcare Stocks |
| Healthcare Technical Overview, Leaders & Laggards, Top Healthcare ETF Funds & Detailed Healthcare Stocks List, Charts, Trends & More |
| Healthcare Sector: Technical Analysis, Trends & YTD Performance | |
| Healthcare sector is composed of stocks
from pharmaceutical, biotech, diagnostics labs, insurance providers
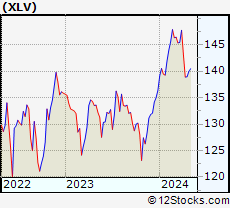
and healthcare services. Healthcare sector, as represented by XLV, an exchange-traded fund [ETF] that holds basket of Healthcare stocks (e.g, Merck, Amgen) is up by 1.88% and is currently underperforming the overall market by -1.5% year-to-date. Below is a quick view of Technical charts and trends: |
|
 XLV Weekly Chart |
|
| Long Term Trend: Not Good | |
| Medium Term Trend: Not Good | |
 XLV Daily Chart |
|
| Short Term Trend: Very Good | |
| Overall Trend Score: 25 | |
| YTD Performance: 1.88% | |
| **Trend Scores & Views Are Only For Educational Purposes And Not For Investing | |
| 12Stocks.com: Top Performing Healthcare Sector Stocks | ||||||||||||||||||||||||||||||||||||||||||||||||
 The top performing Healthcare sector stocks year to date are
Now, more recently, over last week, the top performing Healthcare sector stocks on the move are


|
||||||||||||||||||||||||||||||||||||||||||||||||
| 12Stocks.com: Investing in Healthcare Sector using Exchange Traded Funds | |
|
The following table shows list of key exchange traded funds (ETF) that
help investors track Healthcare Index. For detailed view, check out our ETF Funds section of our website. Quick View: Move mouse or cursor over ETF symbol (ticker) to view short-term Technical chart and over ETF name to view long term chart. Click on ticker or stock name for detailed view. Click on to add stock symbol to your watchlist and to view watchlist. |
12Stocks.com List of ETFs that track Healthcare Index
| Ticker | ETF Name | Watchlist | Recent Price | Smart Investing & Trading Score | Change % | Week % | Year-to-date % |
| XLV | Health Care | | 138.95 | 25 | 0.38 | 0.03 | 1.88% |
| XBI | Biotech | | 82.83 | 10 | -0.78 | -6.04 | -7.23% |
| IBB | Biotechnology | | 124.72 | 10 | 0.06 | -3.75 | -8.19% |
| BBH | Biotech | | 152.36 | 10 | 0.01 | -3.32 | -7.83% |
| VHT | Health Care | | 253.33 | 18 | 0.20 | -0.57 | 1.05% |
| IYH | Healthcare | | 58.16 | 18 | 0.19 | -0.41 | 1.59% |
| IHF | Healthcare Providers | | 52.21 | 62 | 1.29 | 3.3 | -0.57% |
| IHI | Medical Devices | | 54.36 | 10 | -0.31 | -3.1 | 0.72% |
| BIB | Biotechnology | | 48.20 | 10 | 0.54 | -6.21 | -15.51% |
| BIS | Short Biotech | | 20.90 | 95 | 0.14 | 6.61 | 15.63% |
| XHE | Health Care Equipment | | 81.27 | 10 | -0.20 | -3.13 | -3.55% |
| CURE | Healthcare Bull 3X | | 103.33 | 25 | 1.09 | -0.06 | 1.56% |
| LABU | Biotech Bull 3X | | 86.05 | 10 | -2.26 | -17.54 | -29.45% |
| LABD | Biotech Bear 3X | | 10.80 | 100 | 2.66 | 20.27 | 11.46% |
| PSCH | SmallCap Health Care | | 40.18 | 20 | 0.25 | -3.02 | -6.12% |
| XHS | Health Care Services | | 87.08 | 38 | 1.04 | -1.05 | -2.1% |
| PTH | DWA Healthcare Momentum | | 39.53 | 23 | -0.10 | -5.5 | 1% |
| BTEC | Principal Healthcare Innovators | | 33.86 | 0 | -0.67 | -5.92 | -6.8% |
| RXL | Health Care | | 93.22 | 25 | 0.85 | -0.03 | 1.99% |
| RXD | Short Health Care | | 11.64 | 76 | -0.29 | 0.34 | -2.39% |
| 12Stocks.com: Charts, Trends, Fundamental Data and Performances of Healthcare Stocks | |
|
We now take in-depth look at all Healthcare stocks including charts, multi-period performances and overall trends (as measured by Smart Investing & Trading Score). One can sort Healthcare stocks (click link to choose) by Daily, Weekly and by Year-to-Date performances. Also, one can sort by size of the company or by market capitalization. |
| Select Your Default Chart Type: | |||||
| |||||
| Click on stock symbol or name for detailed view. Click on to add stock symbol to your watchlist and to view watchlist. Quick View: Move mouse or cursor over "Daily" to quickly view daily Technical stock chart and over "Weekly" to view weekly Technical stock chart. | |||||

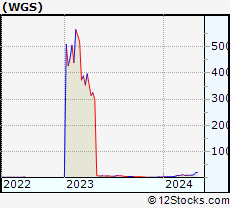 | WGS GeneDx Holdings Corp. |
| Sector: Health Care | |
| SubSector: Health Information Services | |
| MarketCap: 148 Millions | |
| Recent Price: 9.64 Smart Investing & Trading Score: 76 | |
| Day Percent Change: 0.78% Day Change: 0.08 | |
| Week Change: 0.21% Year-to-date Change: 254.4% | |
| WGS Links: Profile News Message Board | |
| Charts:- Daily , Weekly | |
| Add WGS to Watchlist: View: Get Complete WGS Trend Analysis ➞ | |
 | VRCA Verrica Pharmaceuticals Inc. |
| Sector: Health Care | |
| SubSector: Biotechnology | |
| MarketCap: 289.585 Millions | |
| Recent Price: 6.96 Smart Investing & Trading Score: 76 | |
| Day Percent Change: 0.72% Day Change: 0.05 | |
| Week Change: 1.31% Year-to-date Change: -4.9% | |
| VRCA Links: Profile News Message Board | |
| Charts:- Daily , Weekly | |
| Add VRCA to Watchlist: View: Get Complete VRCA Trend Analysis ➞ | |
 | PBH Prestige Consumer Healthcare Inc. |
| Sector: Health Care | |
| SubSector: Medical Appliances & Equipment | |
| MarketCap: 1639.6 Millions | |
| Recent Price: 69.67 Smart Investing & Trading Score: 75 | |
| Day Percent Change: 1.93% Day Change: 1.32 | |
| Week Change: 2.11% Year-to-date Change: 13.8% | |
| PBH Links: Profile News Message Board | |
| Charts:- Daily , Weekly | |
| Add PBH to Watchlist: View: Get Complete PBH Trend Analysis ➞ | |
 | UNH UnitedHealth Group Incorporated |
| Sector: Health Care | |
| SubSector: Health Care Plans | |
| MarketCap: 217384 Millions | |
| Recent Price: 501.13 Smart Investing & Trading Score: 74 | |
| Day Percent Change: 1.61% Day Change: 7.95 | |
| Week Change: 14.1% Year-to-date Change: -4.8% | |
| UNH Links: Profile News Message Board | |
| Charts:- Daily , Weekly | |
| Add UNH to Watchlist: View: Get Complete UNH Trend Analysis ➞ | |
 | NCNA NuCana plc |
| Sector: Health Care | |
| SubSector: Biotechnology | |
| MarketCap: 185.785 Millions | |
| Recent Price: 3.81 Smart Investing & Trading Score: 73 | |
| Day Percent Change: -5.93% Day Change: -0.24 | |
| Week Change: 1601.65% Year-to-date Change: 1,188.0% | |
| NCNA Links: Profile News Message Board | |
| Charts:- Daily , Weekly | |
| Add NCNA to Watchlist: View: Get Complete NCNA Trend Analysis ➞ | |
 | ZCMD Zhongchao Inc. |
| Sector: Health Care | |
| SubSector: Health Information Services | |
| MarketCap: 41487 Millions | |
| Recent Price: 1.87 Smart Investing & Trading Score: 73 | |
| Day Percent Change: -44.67% Day Change: -1.51 | |
| Week Change: 14.02% Year-to-date Change: 412.2% | |
| ZCMD Links: Profile News Message Board | |
| Charts:- Daily , Weekly | |
| Add ZCMD to Watchlist: View: Get Complete ZCMD Trend Analysis ➞ | |
 | AZN AstraZeneca PLC |
| Sector: Health Care | |
| SubSector: Drug Manufacturers - Major | |
| MarketCap: 113154 Millions | |
| Recent Price: 68.55 Smart Investing & Trading Score: 71 | |
| Day Percent Change: 0.28% Day Change: 0.19 | |
| Week Change: -0.55% Year-to-date Change: 1.8% | |
| AZN Links: Profile News Message Board | |
| Charts:- Daily , Weekly | |
| Add AZN to Watchlist: View: Get Complete AZN Trend Analysis ➞ | |
 | STAA STAAR Surgical Company |
| Sector: Health Care | |
| SubSector: Medical Instruments & Supplies | |
| MarketCap: 1334.6 Millions | |
| Recent Price: 46.39 Smart Investing & Trading Score: 71 | |
| Day Percent Change: -0.81% Day Change: -0.38 | |
| Week Change: -6.83% Year-to-date Change: 48.6% | |
| STAA Links: Profile News Message Board | |
| Charts:- Daily , Weekly | |
| Add STAA to Watchlist: View: Get Complete STAA Trend Analysis ➞ | |
 | KIDS OrthoPediatrics Corp. |
| Sector: Health Care | |
| SubSector: Medical Appliances & Equipment | |
| MarketCap: 742.28 Millions | |
| Recent Price: 30.35 Smart Investing & Trading Score: 69 | |
| Day Percent Change: 3.02% Day Change: 0.89 | |
| Week Change: -2.38% Year-to-date Change: -6.6% | |
| KIDS Links: Profile News Message Board | |
| Charts:- Daily , Weekly | |
| Add KIDS to Watchlist: View: Get Complete KIDS Trend Analysis ➞ | |
 | EBS Emergent BioSolutions Inc. |
| Sector: Health Care | |
| SubSector: Biotechnology | |
| MarketCap: 2417.65 Millions | |
| Recent Price: 2.04 Smart Investing & Trading Score: 68 | |
| Day Percent Change: 9.68% Day Change: 0.18 | |
| Week Change: -0.97% Year-to-date Change: -15.0% | |
| EBS Links: Profile News Message Board | |
| Charts:- Daily , Weekly | |
| Add EBS to Watchlist: View: Get Complete EBS Trend Analysis ➞ | |
 | AGEN Agenus Inc. |
| Sector: Health Care | |
| SubSector: Biotechnology | |
| MarketCap: 274.885 Millions | |
| Recent Price: 5.31 Smart Investing & Trading Score: 68 | |
| Day Percent Change: 6.84% Day Change: 0.34 | |
| Week Change: -34.85% Year-to-date Change: 541.4% | |
| AGEN Links: Profile News Message Board | |
| Charts:- Daily , Weekly | |
| Add AGEN to Watchlist: View: Get Complete AGEN Trend Analysis ➞ | |
 | TRVI Trevi Therapeutics, Inc. |
| Sector: Health Care | |
| SubSector: Biotechnology | |
| MarketCap: 50.6785 Millions | |
| Recent Price: 2.82 Smart Investing & Trading Score: 68 | |
| Day Percent Change: 5.22% Day Change: 0.14 | |
| Week Change: -3.42% Year-to-date Change: 110.5% | |
| TRVI Links: Profile News Message Board | |
| Charts:- Daily , Weekly | |
| Add TRVI to Watchlist: View: Get Complete TRVI Trend Analysis ➞ | |
 | JYNT The Joint Corp. |
| Sector: Health Care | |
| SubSector: Hospitals | |
| MarketCap: 125.146 Millions | |
| Recent Price: 12.18 Smart Investing & Trading Score: 68 | |
| Day Percent Change: 2.18% Day Change: 0.26 | |
| Week Change: 0.25% Year-to-date Change: 26.7% | |
| JYNT Links: Profile News Message Board | |
| Charts:- Daily , Weekly | |
| Add JYNT to Watchlist: View: Get Complete JYNT Trend Analysis ➞ | |
 | CGC Canopy Growth Corporation |
| Sector: Health Care | |
| SubSector: Drug Manufacturers - Other | |
| MarketCap: 4136.33 Millions | |
| Recent Price: 7.94 Smart Investing & Trading Score: 68 | |
| Day Percent Change: 1.40% Day Change: 0.11 | |
| Week Change: 1.79% Year-to-date Change: 55.4% | |
| CGC Links: Profile News Message Board | |
| Charts:- Daily , Weekly | |
| Add CGC to Watchlist: View: Get Complete CGC Trend Analysis ➞ | |
 | ADMA ADMA Biologics, Inc. |
| Sector: Health Care | |
| SubSector: Biotechnology | |
| MarketCap: 204.985 Millions | |
| Recent Price: 6.27 Smart Investing & Trading Score: 68 | |
| Day Percent Change: 1.13% Day Change: 0.07 | |
| Week Change: 4.15% Year-to-date Change: 38.7% | |
| ADMA Links: Profile News Message Board | |
| Charts:- Daily , Weekly | |
| Add ADMA to Watchlist: View: Get Complete ADMA Trend Analysis ➞ | |
 | CI Cigna Corporation |
| Sector: Health Care | |
| SubSector: Health Care Plans | |
| MarketCap: 60251.8 Millions | |
| Recent Price: 352.39 Smart Investing & Trading Score: 68 | |
| Day Percent Change: 1.04% Day Change: 3.61 | |
| Week Change: 0.73% Year-to-date Change: 17.7% | |
| CI Links: Profile News Message Board | |
| Charts:- Daily , Weekly | |
| Add CI to Watchlist: View: Get Complete CI Trend Analysis ➞ | |
 | ITCI Intra-Cellular Therapies, Inc. |
| Sector: Health Care | |
| SubSector: Biotechnology | |
| MarketCap: 991.885 Millions | |
| Recent Price: 72.37 Smart Investing & Trading Score: 68 | |
| Day Percent Change: 0.51% Day Change: 0.37 | |
| Week Change: 9.85% Year-to-date Change: 1.1% | |
| ITCI Links: Profile News Message Board | |
| Charts:- Daily , Weekly | |
| Add ITCI to Watchlist: View: Get Complete ITCI Trend Analysis ➞ | |
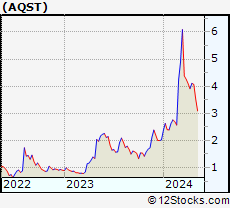 | AQST Aquestive Therapeutics, Inc. |
| Sector: Health Care | |
| SubSector: Biotechnology | |
| MarketCap: 94.2785 Millions | |
| Recent Price: 4.11 Smart Investing & Trading Score: 68 | |
| Day Percent Change: -8.77% Day Change: -0.39 | |
| Week Change: 5.12% Year-to-date Change: 103.5% | |
| AQST Links: Profile News Message Board | |
| Charts:- Daily , Weekly | |
| Add AQST to Watchlist: View: Get Complete AQST Trend Analysis ➞ | |
 | BCYC Bicycle Therapeutics plc |
| Sector: Health Care | |
| SubSector: Biotechnology | |
| MarketCap: 214.485 Millions | |
| Recent Price: 23.41 Smart Investing & Trading Score: 68 | |
| Day Percent Change: -4.49% Day Change: -1.10 | |
| Week Change: 4.98% Year-to-date Change: 29.5% | |
| BCYC Links: Profile News Message Board | |
| Charts:- Daily , Weekly | |
| Add BCYC to Watchlist: View: Get Complete BCYC Trend Analysis ➞ | |
 | PROK ProKidney Corp. |
| Sector: Health Care | |
| SubSector: Biotechnology | |
| MarketCap: 2470 Millions | |
| Recent Price: 2.04 Smart Investing & Trading Score: 68 | |
| Day Percent Change: -11.69% Day Change: -0.27 | |
| Week Change: 16.57% Year-to-date Change: 16.9% | |
| PROK Links: Profile News Message Board | |
| Charts:- Daily , Weekly | |
| Add PROK to Watchlist: View: Get Complete PROK Trend Analysis ➞ | |
 | AVDL Avadel Pharmaceuticals plc |
| Sector: Health Care | |
| SubSector: Biotechnology | |
| MarketCap: 354.485 Millions | |
| Recent Price: 17.33 Smart Investing & Trading Score: 68 | |
| Day Percent Change: -0.29% Day Change: -0.05 | |
| Week Change: 8.38% Year-to-date Change: 22.7% | |
| AVDL Links: Profile News Message Board | |
| Charts:- Daily , Weekly | |
| Add AVDL to Watchlist: View: Get Complete AVDL Trend Analysis ➞ | |
 | OM Outset Medical, Inc. |
| Sector: Health Care | |
| SubSector: Medical Devices | |
| MarketCap: 21787 Millions | |
| Recent Price: 2.29 Smart Investing & Trading Score: 67 | |
| Day Percent Change: 2.01% Day Change: 0.04 | |
| Week Change: 11.46% Year-to-date Change: -57.8% | |
| OM Links: Profile News Message Board | |
| Charts:- Daily , Weekly | |
| Add OM to Watchlist: View: Get Complete OM Trend Analysis ➞ | |
 | CNC Centene Corporation |
| Sector: Health Care | |
| SubSector: Health Care Plans | |
| MarketCap: 29075 Millions | |
| Recent Price: 75.15 Smart Investing & Trading Score: 67 | |
| Day Percent Change: 1.90% Day Change: 1.40 | |
| Week Change: 6.25% Year-to-date Change: 1.3% | |
| CNC Links: Profile News Message Board | |
| Charts:- Daily , Weekly | |
| Add CNC to Watchlist: View: Get Complete CNC Trend Analysis ➞ | |
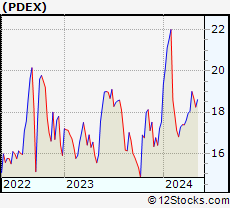 | PDEX Pro-Dex, Inc. |
| Sector: Health Care | |
| SubSector: Medical Instruments & Supplies | |
| MarketCap: 57.486 Millions | |
| Recent Price: 19.00 Smart Investing & Trading Score: 67 | |
| Day Percent Change: 0.01% Day Change: 0.00 | |
| Week Change: 5.33% Year-to-date Change: 8.5% | |
| PDEX Links: Profile News Message Board | |
| Charts:- Daily , Weekly | |
| Add PDEX to Watchlist: View: Get Complete PDEX Trend Analysis ➞ | |
 | GKOS Glaukos Corporation |
| Sector: Health Care | |
| SubSector: Medical Instruments & Supplies | |
| MarketCap: 1103.6 Millions | |
| Recent Price: 96.50 Smart Investing & Trading Score: 66 | |
| Day Percent Change: 1.44% Day Change: 1.37 | |
| Week Change: -1.76% Year-to-date Change: 21.4% | |
| GKOS Links: Profile News Message Board | |
| Charts:- Daily , Weekly | |
| Add GKOS to Watchlist: View: Get Complete GKOS Trend Analysis ➞ | |
| For tabular summary view of above stock list: Summary View ➞ 0 - 25 , 25 - 50 , 50 - 75 , 75 - 100 , 100 - 125 , 125 - 150 , 150 - 175 , 175 - 200 , 200 - 225 , 225 - 250 , 250 - 275 , 275 - 300 , 300 - 325 , 325 - 350 , 350 - 375 , 375 - 400 , 400 - 425 , 425 - 450 , 450 - 475 , 475 - 500 , 500 - 525 , 525 - 550 , 550 - 575 , 575 - 600 , 600 - 625 , 625 - 650 , 650 - 675 , 675 - 700 , 700 - 725 | ||
| Click To Change The Sort Order: By Market Cap or Company Size Performance: Year-to-date, Week and Day | |
| Select Chart Type: | ||
|
Best Stocks Today 12Stocks.com |
© 2024 12Stocks.com Terms & Conditions Privacy Contact Us
All Information Provided Only For Education And Not To Be Used For Investing or Trading. See Terms & Conditions


One More Thing ... Get Best Stocks Delivered Daily!
Never Ever Miss A Move With Our Top Ten Stocks Lists
Find Best Stocks In Any Market - Bull or Bear Market
Take A Peek At Our Top Ten Stocks Lists: Daily, Weekly, Year-to-Date & Top Trends
Find Best Stocks In Any Market - Bull or Bear Market
Take A Peek At Our Top Ten Stocks Lists: Daily, Weekly, Year-to-Date & Top Trends
Healthcare Stocks With Best Up Trends [0-bearish to 100-bullish]: Vanda [100], Rani [95], Humacyte [95], Phibro Animal[95], ALX Oncology[95], Fresenius [95], Oscar Health[95], Lantheus [93], United [93], Mesoblast [88], OPKO Health[88]
Best Healthcare Stocks Year-to-Date:
Precision BioSciences[2571.23%], Inovio [1798.04%], Assembly Biosciences[1535.17%], Adverum Biotechnologies[1406.38%], Aurora Cannabis[1256.57%], NuCana [1188.03%], Affimed N.V[724%], Corbus [549.67%], Agenus [541.38%], CareMax [429.9%], Zhongchao [412.19%] Best Healthcare Stocks This Week:
NuCana [1601.65%], Regencell Bioscience[45.67%], Rani [30.93%], Humacyte [28.47%], Venus Concept[25.44%], Vanda [24.03%], ALX Oncology[22.49%], ProKidney [16.57%], Nyxoah S.A[16.22%], Galera [15.36%], UnitedHealth [14.1%] Best Healthcare Stocks Daily:
Rani [15.71%], Genelux [14.25%], Humacyte [14.02%], Accelerate Diagnostics[11.56%], Emergent Bio[9.68%], Venus Concept[8.75%], Adaptimmune [8.72%], BioXcel [8.63%], Corbus [7.42%], RedHill Biopharma[7.41%], DermTech [7.05%]