
 Login Sign Up


| |||||
 |  | ||||

| 12Stocks.com Market Intelligence |
Best Healthcare Stocks
 | "Discover best trending healthcare stocks with 12Stocks.com." |
| - Subu Vdaygiri, Founder, 12Stocks.com |
| In a hurry? Healthcare Stocks Lists: Performance Trends Table, Stock Charts
Sort Healthcare stocks: Daily, Weekly, Year-to-Date, Market Cap & Trends. Filter Healthcare stocks list by size:All Healthcare Large Mid-Range Small |
| 12Stocks.com Healthcare Stocks Performances & Trends Daily | |||||||||
|
|  The overall Smart Investing & Trading Score is 57 (0-bearish to 100-bullish) which puts Healthcare sector in short term neutral trend. The Smart Investing & Trading Score from previous trading session is 60 and a deterioration of trend continues.
| ||||||||
Here are the Smart Investing & Trading Scores of the most requested Healthcare stocks at 12Stocks.com (click stock name for detailed review):
|


| 12Stocks.com: Investing in Healthcare sector with Stocks | |
|
The following table helps investors and traders sort through current performance and trends (as measured by Smart Investing & Trading Score) of various
stocks in the Healthcare sector. Quick View: Move mouse or cursor over stock symbol (ticker) to view short-term Technical chart and over stock name to view long term chart. Click on  to add stock symbol to your watchlist and to add stock symbol to your watchlist and  to view watchlist. Click on any ticker or stock name for detailed market intelligence report for that stock. to view watchlist. Click on any ticker or stock name for detailed market intelligence report for that stock. |
12Stocks.com Performance of Stocks in Healthcare Sector
| Ticker | Stock Name | Watchlist | Category | Recent Price | Smart Investing & Trading Score | Change % | YTD Change% |
| UTMD | Utah |   | Instruments | 67.29 | 52 | -0.85% | -20.10% |
| GLTO | Galecto | | Biotechnology | 0.72 | 52 | 5.43% | -0.42% |
| INMD | InMode | | Equipment | 17.36 | 52 | 0.70% | -21.94% |
| TWST | Twist Bioscience | | Laboratories | 32.01 | 52 | 0.16% | -13.16% |
| ILMN | Illumina | | Biotechnology | 123.99 | 52 | -0.55% | -10.95% |
| PRTC | PureTech Health | | Biotechnology | 27.05 | 51 | -3.01% | 13.13% |
| ATAI | Atai Life | | Biotechnology | 2.13 | 50 | 3.90% | 51.06% |
| ACRV | Acrivon | | Biotechnology | 8.47 | 50 | 2.60% | 70.52% |
| CNC | Centene | | Insurance | 74.33 | 50 | 2.88% | 0.16% |
| OSUR | OraSure Technologies | | Instruments | 5.48 | 50 | 2.81% | -33.17% |
| MORF | Morphic Holding | | Biotechnology | 28.71 | 50 | 2.65% | -0.59% |
| GRTX | Galera | | Biotechnology | 0.19 | 50 | 2.00% | 33.15% |
| ATEC | Alphatec | | Instruments | 13.21 | 50 | 1.85% | -12.57% |
| XENE | Xenon | | Biotechnology | 43.00 | 50 | 1.20% | -6.64% |
| TAK | Takeda | | Pharmaceutical | 13.27 | 50 | 0.61% | -7.01% |
| TRDA | Entrada | | Biotechnology | 12.94 | 50 | -2.19% | -21.15% |
| ABOS | Acumen | | Biotechnology | 3.47 | 49 | 6.77% | -9.64% |
| ANTX | AN2 | | Biotechnology | 2.55 | 49 | 6.03% | -87.55% |
| AMLX | Amylyx | | Biotechnology | 2.03 | 49 | 5.45% | -85.96% |
| NEO | NeoGenomics | | Laboratories | 14.72 | 49 | 5.44% | -9.02% |
| FULC | Fulcrum | | Biotechnology | 7.65 | 49 | 4.37% | 13.33% |
| FHTX | Foghorn | | Biotechnology | 6.11 | 49 | 4.27% | -4.75% |
| ARWR | Arrowhead | | Biotechnology | 24.13 | 49 | 4.14% | -21.14% |
| PACB | Pacific Biosciences | | Biotechnology | 1.76 | 49 | 4.14% | -82.06% |
| DNLI | Denali | | Biotechnology | 16.81 | 49 | 4.02% | -21.67% |
| For chart view version of above stock list: Chart View ➞ 0 - 25 , 25 - 50 , 50 - 75 , 75 - 100 , 100 - 125 , 125 - 150 , 150 - 175 , 175 - 200 , 200 - 225 , 225 - 250 , 250 - 275 , 275 - 300 , 300 - 325 , 325 - 350 , 350 - 375 , 375 - 400 , 400 - 425 , 425 - 450 , 450 - 475 , 475 - 500 , 500 - 525 , 525 - 550 , 550 - 575 , 575 - 600 , 600 - 625 , 625 - 650 , 650 - 675 , 675 - 700 , 700 - 725 | ||
 | Click To Change The Sort Order: By Market Cap or Company Size Performance: Year-to-date, Week and Day |  |
|
Get the most comprehensive stock market coverage daily at 12Stocks.com ➞ Best Stocks Today ➞ Best Stocks Weekly ➞ Best Stocks Year-to-Date ➞ Best Stocks Trends ➞  Best Stocks Today 12Stocks.com Best Nasdaq Stocks ➞ Best S&P 500 Stocks ➞ Best Tech Stocks ➞ Best Biotech Stocks ➞ |
| Detailed Overview of Healthcare Stocks |
| Healthcare Technical Overview, Leaders & Laggards, Top Healthcare ETF Funds & Detailed Healthcare Stocks List, Charts, Trends & More |
| Healthcare Sector: Technical Analysis, Trends & YTD Performance | |
| Healthcare sector is composed of stocks
from pharmaceutical, biotech, diagnostics labs, insurance providers
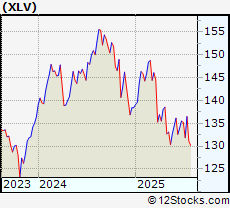
and healthcare services. Healthcare sector, as represented by XLV, an exchange-traded fund [ETF] that holds basket of Healthcare stocks (e.g, Merck, Amgen) is up by 3.01% and is currently underperforming the overall market by -2.61% year-to-date. Below is a quick view of Technical charts and trends: |
|
 XLV Weekly Chart |
|
| Long Term Trend: Not Good | |
| Medium Term Trend: Good | |
 XLV Daily Chart |
|
| Short Term Trend: Very Good | |
| Overall Trend Score: 57 | |
| YTD Performance: 3.01% | |
| **Trend Scores & Views Are Only For Educational Purposes And Not For Investing | |
| 12Stocks.com: Top Performing Healthcare Sector Stocks | ||||||||||||||||||||||||||||||||||||||||||||||||
 The top performing Healthcare sector stocks year to date are
Now, more recently, over last week, the top performing Healthcare sector stocks on the move are


|
||||||||||||||||||||||||||||||||||||||||||||||||
| 12Stocks.com: Investing in Healthcare Sector using Exchange Traded Funds | |
|
The following table shows list of key exchange traded funds (ETF) that
help investors track Healthcare Index. For detailed view, check out our ETF Funds section of our website. Quick View: Move mouse or cursor over ETF symbol (ticker) to view short-term Technical chart and over ETF name to view long term chart. Click on ticker or stock name for detailed view. Click on to add stock symbol to your watchlist and to view watchlist. |
12Stocks.com List of ETFs that track Healthcare Index
| Ticker | ETF Name | Watchlist | Recent Price | Smart Investing & Trading Score | Change % | Week % | Year-to-date % |
| XLV | Health Care | | 140.48 | 57 | -0.07 | 0.37 | 3.01% |
| XBI | Biotech | | 88.34 | 50 | 1.16 | 5.81 | -1.06% |
| IBB | Biotechnology | | 130.65 | 64 | 0.90 | 3.29 | -3.83% |
| BBH | Biotech | | 160.51 | 64 | 1.18 | 3.12 | -2.9% |
| VHT | Health Care | | 257.14 | 50 | -0.05 | 0.71 | 2.57% |
| IYH | Healthcare | | 59.12 | 50 | -0.10 | 0.87 | 3.27% |
| IHF | Healthcare Providers | | 51.65 | 15 | 0.41 | -0.52 | -1.64% |
| IHI | Medical Devices | | 55.16 | 10 | 0.25 | -0.67 | 2.2% |
| BIB | Biotechnology | | 53.80 | 69 | 2.32 | 8.34 | -5.7% |
| BIS | Short Biotech | | 18.66 | 36 | -2.36 | -7.72 | 3.26% |
| XHE | Health Care Equipment | | 84.89 | 80 | 1.16 | 2.98 | 0.75% |
| CURE | Healthcare Bull 3X | | 105.81 | 35 | -0.70 | 0.48 | 4% |
| LABU | Biotech Bull 3X | | 102.99 | 42 | 3.19 | 17.69 | -15.56% |
| LABD | Biotech Bear 3X | | 8.76 | 36 | -2.99 | -16.73 | -9.6% |
| PSCH | SmallCap Health Care | | 42.05 | 62 | 1.33 | 3.32 | -1.75% |
| XHS | Health Care Services | | 88.14 | 20 | -0.19 | 0.31 | -0.91% |
| PTH | DWA Healthcare Momentum | | 41.74 | 50 | 1.14 | 4.64 | 6.64% |
| BTEC | Principal Healthcare Innovators | | 35.98 | 55 | 0.25 | 5.07 | -0.95% |
| RXL | Health Care | | 95.21 | 54 | -0.12 | 0.41 | 4.16% |
| RXD | Short Health Care | | 11.34 | 49 | -0.18 | -0.96 | -4.91% |
| 12Stocks.com: Charts, Trends, Fundamental Data and Performances of Healthcare Stocks | |
|
We now take in-depth look at all Healthcare stocks including charts, multi-period performances and overall trends (as measured by Smart Investing & Trading Score). One can sort Healthcare stocks (click link to choose) by Daily, Weekly and by Year-to-Date performances. Also, one can sort by size of the company or by market capitalization. |
| Select Your Default Chart Type: | |||||
| |||||
| Click on stock symbol or name for detailed view. Click on to add stock symbol to your watchlist and to view watchlist. Quick View: Move mouse or cursor over "Daily" to quickly view daily Technical stock chart and over "Weekly" to view weekly Technical stock chart. | |||||

 | UTMD Utah Medical Products, Inc. |
| Sector: Health Care | |
| SubSector: Medical Instruments & Supplies | |
| MarketCap: 285.86 Millions | |
| Recent Price: 67.29 Smart Investing & Trading Score: 52 | |
| Day Percent Change: -0.85% Day Change: -0.58 | |
| Week Change: 2.08% Year-to-date Change: -20.1% | |
| UTMD Links: Profile News Message Board | |
| Charts:- Daily , Weekly | |
| Add UTMD to Watchlist: View: Get Complete UTMD Trend Analysis ➞ | |
 | GLTO Galecto, Inc. |
| Sector: Health Care | |
| SubSector: Biotechnology | |
| MarketCap: 34487 Millions | |
| Recent Price: 0.72 Smart Investing & Trading Score: 52 | |
| Day Percent Change: 5.43% Day Change: 0.04 | |
| Week Change: 1.73% Year-to-date Change: -0.4% | |
| GLTO Links: Profile News Message Board | |
| Charts:- Daily , Weekly | |
| Add GLTO to Watchlist: View: Get Complete GLTO Trend Analysis ➞ | |
 | INMD InMode Ltd. |
| Sector: Health Care | |
| SubSector: Medical Appliances & Equipment | |
| MarketCap: 689.08 Millions | |
| Recent Price: 17.36 Smart Investing & Trading Score: 52 | |
| Day Percent Change: 0.70% Day Change: 0.12 | |
| Week Change: 1.28% Year-to-date Change: -21.9% | |
| INMD Links: Profile News Message Board | |
| Charts:- Daily , Weekly | |
| Add INMD to Watchlist: View: Get Complete INMD Trend Analysis ➞ | |
 | TWST Twist Bioscience Corporation |
| Sector: Health Care | |
| SubSector: Medical Laboratories & Research | |
| MarketCap: 1065 Millions | |
| Recent Price: 32.01 Smart Investing & Trading Score: 52 | |
| Day Percent Change: 0.16% Day Change: 0.05 | |
| Week Change: 1.49% Year-to-date Change: -13.2% | |
| TWST Links: Profile News Message Board | |
| Charts:- Daily , Weekly | |
| Add TWST to Watchlist: View: Get Complete TWST Trend Analysis ➞ | |
 | ILMN Illumina, Inc. |
| Sector: Health Care | |
| SubSector: Biotechnology | |
| MarketCap: 39194.3 Millions | |
| Recent Price: 123.99 Smart Investing & Trading Score: 52 | |
| Day Percent Change: -0.55% Day Change: -0.69 | |
| Week Change: 1.4% Year-to-date Change: -11.0% | |
| ILMN Links: Profile News Message Board | |
| Charts:- Daily , Weekly | |
| Add ILMN to Watchlist: View: Get Complete ILMN Trend Analysis ➞ | |
 | PRTC PureTech Health plc |
| Sector: Health Care | |
| SubSector: Biotechnology | |
| MarketCap: 819 Millions | |
| Recent Price: 27.05 Smart Investing & Trading Score: 51 | |
| Day Percent Change: -3.01% Day Change: -0.84 | |
| Week Change: -2.96% Year-to-date Change: 13.1% | |
| PRTC Links: Profile News Message Board | |
| Charts:- Daily , Weekly | |
| Add PRTC to Watchlist: View: Get Complete PRTC Trend Analysis ➞ | |
 | ATAI Atai Life Sciences N.V. |
| Sector: Health Care | |
| SubSector: Biotechnology | |
| MarketCap: 287 Millions | |
| Recent Price: 2.13 Smart Investing & Trading Score: 50 | |
| Day Percent Change: 3.90% Day Change: 0.08 | |
| Week Change: 10.36% Year-to-date Change: 51.1% | |
| ATAI Links: Profile News Message Board | |
| Charts:- Daily , Weekly | |
| Add ATAI to Watchlist: View: Get Complete ATAI Trend Analysis ➞ | |
 | ACRV Acrivon Therapeutics, Inc. |
| Sector: Health Care | |
| SubSector: Biotechnology | |
| MarketCap: 286 Millions | |
| Recent Price: 8.47 Smart Investing & Trading Score: 50 | |
| Day Percent Change: 2.60% Day Change: 0.21 | |
| Week Change: 0.18% Year-to-date Change: 70.5% | |
| ACRV Links: Profile News Message Board | |
| Charts:- Daily , Weekly | |
| Add ACRV to Watchlist: View: Get Complete ACRV Trend Analysis ➞ | |
 | CNC Centene Corporation |
| Sector: Health Care | |
| SubSector: Health Care Plans | |
| MarketCap: 29075 Millions | |
| Recent Price: 74.33 Smart Investing & Trading Score: 50 | |
| Day Percent Change: 2.88% Day Change: 2.08 | |
| Week Change: 0.45% Year-to-date Change: 0.2% | |
| CNC Links: Profile News Message Board | |
| Charts:- Daily , Weekly | |
| Add CNC to Watchlist: View: Get Complete CNC Trend Analysis ➞ | |
 | OSUR OraSure Technologies, Inc. |
| Sector: Health Care | |
| SubSector: Medical Instruments & Supplies | |
| MarketCap: 468.26 Millions | |
| Recent Price: 5.48 Smart Investing & Trading Score: 50 | |
| Day Percent Change: 2.81% Day Change: 0.15 | |
| Week Change: 3.01% Year-to-date Change: -33.2% | |
| OSUR Links: Profile News Message Board | |
| Charts:- Daily , Weekly | |
| Add OSUR to Watchlist: View: Get Complete OSUR Trend Analysis ➞ | |
 | MORF Morphic Holding, Inc. |
| Sector: Health Care | |
| SubSector: Biotechnology | |
| MarketCap: 484.885 Millions | |
| Recent Price: 28.71 Smart Investing & Trading Score: 50 | |
| Day Percent Change: 2.65% Day Change: 0.74 | |
| Week Change: 2.28% Year-to-date Change: -0.6% | |
| MORF Links: Profile News Message Board | |
| Charts:- Daily , Weekly | |
| Add MORF to Watchlist: View: Get Complete MORF Trend Analysis ➞ | |
 | GRTX Galera Therapeutics, Inc. |
| Sector: Health Care | |
| SubSector: Biotechnology | |
| MarketCap: 277.585 Millions | |
| Recent Price: 0.19 Smart Investing & Trading Score: 50 | |
| Day Percent Change: 2.00% Day Change: 0.00 | |
| Week Change: 4.03% Year-to-date Change: 33.2% | |
| GRTX Links: Profile News Message Board | |
| Charts:- Daily , Weekly | |
| Add GRTX to Watchlist: View: Get Complete GRTX Trend Analysis ➞ | |
 | ATEC Alphatec Holdings, Inc. |
| Sector: Health Care | |
| SubSector: Medical Instruments & Supplies | |
| MarketCap: 181.16 Millions | |
| Recent Price: 13.21 Smart Investing & Trading Score: 50 | |
| Day Percent Change: 1.85% Day Change: 0.24 | |
| Week Change: 6.19% Year-to-date Change: -12.6% | |
| ATEC Links: Profile News Message Board | |
| Charts:- Daily , Weekly | |
| Add ATEC to Watchlist: View: Get Complete ATEC Trend Analysis ➞ | |
 | XENE Xenon Pharmaceuticals Inc. |
| Sector: Health Care | |
| SubSector: Biotechnology | |
| MarketCap: 388.585 Millions | |
| Recent Price: 43.00 Smart Investing & Trading Score: 50 | |
| Day Percent Change: 1.20% Day Change: 0.51 | |
| Week Change: 6.17% Year-to-date Change: -6.6% | |
| XENE Links: Profile News Message Board | |
| Charts:- Daily , Weekly | |
| Add XENE to Watchlist: View: Get Complete XENE Trend Analysis ➞ | |
 | TAK Takeda Pharmaceutical Company Limited |
| Sector: Health Care | |
| SubSector: Drugs - Generic | |
| MarketCap: 41342.5 Millions | |
| Recent Price: 13.27 Smart Investing & Trading Score: 50 | |
| Day Percent Change: 0.61% Day Change: 0.08 | |
| Week Change: 1.84% Year-to-date Change: -7.0% | |
| TAK Links: Profile News Message Board | |
| Charts:- Daily , Weekly | |
| Add TAK to Watchlist: View: Get Complete TAK Trend Analysis ➞ | |
 | TRDA Entrada Therapeutics, Inc. |
| Sector: Health Care | |
| SubSector: Biotechnology | |
| MarketCap: 481 Millions | |
| Recent Price: 12.94 Smart Investing & Trading Score: 50 | |
| Day Percent Change: -2.19% Day Change: -0.29 | |
| Week Change: 3.94% Year-to-date Change: -21.2% | |
| TRDA Links: Profile News Message Board | |
| Charts:- Daily , Weekly | |
| Add TRDA to Watchlist: View: Get Complete TRDA Trend Analysis ➞ | |
 | ABOS Acumen Pharmaceuticals, Inc. |
| Sector: Health Care | |
| SubSector: Biotechnology | |
| MarketCap: 199 Millions | |
| Recent Price: 3.47 Smart Investing & Trading Score: 49 | |
| Day Percent Change: 6.77% Day Change: 0.22 | |
| Week Change: 9.46% Year-to-date Change: -9.6% | |
| ABOS Links: Profile News Message Board | |
| Charts:- Daily , Weekly | |
| Add ABOS to Watchlist: View: Get Complete ABOS Trend Analysis ➞ | |
 | ANTX AN2 Therapeutics, Inc. |
| Sector: Health Care | |
| SubSector: Biotechnology | |
| MarketCap: 163 Millions | |
| Recent Price: 2.55 Smart Investing & Trading Score: 49 | |
| Day Percent Change: 6.03% Day Change: 0.15 | |
| Week Change: 9.91% Year-to-date Change: -87.6% | |
| ANTX Links: Profile News Message Board | |
| Charts:- Daily , Weekly | |
| Add ANTX to Watchlist: View: Get Complete ANTX Trend Analysis ➞ | |
 | AMLX Amylyx Pharmaceuticals, Inc. |
| Sector: Health Care | |
| SubSector: Biotechnology | |
| MarketCap: 1500 Millions | |
| Recent Price: 2.03 Smart Investing & Trading Score: 49 | |
| Day Percent Change: 5.45% Day Change: 0.10 | |
| Week Change: 16% Year-to-date Change: -86.0% | |
| AMLX Links: Profile News Message Board | |
| Charts:- Daily , Weekly | |
| Add AMLX to Watchlist: View: Get Complete AMLX Trend Analysis ➞ | |
 | NEO NeoGenomics, Inc. |
| Sector: Health Care | |
| SubSector: Medical Laboratories & Research | |
| MarketCap: 2763.8 Millions | |
| Recent Price: 14.72 Smart Investing & Trading Score: 49 | |
| Day Percent Change: 5.44% Day Change: 0.76 | |
| Week Change: 4.1% Year-to-date Change: -9.0% | |
| NEO Links: Profile News Message Board | |
| Charts:- Daily , Weekly | |
| Add NEO to Watchlist: View: Get Complete NEO Trend Analysis ➞ | |
 | FULC Fulcrum Therapeutics, Inc. |
| Sector: Health Care | |
| SubSector: Biotechnology | |
| MarketCap: 274.785 Millions | |
| Recent Price: 7.65 Smart Investing & Trading Score: 49 | |
| Day Percent Change: 4.37% Day Change: 0.32 | |
| Week Change: 7.14% Year-to-date Change: 13.3% | |
| FULC Links: Profile News Message Board | |
| Charts:- Daily , Weekly | |
| Add FULC to Watchlist: View: Get Complete FULC Trend Analysis ➞ | |
 | FHTX Foghorn Therapeutics Inc. |
| Sector: Health Care | |
| SubSector: Biotechnology | |
| MarketCap: 74487 Millions | |
| Recent Price: 6.11 Smart Investing & Trading Score: 49 | |
| Day Percent Change: 4.27% Day Change: 0.25 | |
| Week Change: 11.29% Year-to-date Change: -4.8% | |
| FHTX Links: Profile News Message Board | |
| Charts:- Daily , Weekly | |
| Add FHTX to Watchlist: View: Get Complete FHTX Trend Analysis ➞ | |
 | ARWR Arrowhead Pharmaceuticals, Inc. |
| Sector: Health Care | |
| SubSector: Biotechnology | |
| MarketCap: 3226.15 Millions | |
| Recent Price: 24.13 Smart Investing & Trading Score: 49 | |
| Day Percent Change: 4.14% Day Change: 0.96 | |
| Week Change: 9.09% Year-to-date Change: -21.1% | |
| ARWR Links: Profile News Message Board | |
| Charts:- Daily , Weekly | |
| Add ARWR to Watchlist: View: Get Complete ARWR Trend Analysis ➞ | |
 | PACB Pacific Biosciences of California, Inc. |
| Sector: Health Care | |
| SubSector: Biotechnology | |
| MarketCap: 470.685 Millions | |
| Recent Price: 1.76 Smart Investing & Trading Score: 49 | |
| Day Percent Change: 4.14% Day Change: 0.07 | |
| Week Change: 19.73% Year-to-date Change: -82.1% | |
| PACB Links: Profile News Message Board | |
| Charts:- Daily , Weekly | |
| Add PACB to Watchlist: View: Get Complete PACB Trend Analysis ➞ | |
 | DNLI Denali Therapeutics Inc. |
| Sector: Health Care | |
| SubSector: Biotechnology | |
| MarketCap: 2020.05 Millions | |
| Recent Price: 16.81 Smart Investing & Trading Score: 49 | |
| Day Percent Change: 4.02% Day Change: 0.65 | |
| Week Change: 8.94% Year-to-date Change: -21.7% | |
| DNLI Links: Profile News Message Board | |
| Charts:- Daily , Weekly | |
| Add DNLI to Watchlist: View: Get Complete DNLI Trend Analysis ➞ | |
| For tabular summary view of above stock list: Summary View ➞ 0 - 25 , 25 - 50 , 50 - 75 , 75 - 100 , 100 - 125 , 125 - 150 , 150 - 175 , 175 - 200 , 200 - 225 , 225 - 250 , 250 - 275 , 275 - 300 , 300 - 325 , 325 - 350 , 350 - 375 , 375 - 400 , 400 - 425 , 425 - 450 , 450 - 475 , 475 - 500 , 500 - 525 , 525 - 550 , 550 - 575 , 575 - 600 , 600 - 625 , 625 - 650 , 650 - 675 , 675 - 700 , 700 - 725 | ||
| Click To Change The Sort Order: By Market Cap or Company Size Performance: Year-to-date, Week and Day | |
| Select Chart Type: | ||
|
Best Stocks Today 12Stocks.com |
© 2024 12Stocks.com Terms & Conditions Privacy Contact Us
All Information Provided Only For Education And Not To Be Used For Investing or Trading. See Terms & Conditions


One More Thing ... Get Best Stocks Delivered Daily!
Never Ever Miss A Move With Our Top Ten Stocks Lists
Find Best Stocks In Any Market - Bull or Bear Market
Take A Peek At Our Top Ten Stocks Lists: Daily, Weekly, Year-to-Date & Top Trends
Find Best Stocks In Any Market - Bull or Bear Market
Take A Peek At Our Top Ten Stocks Lists: Daily, Weekly, Year-to-Date & Top Trends
Healthcare Stocks With Best Up Trends [0-bearish to 100-bullish]: Emergent Bio[100], Lantheus [100], Blueprint Medicines[100], Moderna [100], Veru [100], Palatin Technologies[100], Avid Bioservices[100], Glaukos [100], Rockwell [100], TransMedics [100], Repro Med[100]
Best Healthcare Stocks Year-to-Date:
Pieris [6075.82%], Precision BioSciences[2869.86%], Avenue [2850.31%], Inovio [2254.9%], Assembly Biosciences[1462%], Agenus [1412.26%], Aurora Cannabis[1363.67%], NuCana [1240.43%], Adverum Biotechnologies[1228.37%], Affimed N.V[748%], CareMax [674.23%] Best Healthcare Stocks This Week:
CytomX [183.02%], GeneDx [75.99%], Deciphera [73.24%], Emergent Bio[71.88%], P3 Health[38.51%], Cue Biopharma[37.73%], TransMedics [35.14%], Seres [34.55%], Surmodics [32.02%], Phibro Animal[31.66%], Poseida [30.99%] Best Healthcare Stocks Daily:
Emergent Bio[70.98%], Regencell Bioscience[23.15%], Pulmonx [21.50%], Orchestra BioMed[18.83%], Cellectis S.A[17.90%], Ocular Therapeutix[16.93%], Lantheus [16.01%], Butterfly Network[13.09%], Blueprint Medicines[12.80%], Moderna [12.68%], Mustang Bio[12.65%]