
 Login Sign Up


| |||||
 |  | ||||

| 12Stocks.com Market Intelligence |
Best Healthcare Stocks
 | "Discover best trending healthcare stocks with 12Stocks.com." |
| - Subu Vdaygiri, Founder, 12Stocks.com |
| In a hurry? Healthcare Stocks Lists: Performance Trends Table, Stock Charts
Sort Healthcare stocks: Daily, Weekly, Year-to-Date, Market Cap & Trends. Filter Healthcare stocks list by size:All Healthcare Large Mid-Range Small |
| 12Stocks.com Healthcare Stocks Performances & Trends Daily | |||||||||
|
|  The overall Smart Investing & Trading Score is 57 (0-bearish to 100-bullish) which puts Healthcare sector in short term neutral trend. The Smart Investing & Trading Score from previous trading session is 60 and a deterioration of trend continues.
| ||||||||
Here are the Smart Investing & Trading Scores of the most requested Healthcare stocks at 12Stocks.com (click stock name for detailed review):
|


| 12Stocks.com: Investing in Healthcare sector with Stocks | |
|
The following table helps investors and traders sort through current performance and trends (as measured by Smart Investing & Trading Score) of various
stocks in the Healthcare sector. Quick View: Move mouse or cursor over stock symbol (ticker) to view short-term Technical chart and over stock name to view long term chart. Click on  to add stock symbol to your watchlist and to add stock symbol to your watchlist and  to view watchlist. Click on any ticker or stock name for detailed market intelligence report for that stock. to view watchlist. Click on any ticker or stock name for detailed market intelligence report for that stock. |
12Stocks.com Performance of Stocks in Healthcare Sector
| Ticker | Stock Name | Watchlist | Category | Recent Price | Smart Investing & Trading Score | Change % | YTD Change% |
| MRK | Merck |   | Pharmaceutical | 128.26 | 48 | -0.42% | 17.65% |
| ADPT | Adaptive Biotechnologies | | Biotechnology | 2.93 | 47 | 5.02% | -40.20% |
| EGRX | Eagle | | Pharmaceutical | 4.40 | 47 | 5.01% | -15.87% |
| MPLN | MultiPlan | | Healthcare Plans | 0.67 | 47 | 3.72% | -53.77% |
| MOLN | Molecular Partners | | Biotechnology | 3.87 | 47 | 2.93% | -3.61% |
| MIST | Milestone | | Biotechnology | 1.64 | 47 | 2.50% | -1.80% |
| QURE | uniQure N.V | | Biotechnology | 4.68 | 47 | 2.41% | -30.87% |
| CTSO | Cytosorbents | | Laboratories | 0.82 | 47 | -2.53% | -26.18% |
| VMD | Viemed | | Equipment | 8.19 | 47 | -1.92% | 4.33% |
| OGI | OrganiGram | | Pharmaceutical | 1.88 | 47 | -1.83% | 43.51% |
| KALA | Kala | | Biotechnology | 6.75 | 47 | -0.81% | -3.50% |
| AVIR | Atea | | Biotechnology | 3.83 | 47 | -0.52% | 25.57% |
| CARA | Cara | | Biotechnology | 0.77 | 47 | 1.79% | 3.93% |
| BCLI | Brainstorm Cell | | Biotechnology | 0.40 | 46 | -8.33% | 45.90% |
| HOLX | Hologic | | Instruments | 75.91 | 46 | -0.49% | 6.24% |
| PRAX | Praxis Precision | | Biotechnology | 54.16 | 46 | -1.81% | 141.30% |
| KRYS | Krystal Biotech | | Biotechnology | 160.23 | 45 | 0.35% | 29.16% |
| INNV | InnovAge Holding | | Medical Care Facilities | 3.78 | 45 | -3.69% | -33.68% |
| TMO | Thermo Fisher | | Laboratories | 571.25 | 45 | -0.65% | 7.62% |
| AXSM | Axsome | | Biotechnology | 74.19 | 45 | -0.93% | -6.78% |
| VREX | Varex Imaging | | Equipment | 16.43 | 45 | -0.90% | -19.85% |
| TRVN | Trevena | | Biotechnology | 0.41 | 44 | 6.70% | -43.29% |
| PHAT | Phathom | | Biotechnology | 9.76 | 44 | 5.40% | 6.90% |
| KOD | Kodiak Sciences | | Biotechnology | 3.70 | 44 | 4.82% | 21.71% |
| RGNX | REGENXBIO | | Biotechnology | 16.64 | 44 | 2.72% | -7.30% |
| For chart view version of above stock list: Chart View ➞ 0 - 25 , 25 - 50 , 50 - 75 , 75 - 100 , 100 - 125 , 125 - 150 , 150 - 175 , 175 - 200 , 200 - 225 , 225 - 250 , 250 - 275 , 275 - 300 , 300 - 325 , 325 - 350 , 350 - 375 , 375 - 400 , 400 - 425 , 425 - 450 , 450 - 475 , 475 - 500 , 500 - 525 , 525 - 550 , 550 - 575 , 575 - 600 , 600 - 625 , 625 - 650 , 650 - 675 , 675 - 700 , 700 - 725 | ||
 | Click To Change The Sort Order: By Market Cap or Company Size Performance: Year-to-date, Week and Day |  |
|
Get the most comprehensive stock market coverage daily at 12Stocks.com ➞ Best Stocks Today ➞ Best Stocks Weekly ➞ Best Stocks Year-to-Date ➞ Best Stocks Trends ➞  Best Stocks Today 12Stocks.com Best Nasdaq Stocks ➞ Best S&P 500 Stocks ➞ Best Tech Stocks ➞ Best Biotech Stocks ➞ |
| Detailed Overview of Healthcare Stocks |
| Healthcare Technical Overview, Leaders & Laggards, Top Healthcare ETF Funds & Detailed Healthcare Stocks List, Charts, Trends & More |
| Healthcare Sector: Technical Analysis, Trends & YTD Performance | |
| Healthcare sector is composed of stocks
from pharmaceutical, biotech, diagnostics labs, insurance providers
and healthcare services. Healthcare sector, as represented by XLV, an exchange-traded fund [ETF] that holds basket of Healthcare stocks (e.g, Merck, Amgen) is up by 3.01% and is currently underperforming the overall market by -2.61% year-to-date. Below is a quick view of Technical charts and trends: |
|
 XLV Weekly Chart |
|
| Long Term Trend: Not Good | |
| Medium Term Trend: Good | |
 XLV Daily Chart |
|
| Short Term Trend: Very Good | |
| Overall Trend Score: 57 | |
| YTD Performance: 3.01% | |
| **Trend Scores & Views Are Only For Educational Purposes And Not For Investing | |
| 12Stocks.com: Top Performing Healthcare Sector Stocks | ||||||||||||||||||||||||||||||||||||||||||||||||
 The top performing Healthcare sector stocks year to date are
Now, more recently, over last week, the top performing Healthcare sector stocks on the move are


|
||||||||||||||||||||||||||||||||||||||||||||||||
| 12Stocks.com: Investing in Healthcare Sector using Exchange Traded Funds | |
|
The following table shows list of key exchange traded funds (ETF) that
help investors track Healthcare Index. For detailed view, check out our ETF Funds section of our website. Quick View: Move mouse or cursor over ETF symbol (ticker) to view short-term Technical chart and over ETF name to view long term chart. Click on ticker or stock name for detailed view. Click on to add stock symbol to your watchlist and to view watchlist. |
12Stocks.com List of ETFs that track Healthcare Index
| Ticker | ETF Name | Watchlist | Recent Price | Smart Investing & Trading Score | Change % | Week % | Year-to-date % |
| XLV | Health Care | | 140.48 | 57 | -0.07 | 0.37 | 3.01% |
| XBI | Biotech | | 88.34 | 50 | 1.16 | 5.81 | -1.06% |
| IBB | Biotechnology | | 130.65 | 64 | 0.90 | 3.29 | -3.83% |
| BBH | Biotech | | 160.51 | 64 | 1.18 | 3.12 | -2.9% |
| VHT | Health Care | | 257.14 | 37 | -0.05 | 0.71 | 2.57% |
| IYH | Healthcare | | 59.12 | 37 | -0.10 | 0.87 | 3.27% |
| IHF | Healthcare Providers | | 51.65 | 15 | 0.41 | -0.52 | -1.64% |
| IHI | Medical Devices | | 55.16 | 0 | 0.25 | -0.67 | 2.2% |
| BIB | Biotechnology | | 53.80 | 69 | 2.32 | 8.34 | -5.7% |
| BIS | Short Biotech | | 18.66 | 36 | -2.36 | -7.72 | 3.26% |
| XHE | Health Care Equipment | | 84.89 | 47 | 1.16 | 2.98 | 0.75% |
| CURE | Healthcare Bull 3X | | 105.81 | 35 | -0.70 | 0.48 | 4% |
| LABU | Biotech Bull 3X | | 102.99 | 42 | 3.19 | 17.69 | -15.56% |
| LABD | Biotech Bear 3X | | 8.76 | 44 | -2.99 | -16.73 | -9.6% |
| PSCH | SmallCap Health Care | | 42.05 | 30 | 1.33 | 3.32 | -1.75% |
| XHS | Health Care Services | | 88.14 | 27 | -0.19 | 0.31 | -0.91% |
| PTH | DWA Healthcare Momentum | | 41.74 | 22 | 1.14 | 4.64 | 6.64% |
| BTEC | Principal Healthcare Innovators | | 35.98 | 42 | 0.25 | 5.07 | -0.95% |
| RXL | Health Care | | 95.21 | 54 | -0.12 | 0.41 | 4.16% |
| RXD | Short Health Care | | 11.34 | 49 | -0.18 | -0.96 | -4.91% |
| 12Stocks.com: Charts, Trends, Fundamental Data and Performances of Healthcare Stocks | |
|
We now take in-depth look at all Healthcare stocks including charts, multi-period performances and overall trends (as measured by Smart Investing & Trading Score). One can sort Healthcare stocks (click link to choose) by Daily, Weekly and by Year-to-Date performances. Also, one can sort by size of the company or by market capitalization. |
| Select Your Default Chart Type: | |||||
| |||||
| Click on stock symbol or name for detailed view. Click on to add stock symbol to your watchlist and to view watchlist. Quick View: Move mouse or cursor over "Daily" to quickly view daily Technical stock chart and over "Weekly" to view weekly Technical stock chart. | |||||

 | MRK Merck & Co., Inc. |
| Sector: Health Care | |
| SubSector: Drug Manufacturers - Major | |
| MarketCap: 192657 Millions | |
| Recent Price: 128.26 Smart Investing & Trading Score: 48 | |
| Day Percent Change: -0.42% Day Change: -0.54 | |
| Week Change: -2.24% Year-to-date Change: 17.7% | |
| MRK Links: Profile News Message Board | |
| Charts:- Daily , Weekly | |
| Add MRK to Watchlist: View: Get Complete MRK Trend Analysis ➞ | |
 | ADPT Adaptive Biotechnologies Corporation |
| Sector: Health Care | |
| SubSector: Biotechnology | |
| MarketCap: 3525.75 Millions | |
| Recent Price: 2.93 Smart Investing & Trading Score: 47 | |
| Day Percent Change: 5.02% Day Change: 0.14 | |
| Week Change: 12.69% Year-to-date Change: -40.2% | |
| ADPT Links: Profile News Message Board | |
| Charts:- Daily , Weekly | |
| Add ADPT to Watchlist: View: Get Complete ADPT Trend Analysis ➞ | |
 | EGRX Eagle Pharmaceuticals, Inc. |
| Sector: Health Care | |
| SubSector: Drugs - Generic | |
| MarketCap: 573.385 Millions | |
| Recent Price: 4.40 Smart Investing & Trading Score: 47 | |
| Day Percent Change: 5.01% Day Change: 0.21 | |
| Week Change: 5.77% Year-to-date Change: -15.9% | |
| EGRX Links: Profile News Message Board | |
| Charts:- Daily , Weekly | |
| Add EGRX to Watchlist: View: Get Complete EGRX Trend Analysis ➞ | |
 | MPLN MultiPlan Corporation |
| Sector: Health Care | |
| SubSector: Healthcare Plans | |
| MarketCap: 56087 Millions | |
| Recent Price: 0.67 Smart Investing & Trading Score: 47 | |
| Day Percent Change: 3.72% Day Change: 0.02 | |
| Week Change: 15.67% Year-to-date Change: -53.8% | |
| MPLN Links: Profile News Message Board | |
| Charts:- Daily , Weekly | |
| Add MPLN to Watchlist: View: Get Complete MPLN Trend Analysis ➞ | |
 | MOLN Molecular Partners AG |
| Sector: Health Care | |
| SubSector: Biotechnology | |
| MarketCap: 216 Millions | |
| Recent Price: 3.87 Smart Investing & Trading Score: 47 | |
| Day Percent Change: 2.93% Day Change: 0.11 | |
| Week Change: -0.26% Year-to-date Change: -3.6% | |
| MOLN Links: Profile News Message Board | |
| Charts:- Daily , Weekly | |
| Add MOLN to Watchlist: View: Get Complete MOLN Trend Analysis ➞ | |
 | MIST Milestone Pharmaceuticals Inc. |
| Sector: Health Care | |
| SubSector: Biotechnology | |
| MarketCap: 342.685 Millions | |
| Recent Price: 1.64 Smart Investing & Trading Score: 47 | |
| Day Percent Change: 2.50% Day Change: 0.04 | |
| Week Change: 6.49% Year-to-date Change: -1.8% | |
| MIST Links: Profile News Message Board | |
| Charts:- Daily , Weekly | |
| Add MIST to Watchlist: View: Get Complete MIST Trend Analysis ➞ | |
 | QURE uniQure N.V. |
| Sector: Health Care | |
| SubSector: Biotechnology | |
| MarketCap: 2267.25 Millions | |
| Recent Price: 4.68 Smart Investing & Trading Score: 47 | |
| Day Percent Change: 2.41% Day Change: 0.11 | |
| Week Change: 3.31% Year-to-date Change: -30.9% | |
| QURE Links: Profile News Message Board | |
| Charts:- Daily , Weekly | |
| Add QURE to Watchlist: View: Get Complete QURE Trend Analysis ➞ | |
 | CTSO Cytosorbents Corporation |
| Sector: Health Care | |
| SubSector: Medical Laboratories & Research | |
| MarketCap: 166.2 Millions | |
| Recent Price: 0.82 Smart Investing & Trading Score: 47 | |
| Day Percent Change: -2.53% Day Change: -0.02 | |
| Week Change: 0.05% Year-to-date Change: -26.2% | |
| CTSO Links: Profile News Message Board | |
| Charts:- Daily , Weekly | |
| Add CTSO to Watchlist: View: Get Complete CTSO Trend Analysis ➞ | |
 | VMD Viemed Healthcare, Inc. |
| Sector: Health Care | |
| SubSector: Medical Appliances & Equipment | |
| MarketCap: 177.28 Millions | |
| Recent Price: 8.19 Smart Investing & Trading Score: 47 | |
| Day Percent Change: -1.92% Day Change: -0.16 | |
| Week Change: -1.44% Year-to-date Change: 4.3% | |
| VMD Links: Profile News Message Board | |
| Charts:- Daily , Weekly | |
| Add VMD to Watchlist: View: Get Complete VMD Trend Analysis ➞ | |
 | OGI OrganiGram Holdings Inc. |
| Sector: Health Care | |
| SubSector: Drugs - Generic | |
| MarketCap: 256.885 Millions | |
| Recent Price: 1.88 Smart Investing & Trading Score: 47 | |
| Day Percent Change: -1.83% Day Change: -0.04 | |
| Week Change: 1.08% Year-to-date Change: 43.5% | |
| OGI Links: Profile News Message Board | |
| Charts:- Daily , Weekly | |
| Add OGI to Watchlist: View: Get Complete OGI Trend Analysis ➞ | |
 | KALA Kala Pharmaceuticals, Inc. |
| Sector: Health Care | |
| SubSector: Biotechnology | |
| MarketCap: 276.485 Millions | |
| Recent Price: 6.75 Smart Investing & Trading Score: 47 | |
| Day Percent Change: -0.81% Day Change: -0.05 | |
| Week Change: 7.22% Year-to-date Change: -3.5% | |
| KALA Links: Profile News Message Board | |
| Charts:- Daily , Weekly | |
| Add KALA to Watchlist: View: Get Complete KALA Trend Analysis ➞ | |
 | AVIR Atea Pharmaceuticals, Inc. |
| Sector: Health Care | |
| SubSector: Biotechnology | |
| MarketCap: 22587 Millions | |
| Recent Price: 3.83 Smart Investing & Trading Score: 47 | |
| Day Percent Change: -0.52% Day Change: -0.02 | |
| Week Change: 3.23% Year-to-date Change: 25.6% | |
| AVIR Links: Profile News Message Board | |
| Charts:- Daily , Weekly | |
| Add AVIR to Watchlist: View: Get Complete AVIR Trend Analysis ➞ | |
 | CARA Cara Therapeutics, Inc. |
| Sector: Health Care | |
| SubSector: Biotechnology | |
| MarketCap: 597.985 Millions | |
| Recent Price: 0.77 Smart Investing & Trading Score: 47 | |
| Day Percent Change: 1.79% Day Change: 0.01 | |
| Week Change: 12.85% Year-to-date Change: 3.9% | |
| CARA Links: Profile News Message Board | |
| Charts:- Daily , Weekly | |
| Add CARA to Watchlist: View: Get Complete CARA Trend Analysis ➞ | |
 | BCLI Brainstorm Cell Therapeutics Inc. |
| Sector: Health Care | |
| SubSector: Biotechnology | |
| MarketCap: 141.285 Millions | |
| Recent Price: 0.40 Smart Investing & Trading Score: 46 | |
| Day Percent Change: -8.33% Day Change: -0.04 | |
| Week Change: -25.48% Year-to-date Change: 45.9% | |
| BCLI Links: Profile News Message Board | |
| Charts:- Daily , Weekly | |
| Add BCLI to Watchlist: View: Get Complete BCLI Trend Analysis ➞ | |
 | HOLX Hologic, Inc. |
| Sector: Health Care | |
| SubSector: Medical Instruments & Supplies | |
| MarketCap: 9075.2 Millions | |
| Recent Price: 75.91 Smart Investing & Trading Score: 46 | |
| Day Percent Change: -0.49% Day Change: -0.37 | |
| Week Change: -0.09% Year-to-date Change: 6.2% | |
| HOLX Links: Profile News Message Board | |
| Charts:- Daily , Weekly | |
| Add HOLX to Watchlist: View: Get Complete HOLX Trend Analysis ➞ | |
 | PRAX Praxis Precision Medicines, Inc. |
| Sector: Health Care | |
| SubSector: Biotechnology | |
| MarketCap: 16587 Millions | |
| Recent Price: 54.16 Smart Investing & Trading Score: 46 | |
| Day Percent Change: -1.81% Day Change: -1.00 | |
| Week Change: -1.17% Year-to-date Change: 141.3% | |
| PRAX Links: Profile News Message Board | |
| Charts:- Daily , Weekly | |
| Add PRAX to Watchlist: View: Get Complete PRAX Trend Analysis ➞ | |
 | KRYS Krystal Biotech, Inc. |
| Sector: Health Care | |
| SubSector: Biotechnology | |
| MarketCap: 874.085 Millions | |
| Recent Price: 160.23 Smart Investing & Trading Score: 45 | |
| Day Percent Change: 0.35% Day Change: 0.56 | |
| Week Change: 2.14% Year-to-date Change: 29.2% | |
| KRYS Links: Profile News Message Board | |
| Charts:- Daily , Weekly | |
| Add KRYS to Watchlist: View: Get Complete KRYS Trend Analysis ➞ | |
 | INNV InnovAge Holding Corp. |
| Sector: Health Care | |
| SubSector: Medical Care Facilities | |
| MarketCap: 1010 Millions | |
| Recent Price: 3.78 Smart Investing & Trading Score: 45 | |
| Day Percent Change: -3.69% Day Change: -0.15 | |
| Week Change: -0.53% Year-to-date Change: -33.7% | |
| INNV Links: Profile News Message Board | |
| Charts:- Daily , Weekly | |
| Add INNV to Watchlist: View: Get Complete INNV Trend Analysis ➞ | |
 | TMO Thermo Fisher Scientific Inc. |
| Sector: Health Care | |
| SubSector: Medical Laboratories & Research | |
| MarketCap: 112999 Millions | |
| Recent Price: 571.25 Smart Investing & Trading Score: 45 | |
| Day Percent Change: -0.65% Day Change: -3.74 | |
| Week Change: -0.41% Year-to-date Change: 7.6% | |
| TMO Links: Profile News Message Board | |
| Charts:- Daily , Weekly | |
| Add TMO to Watchlist: View: Get Complete TMO Trend Analysis ➞ | |
 | AXSM Axsome Therapeutics, Inc. |
| Sector: Health Care | |
| SubSector: Biotechnology | |
| MarketCap: 2284.25 Millions | |
| Recent Price: 74.19 Smart Investing & Trading Score: 45 | |
| Day Percent Change: -0.93% Day Change: -0.70 | |
| Week Change: 3.46% Year-to-date Change: -6.8% | |
| AXSM Links: Profile News Message Board | |
| Charts:- Daily , Weekly | |
| Add AXSM to Watchlist: View: Get Complete AXSM Trend Analysis ➞ | |
 | VREX Varex Imaging Corporation |
| Sector: Health Care | |
| SubSector: Medical Appliances & Equipment | |
| MarketCap: 718.78 Millions | |
| Recent Price: 16.43 Smart Investing & Trading Score: 45 | |
| Day Percent Change: -0.90% Day Change: -0.15 | |
| Week Change: -2.14% Year-to-date Change: -19.9% | |
| VREX Links: Profile News Message Board | |
| Charts:- Daily , Weekly | |
| Add VREX to Watchlist: View: Get Complete VREX Trend Analysis ➞ | |
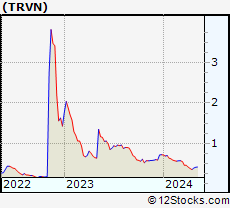 | TRVN Trevena, Inc. |
| Sector: Health Care | |
| SubSector: Biotechnology | |
| MarketCap: 57.7785 Millions | |
| Recent Price: 0.41 Smart Investing & Trading Score: 44 | |
| Day Percent Change: 6.70% Day Change: 0.03 | |
| Week Change: 4.73% Year-to-date Change: -43.3% | |
| TRVN Links: Profile News Message Board | |
| Charts:- Daily , Weekly | |
| Add TRVN to Watchlist: View: Get Complete TRVN Trend Analysis ➞ | |
 | PHAT Phathom Pharmaceuticals, Inc. |
| Sector: Health Care | |
| SubSector: Biotechnology | |
| MarketCap: 728.785 Millions | |
| Recent Price: 9.76 Smart Investing & Trading Score: 44 | |
| Day Percent Change: 5.40% Day Change: 0.50 | |
| Week Change: 6.32% Year-to-date Change: 6.9% | |
| PHAT Links: Profile News Message Board | |
| Charts:- Daily , Weekly | |
| Add PHAT to Watchlist: View: Get Complete PHAT Trend Analysis ➞ | |
 | KOD Kodiak Sciences Inc. |
| Sector: Health Care | |
| SubSector: Biotechnology | |
| MarketCap: 2132.15 Millions | |
| Recent Price: 3.70 Smart Investing & Trading Score: 44 | |
| Day Percent Change: 4.82% Day Change: 0.17 | |
| Week Change: 12.8% Year-to-date Change: 21.7% | |
| KOD Links: Profile News Message Board | |
| Charts:- Daily , Weekly | |
| Add KOD to Watchlist: View: Get Complete KOD Trend Analysis ➞ | |
 | RGNX REGENXBIO Inc. |
| Sector: Health Care | |
| SubSector: Biotechnology | |
| MarketCap: 1232.85 Millions | |
| Recent Price: 16.64 Smart Investing & Trading Score: 44 | |
| Day Percent Change: 2.72% Day Change: 0.44 | |
| Week Change: 2.78% Year-to-date Change: -7.3% | |
| RGNX Links: Profile News Message Board | |
| Charts:- Daily , Weekly | |
| Add RGNX to Watchlist: View: Get Complete RGNX Trend Analysis ➞ | |
| For tabular summary view of above stock list: Summary View ➞ 0 - 25 , 25 - 50 , 50 - 75 , 75 - 100 , 100 - 125 , 125 - 150 , 150 - 175 , 175 - 200 , 200 - 225 , 225 - 250 , 250 - 275 , 275 - 300 , 300 - 325 , 325 - 350 , 350 - 375 , 375 - 400 , 400 - 425 , 425 - 450 , 450 - 475 , 475 - 500 , 500 - 525 , 525 - 550 , 550 - 575 , 575 - 600 , 600 - 625 , 625 - 650 , 650 - 675 , 675 - 700 , 700 - 725 | ||
| Click To Change The Sort Order: By Market Cap or Company Size Performance: Year-to-date, Week and Day | |
| Select Chart Type: | ||
|
Best Stocks Today 12Stocks.com |
© 2024 12Stocks.com Terms & Conditions Privacy Contact Us
All Information Provided Only For Education And Not To Be Used For Investing or Trading. See Terms & Conditions


One More Thing ... Get Best Stocks Delivered Daily!
Never Ever Miss A Move With Our Top Ten Stocks Lists
Find Best Stocks In Any Market - Bull or Bear Market
Take A Peek At Our Top Ten Stocks Lists: Daily, Weekly, Year-to-Date & Top Trends
Find Best Stocks In Any Market - Bull or Bear Market
Take A Peek At Our Top Ten Stocks Lists: Daily, Weekly, Year-to-Date & Top Trends
Healthcare Stocks With Best Up Trends [0-bearish to 100-bullish]: Emergent Bio[100], Lantheus [100], Blueprint Medicines[100], Glaukos [100], TransMedics [100], Corcept [100], Avanos [100], Maravai LifeSciences[100], IRadimed [100], Anika [100], Castle Biosciences[100]
Best Healthcare Stocks Year-to-Date:
Pieris [6075.82%], Precision BioSciences[2869.86%], Avenue [2850.31%], Inovio [2254.9%], Assembly Biosciences[1462%], Agenus [1412.26%], Aurora Cannabis[1363.67%], NuCana [1240.43%], Adverum Biotechnologies[1228.37%], Affimed N.V[748%], CareMax [674.23%] Best Healthcare Stocks This Week:
CytomX [183.02%], GeneDx [75.99%], Deciphera [73.24%], Emergent Bio[71.88%], P3 Health[38.51%], Cue Biopharma[37.73%], TransMedics [35.14%], Seres [34.55%], Surmodics [32.02%], Phibro Animal[31.66%], Poseida [30.99%] Best Healthcare Stocks Daily:
Emergent Bio[70.98%], Regencell Bioscience[23.15%], Pulmonx [21.50%], Orchestra BioMed[18.83%], Cellectis S.A[17.90%], Ocular Therapeutix[16.93%], Lantheus [16.01%], Butterfly Network[13.09%], Blueprint Medicines[12.80%], Moderna [12.68%], Mustang Bio[12.65%]