
 Login Sign Up


| |||||
 |  | ||||

| 12Stocks.com Market Intelligence |
Best Healthcare Stocks
 | "Discover best trending healthcare stocks with 12Stocks.com." |
| - Subu Vdaygiri, Founder, 12Stocks.com |
| In a hurry? Healthcare Stocks Lists: Performance Trends Table, Stock Charts
Sort Healthcare stocks: Daily, Weekly, Year-to-Date, Market Cap & Trends. Filter Healthcare stocks list by size:All Healthcare Large Mid-Range Small |
| 12Stocks.com Healthcare Stocks Performances & Trends Daily | |||||||||
|
|  The overall Smart Investing & Trading Score is 57 (0-bearish to 100-bullish) which puts Healthcare sector in short term neutral trend. The Smart Investing & Trading Score from previous trading session is 60 and a deterioration of trend continues.
| ||||||||
Here are the Smart Investing & Trading Scores of the most requested Healthcare stocks at 12Stocks.com (click stock name for detailed review):
|


| 12Stocks.com: Investing in Healthcare sector with Stocks | |
|
The following table helps investors and traders sort through current performance and trends (as measured by Smart Investing & Trading Score) of various
stocks in the Healthcare sector. Quick View: Move mouse or cursor over stock symbol (ticker) to view short-term Technical chart and over stock name to view long term chart. Click on  to add stock symbol to your watchlist and to add stock symbol to your watchlist and  to view watchlist. Click on any ticker or stock name for detailed market intelligence report for that stock. to view watchlist. Click on any ticker or stock name for detailed market intelligence report for that stock. |
12Stocks.com Performance of Stocks in Healthcare Sector
| Ticker | Stock Name | Watchlist | Category | Recent Price | Smart Investing & Trading Score | Change % | YTD Change% |
| ADMA | ADMA Biologics |   | Biotechnology | 6.74 | 83 | 1.05% | 49.12% |
| EWTX | Edgewise | | Biotechnology | 18.89 | 83 | -0.61% | 66.43% |
| AVDL | Avadel | | Biotechnology | 18.30 | 83 | -0.05% | 29.60% |
| OFIX | Orthofix | | Equipment | 13.24 | 83 | 1.65% | -1.78% |
| XOMAO | XOMA | | Biotechnology | 25.10 | 83 | 0.84% | 0.44% |
| AMGN | Amgen | | Biotechnology | 278.39 | 83 | 0.37% | -3.34% |
| TARO | Taro | | Pharmaceutical | 42.51 | 83 | 0.28% | 1.75% |
| ADUS | Addus HomeCare | | Home Care | 98.41 | 83 | 0.01% | 5.99% |
| ALDX | Aldeyra | | Biotechnology | 4.21 | 81 | 0.24% | 19.94% |
| IBIO | iBio | | Biotechnology | 2.03 | 80 | 9.73% | 48.18% |
| GTHX | G1 | | Biotechnology | 4.44 | 80 | 7.51% | 45.57% |
| NKTR | Nektar | | Biotechnology | 1.67 | 80 | 1.21% | 195.58% |
| ITOS | iTeos | | Biotechnology | 11.49 | 80 | -2.46% | 5.03% |
| COLL | Collegium | | Pharmaceutical | 37.51 | 80 | -0.71% | 21.86% |
| OSCR | Oscar Health | | Healthcare Plans | 17.75 | 78 | 2.25% | 94.95% |
| PODD | Insulet | | Instruments | 173.42 | 78 | 1.85% | -20.08% |
| CGC | Canopy Growth | | Pharmaceutical | 10.34 | 78 | -9.62% | 102.35% |
| PNTG | Pennant | | Long-Term | 21.20 | 78 | -0.28% | 52.30% |
| NBIX | Neurocrine Biosciences | | Biotechnology | 139.83 | 78 | -2.24% | 6.12% |
| ATXI | Avenue | | Biotechnology | 4.75 | 76 | -0.21% | NA |
| SNY | Sanofi | | Pharmaceutical | 49.46 | 76 | -1.14% | -0.54% |
| AZN | AstraZeneca | | Pharmaceutical | 75.80 | 76 | -0.80% | 12.55% |
| UHS | Universal Health | | Hospitals | 169.89 | 76 | -0.18% | 11.45% |
| ZURA | Zura Bio | | Biotechnology | 4.34 | 75 | 5.08% | -7.36% |
| CDXC | ChromaDex | | Biotechnology | 3.76 | 75 | 2.73% | 162.94% |
| For chart view version of above stock list: Chart View ➞ 0 - 25 , 25 - 50 , 50 - 75 , 75 - 100 , 100 - 125 , 125 - 150 , 150 - 175 , 175 - 200 , 200 - 225 , 225 - 250 , 250 - 275 , 275 - 300 , 300 - 325 , 325 - 350 , 350 - 375 , 375 - 400 , 400 - 425 , 425 - 450 , 450 - 475 , 475 - 500 , 500 - 525 , 525 - 550 , 550 - 575 , 575 - 600 , 600 - 625 , 625 - 650 , 650 - 675 , 675 - 700 , 700 - 725 | ||
 | Click To Change The Sort Order: By Market Cap or Company Size Performance: Year-to-date, Week and Day |  |
|
Get the most comprehensive stock market coverage daily at 12Stocks.com ➞ Best Stocks Today ➞ Best Stocks Weekly ➞ Best Stocks Year-to-Date ➞ Best Stocks Trends ➞  Best Stocks Today 12Stocks.com Best Nasdaq Stocks ➞ Best S&P 500 Stocks ➞ Best Tech Stocks ➞ Best Biotech Stocks ➞ |
| Detailed Overview of Healthcare Stocks |
| Healthcare Technical Overview, Leaders & Laggards, Top Healthcare ETF Funds & Detailed Healthcare Stocks List, Charts, Trends & More |
| Healthcare Sector: Technical Analysis, Trends & YTD Performance | |
| Healthcare sector is composed of stocks
from pharmaceutical, biotech, diagnostics labs, insurance providers
and healthcare services. Healthcare sector, as represented by XLV, an exchange-traded fund [ETF] that holds basket of Healthcare stocks (e.g, Merck, Amgen) is up by 3.01% and is currently underperforming the overall market by -2.61% year-to-date. Below is a quick view of Technical charts and trends: |
|
 XLV Weekly Chart |
|
| Long Term Trend: Not Good | |
| Medium Term Trend: Good | |
 XLV Daily Chart |
|
| Short Term Trend: Very Good | |
| Overall Trend Score: 57 | |
| YTD Performance: 3.01% | |
| **Trend Scores & Views Are Only For Educational Purposes And Not For Investing | |
| 12Stocks.com: Top Performing Healthcare Sector Stocks | ||||||||||||||||||||||||||||||||||||||||||||||||
 The top performing Healthcare sector stocks year to date are
Now, more recently, over last week, the top performing Healthcare sector stocks on the move are


|
||||||||||||||||||||||||||||||||||||||||||||||||
| 12Stocks.com: Investing in Healthcare Sector using Exchange Traded Funds | |
|
The following table shows list of key exchange traded funds (ETF) that
help investors track Healthcare Index. For detailed view, check out our ETF Funds section of our website. Quick View: Move mouse or cursor over ETF symbol (ticker) to view short-term Technical chart and over ETF name to view long term chart. Click on ticker or stock name for detailed view. Click on to add stock symbol to your watchlist and to view watchlist. |
12Stocks.com List of ETFs that track Healthcare Index
| Ticker | ETF Name | Watchlist | Recent Price | Smart Investing & Trading Score | Change % | Week % | Year-to-date % |
| XLV | Health Care | | 140.48 | 57 | -0.07 | 0.37 | 3.01% |
| XBI | Biotech | | 88.34 | 50 | 1.16 | 5.81 | -1.06% |
| IBB | Biotechnology | | 130.65 | 64 | 0.90 | 3.29 | -3.83% |
| BBH | Biotech | | 160.51 | 64 | 1.18 | 3.12 | -2.9% |
| VHT | Health Care | | 257.14 | 50 | -0.05 | 0.71 | 2.57% |
| IYH | Healthcare | | 59.12 | 50 | -0.10 | 0.87 | 3.27% |
| IHF | Healthcare Providers | | 51.65 | 15 | 0.41 | -0.52 | -1.64% |
| IHI | Medical Devices | | 55.16 | 10 | 0.25 | -0.67 | 2.2% |
| BIB | Biotechnology | | 53.80 | 69 | 2.32 | 8.34 | -5.7% |
| BIS | Short Biotech | | 18.66 | 36 | -2.36 | -7.72 | 3.26% |
| XHE | Health Care Equipment | | 84.89 | 80 | 1.16 | 2.98 | 0.75% |
| CURE | Healthcare Bull 3X | | 105.81 | 35 | -0.70 | 0.48 | 4% |
| LABU | Biotech Bull 3X | | 102.99 | 42 | 3.19 | 17.69 | -15.56% |
| LABD | Biotech Bear 3X | | 8.76 | 36 | -2.99 | -16.73 | -9.6% |
| PSCH | SmallCap Health Care | | 42.05 | 62 | 1.33 | 3.32 | -1.75% |
| XHS | Health Care Services | | 88.14 | 20 | -0.19 | 0.31 | -0.91% |
| PTH | DWA Healthcare Momentum | | 41.74 | 50 | 1.14 | 4.64 | 6.64% |
| BTEC | Principal Healthcare Innovators | | 35.98 | 55 | 0.25 | 5.07 | -0.95% |
| RXL | Health Care | | 95.21 | 54 | -0.12 | 0.41 | 4.16% |
| RXD | Short Health Care | | 11.34 | 49 | -0.18 | -0.96 | -4.91% |
| 12Stocks.com: Charts, Trends, Fundamental Data and Performances of Healthcare Stocks | |
|
We now take in-depth look at all Healthcare stocks including charts, multi-period performances and overall trends (as measured by Smart Investing & Trading Score). One can sort Healthcare stocks (click link to choose) by Daily, Weekly and by Year-to-Date performances. Also, one can sort by size of the company or by market capitalization. |
| Select Your Default Chart Type: | |||||
| |||||
| Click on stock symbol or name for detailed view. Click on to add stock symbol to your watchlist and to view watchlist. Quick View: Move mouse or cursor over "Daily" to quickly view daily Technical stock chart and over "Weekly" to view weekly Technical stock chart. | |||||

 | ADMA ADMA Biologics, Inc. |
| Sector: Health Care | |
| SubSector: Biotechnology | |
| MarketCap: 204.985 Millions | |
| Recent Price: 6.74 Smart Investing & Trading Score: 83 | |
| Day Percent Change: 1.05% Day Change: 0.07 | |
| Week Change: 2.9% Year-to-date Change: 49.1% | |
| ADMA Links: Profile News Message Board | |
| Charts:- Daily , Weekly | |
| Add ADMA to Watchlist: View: Get Complete ADMA Trend Analysis ➞ | |
 | EWTX Edgewise Therapeutics, Inc. |
| Sector: Health Care | |
| SubSector: Biotechnology | |
| MarketCap: 492 Millions | |
| Recent Price: 18.89 Smart Investing & Trading Score: 83 | |
| Day Percent Change: -0.61% Day Change: -0.11 | |
| Week Change: 16.79% Year-to-date Change: 66.4% | |
| EWTX Links: Profile News Message Board | |
| Charts:- Daily , Weekly | |
| Add EWTX to Watchlist: View: Get Complete EWTX Trend Analysis ➞ | |
 | AVDL Avadel Pharmaceuticals plc |
| Sector: Health Care | |
| SubSector: Biotechnology | |
| MarketCap: 354.485 Millions | |
| Recent Price: 18.30 Smart Investing & Trading Score: 83 | |
| Day Percent Change: -0.05% Day Change: -0.01 | |
| Week Change: 2.75% Year-to-date Change: 29.6% | |
| AVDL Links: Profile News Message Board | |
| Charts:- Daily , Weekly | |
| Add AVDL to Watchlist: View: Get Complete AVDL Trend Analysis ➞ | |
 | OFIX Orthofix Medical Inc. |
| Sector: Health Care | |
| SubSector: Medical Appliances & Equipment | |
| MarketCap: 508.18 Millions | |
| Recent Price: 13.24 Smart Investing & Trading Score: 83 | |
| Day Percent Change: 1.65% Day Change: 0.21 | |
| Week Change: 1.92% Year-to-date Change: -1.8% | |
| OFIX Links: Profile News Message Board | |
| Charts:- Daily , Weekly | |
| Add OFIX to Watchlist: View: Get Complete OFIX Trend Analysis ➞ | |
 | XOMAO XOMA Corporation |
| Sector: Health Care | |
| SubSector: Biotechnology | |
| MarketCap: 217 Millions | |
| Recent Price: 25.10 Smart Investing & Trading Score: 83 | |
| Day Percent Change: 0.84% Day Change: 0.21 | |
| Week Change: 0.52% Year-to-date Change: 0.4% | |
| XOMAO Links: Profile News Message Board | |
| Charts:- Daily , Weekly | |
| Add XOMAO to Watchlist: View: Get Complete XOMAO Trend Analysis ➞ | |
 | AMGN Amgen Inc. |
| Sector: Health Care | |
| SubSector: Biotechnology | |
| MarketCap: 121030 Millions | |
| Recent Price: 278.39 Smart Investing & Trading Score: 83 | |
| Day Percent Change: 0.37% Day Change: 1.02 | |
| Week Change: 3.12% Year-to-date Change: -3.3% | |
| AMGN Links: Profile News Message Board | |
| Charts:- Daily , Weekly | |
| Add AMGN to Watchlist: View: Get Complete AMGN Trend Analysis ➞ | |
 | TARO Taro Pharmaceutical Industries Ltd. |
| Sector: Health Care | |
| SubSector: Drug Manufacturers - Other | |
| MarketCap: 2379.33 Millions | |
| Recent Price: 42.51 Smart Investing & Trading Score: 83 | |
| Day Percent Change: 0.28% Day Change: 0.12 | |
| Week Change: 0.26% Year-to-date Change: 1.8% | |
| TARO Links: Profile News Message Board | |
| Charts:- Daily , Weekly | |
| Add TARO to Watchlist: View: Get Complete TARO Trend Analysis ➞ | |
 | ADUS Addus HomeCare Corporation |
| Sector: Health Care | |
| SubSector: Home Health Care | |
| MarketCap: 994.795 Millions | |
| Recent Price: 98.41 Smart Investing & Trading Score: 83 | |
| Day Percent Change: 0.01% Day Change: 0.01 | |
| Week Change: 4.09% Year-to-date Change: 6.0% | |
| ADUS Links: Profile News Message Board | |
| Charts:- Daily , Weekly | |
| Add ADUS to Watchlist: View: Get Complete ADUS Trend Analysis ➞ | |
 | ALDX Aldeyra Therapeutics, Inc. |
| Sector: Health Care | |
| SubSector: Biotechnology | |
| MarketCap: 61.2785 Millions | |
| Recent Price: 4.21 Smart Investing & Trading Score: 81 | |
| Day Percent Change: 0.24% Day Change: 0.01 | |
| Week Change: 7.12% Year-to-date Change: 19.9% | |
| ALDX Links: Profile News Message Board | |
| Charts:- Daily , Weekly | |
| Add ALDX to Watchlist: View: Get Complete ALDX Trend Analysis ➞ | |
 | IBIO iBio, Inc. |
| Sector: Health Care | |
| SubSector: Biotechnology | |
| MarketCap: 110.885 Millions | |
| Recent Price: 2.03 Smart Investing & Trading Score: 80 | |
| Day Percent Change: 9.73% Day Change: 0.18 | |
| Week Change: 15.34% Year-to-date Change: 48.2% | |
| IBIO Links: Profile News Message Board | |
| Charts:- Daily , Weekly | |
| Add IBIO to Watchlist: View: Get Complete IBIO Trend Analysis ➞ | |
 | GTHX G1 Therapeutics, Inc. |
| Sector: Health Care | |
| SubSector: Biotechnology | |
| MarketCap: 484.085 Millions | |
| Recent Price: 4.44 Smart Investing & Trading Score: 80 | |
| Day Percent Change: 7.51% Day Change: 0.31 | |
| Week Change: 11.28% Year-to-date Change: 45.6% | |
| GTHX Links: Profile News Message Board | |
| Charts:- Daily , Weekly | |
| Add GTHX to Watchlist: View: Get Complete GTHX Trend Analysis ➞ | |
 | NKTR Nektar Therapeutics |
| Sector: Health Care | |
| SubSector: Biotechnology | |
| MarketCap: 2953.45 Millions | |
| Recent Price: 1.67 Smart Investing & Trading Score: 80 | |
| Day Percent Change: 1.21% Day Change: 0.02 | |
| Week Change: 26.52% Year-to-date Change: 195.6% | |
| NKTR Links: Profile News Message Board | |
| Charts:- Daily , Weekly | |
| Add NKTR to Watchlist: View: Get Complete NKTR Trend Analysis ➞ | |
 | ITOS iTeos Therapeutics, Inc. |
| Sector: Health Care | |
| SubSector: Biotechnology | |
| MarketCap: 10487 Millions | |
| Recent Price: 11.49 Smart Investing & Trading Score: 80 | |
| Day Percent Change: -2.46% Day Change: -0.29 | |
| Week Change: 6.39% Year-to-date Change: 5.0% | |
| ITOS Links: Profile News Message Board | |
| Charts:- Daily , Weekly | |
| Add ITOS to Watchlist: View: Get Complete ITOS Trend Analysis ➞ | |
 | COLL Collegium Pharmaceutical, Inc. |
| Sector: Health Care | |
| SubSector: Drugs - Generic | |
| MarketCap: 569.185 Millions | |
| Recent Price: 37.51 Smart Investing & Trading Score: 80 | |
| Day Percent Change: -0.71% Day Change: -0.27 | |
| Week Change: 2.99% Year-to-date Change: 21.9% | |
| COLL Links: Profile News Message Board | |
| Charts:- Daily , Weekly | |
| Add COLL to Watchlist: View: Get Complete COLL Trend Analysis ➞ | |
 | OSCR Oscar Health, Inc. |
| Sector: Health Care | |
| SubSector: Healthcare Plans | |
| MarketCap: 1790 Millions | |
| Recent Price: 17.75 Smart Investing & Trading Score: 78 | |
| Day Percent Change: 2.25% Day Change: 0.39 | |
| Week Change: 1.08% Year-to-date Change: 95.0% | |
| OSCR Links: Profile News Message Board | |
| Charts:- Daily , Weekly | |
| Add OSCR to Watchlist: View: Get Complete OSCR Trend Analysis ➞ | |
 | PODD Insulet Corporation |
| Sector: Health Care | |
| SubSector: Medical Instruments & Supplies | |
| MarketCap: 9313.2 Millions | |
| Recent Price: 173.42 Smart Investing & Trading Score: 78 | |
| Day Percent Change: 1.85% Day Change: 3.15 | |
| Week Change: 4.35% Year-to-date Change: -20.1% | |
| PODD Links: Profile News Message Board | |
| Charts:- Daily , Weekly | |
| Add PODD to Watchlist: View: Get Complete PODD Trend Analysis ➞ | |
 | CGC Canopy Growth Corporation |
| Sector: Health Care | |
| SubSector: Drug Manufacturers - Other | |
| MarketCap: 4136.33 Millions | |
| Recent Price: 10.34 Smart Investing & Trading Score: 78 | |
| Day Percent Change: -9.62% Day Change: -1.10 | |
| Week Change: 16.05% Year-to-date Change: 102.4% | |
| CGC Links: Profile News Message Board | |
| Charts:- Daily , Weekly | |
| Add CGC to Watchlist: View: Get Complete CGC Trend Analysis ➞ | |
 | PNTG The Pennant Group, Inc. |
| Sector: Health Care | |
| SubSector: Long-Term Care Facilities | |
| MarketCap: 451.786 Millions | |
| Recent Price: 21.20 Smart Investing & Trading Score: 78 | |
| Day Percent Change: -0.28% Day Change: -0.06 | |
| Week Change: 2.02% Year-to-date Change: 52.3% | |
| PNTG Links: Profile News Message Board | |
| Charts:- Daily , Weekly | |
| Add PNTG to Watchlist: View: Get Complete PNTG Trend Analysis ➞ | |
 | NBIX Neurocrine Biosciences, Inc. |
| Sector: Health Care | |
| SubSector: Biotechnology | |
| MarketCap: 7897.85 Millions | |
| Recent Price: 139.83 Smart Investing & Trading Score: 78 | |
| Day Percent Change: -2.24% Day Change: -3.20 | |
| Week Change: 2.82% Year-to-date Change: 6.1% | |
| NBIX Links: Profile News Message Board | |
| Charts:- Daily , Weekly | |
| Add NBIX to Watchlist: View: Get Complete NBIX Trend Analysis ➞ | |
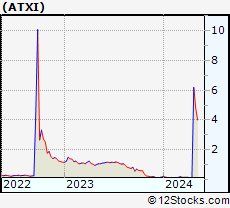 | ATXI Avenue Therapeutics, Inc. |
| Sector: Health Care | |
| SubSector: Biotechnology | |
| MarketCap: 118.185 Millions | |
| Recent Price: 4.75 Smart Investing & Trading Score: 76 | |
| Day Percent Change: -0.21% Day Change: -0.01 | |
| Week Change: -23.39% Year-to-date Change: 2,850.3% | |
| ATXI Links: Profile News Message Board | |
| Charts:- Daily , Weekly | |
| Add ATXI to Watchlist: View: Get Complete ATXI Trend Analysis ➞ | |
 | SNY Sanofi |
| Sector: Health Care | |
| SubSector: Drug Manufacturers - Major | |
| MarketCap: 104761 Millions | |
| Recent Price: 49.46 Smart Investing & Trading Score: 76 | |
| Day Percent Change: -1.14% Day Change: -0.57 | |
| Week Change: 0.67% Year-to-date Change: -0.5% | |
| SNY Links: Profile News Message Board | |
| Charts:- Daily , Weekly | |
| Add SNY to Watchlist: View: Get Complete SNY Trend Analysis ➞ | |
 | AZN AstraZeneca PLC |
| Sector: Health Care | |
| SubSector: Drug Manufacturers - Major | |
| MarketCap: 113154 Millions | |
| Recent Price: 75.80 Smart Investing & Trading Score: 76 | |
| Day Percent Change: -0.80% Day Change: -0.61 | |
| Week Change: 0.84% Year-to-date Change: 12.6% | |
| AZN Links: Profile News Message Board | |
| Charts:- Daily , Weekly | |
| Add AZN to Watchlist: View: Get Complete AZN Trend Analysis ➞ | |
 | UHS Universal Health Services, Inc. |
| Sector: Health Care | |
| SubSector: Hospitals | |
| MarketCap: 7217.66 Millions | |
| Recent Price: 169.89 Smart Investing & Trading Score: 76 | |
| Day Percent Change: -0.18% Day Change: -0.30 | |
| Week Change: 2.31% Year-to-date Change: 11.5% | |
| UHS Links: Profile News Message Board | |
| Charts:- Daily , Weekly | |
| Add UHS to Watchlist: View: Get Complete UHS Trend Analysis ➞ | |
 | ZURA Zura Bio Limited |
| Sector: Health Care | |
| SubSector: Biotechnology | |
| MarketCap: 242 Millions | |
| Recent Price: 4.34 Smart Investing & Trading Score: 75 | |
| Day Percent Change: 5.08% Day Change: 0.21 | |
| Week Change: -1.59% Year-to-date Change: -7.4% | |
| ZURA Links: Profile News Message Board | |
| Charts:- Daily , Weekly | |
| Add ZURA to Watchlist: View: Get Complete ZURA Trend Analysis ➞ | |
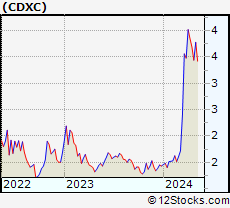 | CDXC ChromaDex Corporation |
| Sector: Health Care | |
| SubSector: Biotechnology | |
| MarketCap: 181.585 Millions | |
| Recent Price: 3.76 Smart Investing & Trading Score: 75 | |
| Day Percent Change: 2.73% Day Change: 0.10 | |
| Week Change: 9.3% Year-to-date Change: 162.9% | |
| CDXC Links: Profile News Message Board | |
| Charts:- Daily , Weekly | |
| Add CDXC to Watchlist: View: Get Complete CDXC Trend Analysis ➞ | |
| For tabular summary view of above stock list: Summary View ➞ 0 - 25 , 25 - 50 , 50 - 75 , 75 - 100 , 100 - 125 , 125 - 150 , 150 - 175 , 175 - 200 , 200 - 225 , 225 - 250 , 250 - 275 , 275 - 300 , 300 - 325 , 325 - 350 , 350 - 375 , 375 - 400 , 400 - 425 , 425 - 450 , 450 - 475 , 475 - 500 , 500 - 525 , 525 - 550 , 550 - 575 , 575 - 600 , 600 - 625 , 625 - 650 , 650 - 675 , 675 - 700 , 700 - 725 | ||
| Click To Change The Sort Order: By Market Cap or Company Size Performance: Year-to-date, Week and Day | |
| Select Chart Type: | ||
|
Best Stocks Today 12Stocks.com |
© 2024 12Stocks.com Terms & Conditions Privacy Contact Us
All Information Provided Only For Education And Not To Be Used For Investing or Trading. See Terms & Conditions


One More Thing ... Get Best Stocks Delivered Daily!
Never Ever Miss A Move With Our Top Ten Stocks Lists
Find Best Stocks In Any Market - Bull or Bear Market
Take A Peek At Our Top Ten Stocks Lists: Daily, Weekly, Year-to-Date & Top Trends
Find Best Stocks In Any Market - Bull or Bear Market
Take A Peek At Our Top Ten Stocks Lists: Daily, Weekly, Year-to-Date & Top Trends
Healthcare Stocks With Best Up Trends [0-bearish to 100-bullish]: Emergent Bio[100], Lantheus [100], Blueprint Medicines[100], Moderna [100], Veru [100], Palatin Technologies[100], Avid Bioservices[100], Glaukos [100], Rockwell [100], TransMedics [100], Repro Med[100]
Best Healthcare Stocks Year-to-Date:
Pieris [6075.82%], Precision BioSciences[2869.86%], Avenue [2850.31%], Inovio [2254.9%], Assembly Biosciences[1462%], Agenus [1412.26%], Aurora Cannabis[1363.67%], NuCana [1240.43%], Adverum Biotechnologies[1228.37%], Affimed N.V[748%], CareMax [674.23%] Best Healthcare Stocks This Week:
CytomX [183.02%], GeneDx [75.99%], Deciphera [73.24%], Emergent Bio[71.88%], P3 Health[38.51%], Cue Biopharma[37.73%], TransMedics [35.14%], Seres [34.55%], Surmodics [32.02%], Phibro Animal[31.66%], Poseida [30.99%] Best Healthcare Stocks Daily:
Emergent Bio[70.98%], Regencell Bioscience[23.15%], Pulmonx [21.50%], Orchestra BioMed[18.83%], Cellectis S.A[17.90%], Ocular Therapeutix[16.93%], Lantheus [16.01%], Butterfly Network[13.09%], Blueprint Medicines[12.80%], Moderna [12.68%], Mustang Bio[12.65%]