
 Login Sign Up


| |||||
 |  | ||||

| 12Stocks.com Market Intelligence |
Best Consumer Services Stocks
| In a hurry? Services & Goods Stocks: Performance Trends Table, Stock Charts
Sort Consumer Services: Daily, Weekly, Year-to-Date, Market Cap & Trends. Filter Services & Goods stocks list by size: All Large Mid-Range Small |
| 12Stocks.com Consumer Services Stocks Performances & Trends Daily | |||||||||
|
|  The overall Smart Investing & Trading Score is 68 (0-bearish to 100-bullish) which puts Consumer Services sector in short term neutral to bullish trend. The Smart Investing & Trading Score from previous trading session is 51 and hence an improvement of trend.
| ||||||||
Here are the Smart Investing & Trading Scores of the most requested Consumer Services stocks at 12Stocks.com (click stock name for detailed review):
|


| Consider signing up for our daily 12Stocks.com "Best Stocks Newsletter". You will never ever miss a big stock move again! |
| 12Stocks.com: Investing in Consumer Services sector with Stocks | |
|
The following table helps investors and traders sort through current performance and trends (as measured by Smart Investing & Trading Score) of various
stocks in the Consumer Services sector. Quick View: Move mouse or cursor over stock symbol (ticker) to view short-term Technical chart and over stock name to view long term chart. Click on  to add stock symbol to your watchlist and to add stock symbol to your watchlist and  to view watchlist. Click on any ticker or stock name for detailed market intelligence report for that stock. to view watchlist. Click on any ticker or stock name for detailed market intelligence report for that stock. |
12Stocks.com Performance of Stocks in Consumer Services Sector
| Ticker | Stock Name | Watchlist | Category | Recent Price | Smart Investing & Trading Score | Change % | YTD Change% |
| SBH | Sally Beauty |   | Retail | 11.00 | 54 | 1.20% | -17.17% |
| CNK | Cinemark | | Entertainment | 17.65 | 53 | 0.97% | 25.27% |
| BJ | BJ s | | Retail | 76.65 | 53 | 0.35% | 14.99% |
| TGT | Target | | Retail | 164.74 | 53 | 0.18% | 15.67% |
| WSM | Williams-Sonoma | | Retail | 282.16 | 53 | 0.17% | 39.84% |
| NL | NL Industries | | Equipment | 7.81 | 53 | -1.14% | 39.22% |
| VALU | Value Line | | Publishing | 36.35 | 53 | 0.69% | -25.44% |
| HSAI | Hesai | | Auto Parts | 4.40 | 52 | 5.52% | -51.54% |
| IHRT | iHeartMedia | | Broadcasting | 2.14 | 52 | 2.39% | -19.85% |
| GGR | Gogoro | | Auto Parts | 1.53 | 52 | 2.00% | -41.15% |
| PLNT | Planet Fitness | | Sporting | 60.27 | 52 | 0.65% | -17.44% |
| TRU | TransUnion | | Services | 74.49 | 52 | 0.27% | 8.41% |
| CBRL | Cracker Barrel | | Restaurants | 59.32 | 52 | -2.26% | -23.04% |
| MMS | MAXIMUS | | Services | 80.43 | 52 | -0.25% | -4.09% |
| EXPE | Expedia | | Lodging | 135.70 | 52 | -0.40% | -10.60% |
| AIT | Applied Industrial | | Equipment | 180.89 | 51 | 1.09% | 4.75% |
| ICFI | ICF | | Services | 141.89 | 51 | 0.60% | 5.82% |
| LYV | Live Nation | | Entertainment | 89.83 | 51 | 1.51% | -4.03% |
| KRT | Karat Packaging | | Packaging | 27.24 | 51 | 0.67% | 9.35% |
| CTAS | Cintas | | Services | 666.23 | 51 | 0.15% | 10.55% |
| AZO | AutoZone | | Auto Parts | 2945.98 | 51 | 0.02% | 13.94% |
| BBY | Best Buy | | Retail | 75.05 | 51 | -0.25% | -4.13% |
| NGVC | Natural Grocers | | Grocery | 16.88 | 50 | 2.99% | 5.50% |
| EDR | Endeavor | | Entertainment | 26.50 | 50 | 0.26% | 11.67% |
| TLYS | Tilly s | | Apparel | 6.01 | 49 | 2.21% | -20.29% |
| For chart view version of above stock list: Chart View ➞ 0 - 25 , 25 - 50 , 50 - 75 , 75 - 100 , 100 - 125 , 125 - 150 , 150 - 175 , 175 - 200 , 200 - 225 , 225 - 250 , 250 - 275 , 275 - 300 , 300 - 325 , 325 - 350 , 350 - 375 , 375 - 400 , 400 - 425 , 425 - 450 , 450 - 475 | ||
 | Click To Change The Sort Order: By Market Cap or Company Size Performance: Year-to-date, Week and Day |  |
|
Get the most comprehensive stock market coverage daily at 12Stocks.com ➞ Best Stocks Today ➞ Best Stocks Weekly ➞ Best Stocks Year-to-Date ➞ Best Stocks Trends ➞  Best Stocks Today 12Stocks.com Best Nasdaq Stocks ➞ Best S&P 500 Stocks ➞ Best Tech Stocks ➞ Best Biotech Stocks ➞ |
| Detailed Overview of Consumer Services Stocks |
| Consumer Services Technical Overview, Leaders & Laggards, Top Consumer Services ETF Funds & Detailed Consumer Services Stocks List, Charts, Trends & More |
| Consumer Services Sector: Technical Analysis, Trends & YTD Performance | |
| Consumer Services sector is composed of stocks
from retail, entertainment, media/publishing, consumer goods
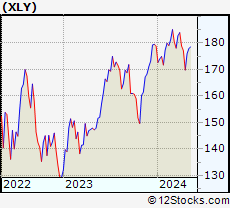
and services subsectors. Consumer Services sector, as represented by XLY, an exchange-traded fund [ETF] that holds basket of Consumer Services stocks (e.g, Walmart, Alibaba) is down by -1.62% and is currently underperforming the overall market by -7.76% year-to-date. Below is a quick view of Technical charts and trends: |
|
 XLY Weekly Chart |
|
| Long Term Trend: Good | |
| Medium Term Trend: Not Good | |
 XLY Daily Chart |
|
| Short Term Trend: Very Good | |
| Overall Trend Score: 68 | |
| YTD Performance: -1.62% | |
| **Trend Scores & Views Are Only For Educational Purposes And Not For Investing | |
| 12Stocks.com: Top Performing Consumer Services Sector Stocks | ||||||||||||||||||||||||||||||||||||||||||||||||
 The top performing Consumer Services sector stocks year to date are
Now, more recently, over last week, the top performing Consumer Services sector stocks on the move are


|
||||||||||||||||||||||||||||||||||||||||||||||||
| 12Stocks.com: Investing in Consumer Services Sector using Exchange Traded Funds | |
|
The following table shows list of key exchange traded funds (ETF) that
help investors track Consumer Services Index. For detailed view, check out our ETF Funds section of our website. Quick View: Move mouse or cursor over ETF symbol (ticker) to view short-term Technical chart and over ETF name to view long term chart. Click on ticker or stock name for detailed view. Click on to add stock symbol to your watchlist and to view watchlist. |
12Stocks.com List of ETFs that track Consumer Services Index
| Ticker | ETF Name | Watchlist | Recent Price | Smart Investing & Trading Score | Change % | Week % | Year-to-date % |
| XLY | Consumer Discret Sel | | 175.91 | 68 | 0.90 | 3.62 | -1.62% |
| RTH | Retail | | 201.08 | 56 | 1.22 | 1.23 | 6.83% |
| IYC | Consumer Services | | 78.36 | 43 | 0.63 | 2.74 | 3.42% |
| XRT | Retail | | 73.22 | 63 | 1.40 | 2.88 | 1.24% |
| IYK | Consumer Goods | | 66.76 | 68 | -0.33 | 1.44 | 4.47% |
| UCC | Consumer Services | | 34.16 | 80 | 2.74 | 8.19 | -4.87% |
| RETL | Retail Bull 3X | | 8.83 | 55 | 4.25 | 8.74 | -3.18% |
| RXI | Globl Consumer Discretionary | | 161.18 | 43 | 1.26 | 2.56 | 1.33% |
| SCC | Short Consumer Services | | 15.78 | 35 | -1.74 | -6.92 | 2.98% |
| UGE | Consumer Goods | | 17.17 | 90 | 0.29 | 3.26 | 9.08% |
| 12Stocks.com: Charts, Trends, Fundamental Data and Performances of Consumer Services Stocks | |
|
We now take in-depth look at all Consumer Services stocks including charts, multi-period performances and overall trends (as measured by Smart Investing & Trading Score). One can sort Consumer Services stocks (click link to choose) by Daily, Weekly and by Year-to-Date performances. Also, one can sort by size of the company or by market capitalization. |
| Select Your Default Chart Type: | |||||
| |||||
| Click on stock symbol or name for detailed view. Click on to add stock symbol to your watchlist and to view watchlist. Quick View: Move mouse or cursor over "Daily" to quickly view daily Technical stock chart and over "Weekly" to view weekly Technical stock chart. | |||||

 | SBH Sally Beauty Holdings, Inc. |
| Sector: Services & Goods | |
| SubSector: Specialty Retail, Other | |
| MarketCap: 1229.44 Millions | |
| Recent Price: 11.00 Smart Investing & Trading Score: 54 | |
| Day Percent Change: 1.20% Day Change: 0.13 | |
| Week Change: 3.77% Year-to-date Change: -17.2% | |
| SBH Links: Profile News Message Board | |
| Charts:- Daily , Weekly | |
| Add SBH to Watchlist: View: Get Complete SBH Trend Analysis ➞ | |
 | CNK Cinemark Holdings, Inc. |
| Sector: Services & Goods | |
| SubSector: Movie Production, Theaters | |
| MarketCap: 1776.29 Millions | |
| Recent Price: 17.65 Smart Investing & Trading Score: 53 | |
| Day Percent Change: 0.97% Day Change: 0.17 | |
| Week Change: -3.13% Year-to-date Change: 25.3% | |
| CNK Links: Profile News Message Board | |
| Charts:- Daily , Weekly | |
| Add CNK to Watchlist: View: Get Complete CNK Trend Analysis ➞ | |
 | BJ BJ s Wholesale Club Holdings, Inc. |
| Sector: Services & Goods | |
| SubSector: Discount, Variety Stores | |
| MarketCap: 3346.02 Millions | |
| Recent Price: 76.65 Smart Investing & Trading Score: 53 | |
| Day Percent Change: 0.35% Day Change: 0.27 | |
| Week Change: 3.95% Year-to-date Change: 15.0% | |
| BJ Links: Profile News Message Board | |
| Charts:- Daily , Weekly | |
| Add BJ to Watchlist: View: Get Complete BJ Trend Analysis ➞ | |
 | TGT Target Corporation |
| Sector: Services & Goods | |
| SubSector: Discount, Variety Stores | |
| MarketCap: 55980.6 Millions | |
| Recent Price: 164.74 Smart Investing & Trading Score: 53 | |
| Day Percent Change: 0.18% Day Change: 0.30 | |
| Week Change: -2.12% Year-to-date Change: 15.7% | |
| TGT Links: Profile News Message Board | |
| Charts:- Daily , Weekly | |
| Add TGT to Watchlist: View: Get Complete TGT Trend Analysis ➞ | |
 | WSM Williams-Sonoma, Inc. |
| Sector: Services & Goods | |
| SubSector: Home Furnishing Stores | |
| MarketCap: 3370.05 Millions | |
| Recent Price: 282.16 Smart Investing & Trading Score: 53 | |
| Day Percent Change: 0.17% Day Change: 0.48 | |
| Week Change: 1.06% Year-to-date Change: 39.8% | |
| WSM Links: Profile News Message Board | |
| Charts:- Daily , Weekly | |
| Add WSM to Watchlist: View: Get Complete WSM Trend Analysis ➞ | |
 | NL NL Industries, Inc. |
| Sector: Services & Goods | |
| SubSector: Industrial Equipment Wholesale | |
| MarketCap: 126.258 Millions | |
| Recent Price: 7.81 Smart Investing & Trading Score: 53 | |
| Day Percent Change: -1.14% Day Change: -0.09 | |
| Week Change: 0% Year-to-date Change: 39.2% | |
| NL Links: Profile News Message Board | |
| Charts:- Daily , Weekly | |
| Add NL to Watchlist: View: Get Complete NL Trend Analysis ➞ | |
 | VALU Value Line, Inc. |
| Sector: Services & Goods | |
| SubSector: Publishing - Periodicals | |
| MarketCap: 254.3 Millions | |
| Recent Price: 36.35 Smart Investing & Trading Score: 53 | |
| Day Percent Change: 0.69% Day Change: 0.25 | |
| Week Change: -2.73% Year-to-date Change: -25.4% | |
| VALU Links: Profile News Message Board | |
| Charts:- Daily , Weekly | |
| Add VALU to Watchlist: View: Get Complete VALU Trend Analysis ➞ | |
 | HSAI Hesai Group |
| Sector: Services & Goods | |
| SubSector: Auto Parts | |
| MarketCap: 1330 Millions | |
| Recent Price: 4.40 Smart Investing & Trading Score: 52 | |
| Day Percent Change: 5.52% Day Change: 0.23 | |
| Week Change: 10.83% Year-to-date Change: -51.5% | |
| HSAI Links: Profile News Message Board | |
| Charts:- Daily , Weekly | |
| Add HSAI to Watchlist: View: Get Complete HSAI Trend Analysis ➞ | |
 | IHRT iHeartMedia, Inc. |
| Sector: Services & Goods | |
| SubSector: Broadcasting - Radio | |
| MarketCap: 694 Millions | |
| Recent Price: 2.14 Smart Investing & Trading Score: 52 | |
| Day Percent Change: 2.39% Day Change: 0.05 | |
| Week Change: 12.63% Year-to-date Change: -19.9% | |
| IHRT Links: Profile News Message Board | |
| Charts:- Daily , Weekly | |
| Add IHRT to Watchlist: View: Get Complete IHRT Trend Analysis ➞ | |
 | GGR Gogoro Inc. |
| Sector: Services & Goods | |
| SubSector: Auto Parts | |
| MarketCap: 856 Millions | |
| Recent Price: 1.53 Smart Investing & Trading Score: 52 | |
| Day Percent Change: 2.00% Day Change: 0.03 | |
| Week Change: 8.51% Year-to-date Change: -41.2% | |
| GGR Links: Profile News Message Board | |
| Charts:- Daily , Weekly | |
| Add GGR to Watchlist: View: Get Complete GGR Trend Analysis ➞ | |
 | PLNT Planet Fitness, Inc. |
| Sector: Services & Goods | |
| SubSector: Sporting Activities | |
| MarketCap: 3485.94 Millions | |
| Recent Price: 60.27 Smart Investing & Trading Score: 52 | |
| Day Percent Change: 0.65% Day Change: 0.39 | |
| Week Change: 2.71% Year-to-date Change: -17.4% | |
| PLNT Links: Profile News Message Board | |
| Charts:- Daily , Weekly | |
| Add PLNT to Watchlist: View: Get Complete PLNT Trend Analysis ➞ | |
 | TRU TransUnion |
| Sector: Services & Goods | |
| SubSector: Business Services | |
| MarketCap: 11457.2 Millions | |
| Recent Price: 74.49 Smart Investing & Trading Score: 52 | |
| Day Percent Change: 0.27% Day Change: 0.20 | |
| Week Change: 11.68% Year-to-date Change: 8.4% | |
| TRU Links: Profile News Message Board | |
| Charts:- Daily , Weekly | |
| Add TRU to Watchlist: View: Get Complete TRU Trend Analysis ➞ | |
 | CBRL Cracker Barrel Old Country Store, Inc. |
| Sector: Services & Goods | |
| SubSector: Restaurants | |
| MarketCap: 1839.6 Millions | |
| Recent Price: 59.32 Smart Investing & Trading Score: 52 | |
| Day Percent Change: -2.26% Day Change: -1.37 | |
| Week Change: 1.06% Year-to-date Change: -23.0% | |
| CBRL Links: Profile News Message Board | |
| Charts:- Daily , Weekly | |
| Add CBRL to Watchlist: View: Get Complete CBRL Trend Analysis ➞ | |
 | MMS MAXIMUS, Inc. |
| Sector: Services & Goods | |
| SubSector: Business Services | |
| MarketCap: 3833.02 Millions | |
| Recent Price: 80.43 Smart Investing & Trading Score: 52 | |
| Day Percent Change: -0.25% Day Change: -0.20 | |
| Week Change: -1.24% Year-to-date Change: -4.1% | |
| MMS Links: Profile News Message Board | |
| Charts:- Daily , Weekly | |
| Add MMS to Watchlist: View: Get Complete MMS Trend Analysis ➞ | |
 | EXPE Expedia Group, Inc. |
| Sector: Services & Goods | |
| SubSector: Lodging | |
| MarketCap: 8052.96 Millions | |
| Recent Price: 135.70 Smart Investing & Trading Score: 52 | |
| Day Percent Change: -0.40% Day Change: -0.55 | |
| Week Change: 5.19% Year-to-date Change: -10.6% | |
| EXPE Links: Profile News Message Board | |
| Charts:- Daily , Weekly | |
| Add EXPE to Watchlist: View: Get Complete EXPE Trend Analysis ➞ | |
 | AIT Applied Industrial Technologies, Inc. |
| Sector: Services & Goods | |
| SubSector: Industrial Equipment Wholesale | |
| MarketCap: 1531.58 Millions | |
| Recent Price: 180.89 Smart Investing & Trading Score: 51 | |
| Day Percent Change: 1.09% Day Change: 1.95 | |
| Week Change: -1.4% Year-to-date Change: 4.8% | |
| AIT Links: Profile News Message Board | |
| Charts:- Daily , Weekly | |
| Add AIT to Watchlist: View: Get Complete AIT Trend Analysis ➞ | |
 | ICFI ICF International, Inc. |
| Sector: Services & Goods | |
| SubSector: Management Services | |
| MarketCap: 1218.75 Millions | |
| Recent Price: 141.89 Smart Investing & Trading Score: 51 | |
| Day Percent Change: 0.60% Day Change: 0.84 | |
| Week Change: 1.15% Year-to-date Change: 5.8% | |
| ICFI Links: Profile News Message Board | |
| Charts:- Daily , Weekly | |
| Add ICFI to Watchlist: View: Get Complete ICFI Trend Analysis ➞ | |
 | LYV Live Nation Entertainment, Inc. |
| Sector: Services & Goods | |
| SubSector: Entertainment - Diversified | |
| MarketCap: 8457.17 Millions | |
| Recent Price: 89.83 Smart Investing & Trading Score: 51 | |
| Day Percent Change: 1.51% Day Change: 1.34 | |
| Week Change: -0.14% Year-to-date Change: -4.0% | |
| LYV Links: Profile News Message Board | |
| Charts:- Daily , Weekly | |
| Add LYV to Watchlist: View: Get Complete LYV Trend Analysis ➞ | |
 | KRT Karat Packaging Inc. |
| Sector: Services & Goods | |
| SubSector: Packaging & Containers | |
| MarketCap: 357 Millions | |
| Recent Price: 27.24 Smart Investing & Trading Score: 51 | |
| Day Percent Change: 0.67% Day Change: 0.18 | |
| Week Change: 1.53% Year-to-date Change: 9.4% | |
| KRT Links: Profile News Message Board | |
| Charts:- Daily , Weekly | |
| Add KRT to Watchlist: View: Get Complete KRT Trend Analysis ➞ | |
 | CTAS Cintas Corporation |
| Sector: Services & Goods | |
| SubSector: Business Services | |
| MarketCap: 20154.6 Millions | |
| Recent Price: 666.23 Smart Investing & Trading Score: 51 | |
| Day Percent Change: 0.15% Day Change: 0.98 | |
| Week Change: 0.75% Year-to-date Change: 10.6% | |
| CTAS Links: Profile News Message Board | |
| Charts:- Daily , Weekly | |
| Add CTAS to Watchlist: View: Get Complete CTAS Trend Analysis ➞ | |
 | AZO AutoZone, Inc. |
| Sector: Services & Goods | |
| SubSector: Auto Parts Stores | |
| MarketCap: 19128 Millions | |
| Recent Price: 2945.98 Smart Investing & Trading Score: 51 | |
| Day Percent Change: 0.02% Day Change: 0.73 | |
| Week Change: -1.33% Year-to-date Change: 13.9% | |
| AZO Links: Profile News Message Board | |
| Charts:- Daily , Weekly | |
| Add AZO to Watchlist: View: Get Complete AZO Trend Analysis ➞ | |
 | BBY Best Buy Co., Inc. |
| Sector: Services & Goods | |
| SubSector: Electronics Stores | |
| MarketCap: 15771.3 Millions | |
| Recent Price: 75.05 Smart Investing & Trading Score: 51 | |
| Day Percent Change: -0.25% Day Change: -0.19 | |
| Week Change: -1.44% Year-to-date Change: -4.1% | |
| BBY Links: Profile News Message Board | |
| Charts:- Daily , Weekly | |
| Add BBY to Watchlist: View: Get Complete BBY Trend Analysis ➞ | |
 | NGVC Natural Grocers by Vitamin Cottage, Inc. |
| Sector: Services & Goods | |
| SubSector: Grocery Stores | |
| MarketCap: 185.475 Millions | |
| Recent Price: 16.88 Smart Investing & Trading Score: 50 | |
| Day Percent Change: 2.99% Day Change: 0.49 | |
| Week Change: 2.43% Year-to-date Change: 5.5% | |
| NGVC Links: Profile News Message Board | |
| Charts:- Daily , Weekly | |
| Add NGVC to Watchlist: View: Get Complete NGVC Trend Analysis ➞ | |
 | EDR Endeavor Group Holdings, Inc. |
| Sector: Services & Goods | |
| SubSector: Entertainment | |
| MarketCap: 11310 Millions | |
| Recent Price: 26.50 Smart Investing & Trading Score: 50 | |
| Day Percent Change: 0.26% Day Change: 0.07 | |
| Week Change: 0% Year-to-date Change: 11.7% | |
| EDR Links: Profile News Message Board | |
| Charts:- Daily , Weekly | |
| Add EDR to Watchlist: View: Get Complete EDR Trend Analysis ➞ | |
 | TLYS Tilly s, Inc. |
| Sector: Services & Goods | |
| SubSector: Apparel Stores | |
| MarketCap: 127.408 Millions | |
| Recent Price: 6.01 Smart Investing & Trading Score: 49 | |
| Day Percent Change: 2.21% Day Change: 0.13 | |
| Week Change: 4.52% Year-to-date Change: -20.3% | |
| TLYS Links: Profile News Message Board | |
| Charts:- Daily , Weekly | |
| Add TLYS to Watchlist: View: Get Complete TLYS Trend Analysis ➞ | |
| For tabular summary view of above stock list: Summary View ➞ 0 - 25 , 25 - 50 , 50 - 75 , 75 - 100 , 100 - 125 , 125 - 150 , 150 - 175 , 175 - 200 , 200 - 225 , 225 - 250 , 250 - 275 , 275 - 300 , 300 - 325 , 325 - 350 , 350 - 375 , 375 - 400 , 400 - 425 , 425 - 450 , 450 - 475 | ||
| Click To Change The Sort Order: By Market Cap or Company Size Performance: Year-to-date, Week and Day | |
| Select Chart Type: | ||
|
Best Stocks Today 12Stocks.com |
© 2024 12Stocks.com Terms & Conditions Privacy Contact Us
All Information Provided Only For Education And Not To Be Used For Investing or Trading. See Terms & Conditions


One More Thing ... Get Best Stocks Delivered Daily!
Never Ever Miss A Move With Our Top Ten Stocks Lists
Find Best Stocks In Any Market - Bull or Bear Market
Take A Peek At Our Top Ten Stocks Lists: Daily, Weekly, Year-to-Date & Top Trends
Find Best Stocks In Any Market - Bull or Bear Market
Take A Peek At Our Top Ten Stocks Lists: Daily, Weekly, Year-to-Date & Top Trends
Consumer Services Stocks With Best Up Trends [0-bearish to 100-bullish]: CAVA [100], Yatsen Holding[100], MINISO [100], Reservoir Media[100], AutoNation [100], Pactiv Evergreen[100], Tractor Supply[100], Chipotle Mexican[100], Dada Nexus[100], Cheesecake Factory[100], Brinker [100]
Best Consumer Services Stocks Year-to-Date:
U Power[2779.46%], Vroom [1804.53%], Yatsen Holding[558.83%], Fluent [337.31%], Codere Online[130.82%], Sweetgreen [116.99%], Research[106.23%], RealReal [78.61%], Carvana Co[59.26%], CAVA [59.06%], PaySign [57.5%] Best Consumer Services Stocks This Week:
Chicken Soup[187.5%], Yatsen Holding[33.33%], Sonic Automotive[28.14%], ATRenew [25.32%], Strategic Education[23.39%], Hibbett Sports[21.1%], Exponent [20.26%], Altisource Portfolio[19.39%], Golden Heaven[19.11%], Qurate Retail[18.83%], Sweetgreen [18.74%] Best Consumer Services Stocks Daily:
ATRenew [22.98%], Exponent [19.49%], XPeng [12.38%], CAVA [10.50%], Sonic Automotive[9.93%], Fluent [9.74%], Yatsen Holding[9.30%], Kratos Defense[9.11%], WW [9.03%], Carvana Co[8.79%], Qurate Retail[8.74%]