
 Login Sign Up


| |||||
 |  | ||||

| 12Stocks.com Market Intelligence |
Best Consumer Services Stocks
| In a hurry? Services & Goods Stocks: Performance Trends Table, Stock Charts
Sort Consumer Services: Daily, Weekly, Year-to-Date, Market Cap & Trends. Filter Services & Goods stocks list by size: All Large Mid-Range Small |
| 12Stocks.com Consumer Services Stocks Performances & Trends Daily | |||||||||
|
|  The overall Smart Investing & Trading Score is 31 (0-bearish to 100-bullish) which puts Consumer Services sector in short term bearish to neutral trend. The Smart Investing & Trading Score from previous trading session is 58 and hence a deterioration of trend.
| ||||||||
Here are the Smart Investing & Trading Scores of the most requested Consumer Services stocks at 12Stocks.com (click stock name for detailed review):
|


| Consider signing up for our daily 12Stocks.com "Best Stocks Newsletter". You will never ever miss a big stock move again! |
| 12Stocks.com: Investing in Consumer Services sector with Stocks | |
|
The following table helps investors and traders sort through current performance and trends (as measured by Smart Investing & Trading Score) of various
stocks in the Consumer Services sector. Quick View: Move mouse or cursor over stock symbol (ticker) to view short-term Technical chart and over stock name to view long term chart. Click on  to add stock symbol to your watchlist and to add stock symbol to your watchlist and  to view watchlist. Click on any ticker or stock name for detailed market intelligence report for that stock. to view watchlist. Click on any ticker or stock name for detailed market intelligence report for that stock. |
12Stocks.com Performance of Stocks in Consumer Services Sector
| Ticker | Stock Name | Watchlist | Category | Recent Price | Smart Investing & Trading Score | Change % | YTD Change% |
| VSEC | VSE |   | Services | 76.67 | 69 | -2.47% | 18.67% |
| DPZ | Domino s | | Restaurants | 491.52 | 68 | 0.78% | 19.24% |
| APEI | American Public | | Education | 13.30 | 68 | 0.61% | 37.82% |
| TTEK | Tetra Tech | | Services | 190.31 | 68 | 0.54% | 14.01% |
| SEAT | Vivid Seats | | Internet Content & Information | 5.81 | 68 | 0.17% | -6.89% |
| RVLV | Revolve | | Retail | 19.14 | 68 | -3.36% | 15.41% |
| PRAA | PRA | | Services | 24.05 | 68 | -2.99% | -8.21% |
| EEFT | Euronet Worldwide | | Services | 102.99 | 68 | -2.54% | 1.47% |
| LTH | Life Time | | Leisure | 14.31 | 68 | -1.99% | -5.54% |
| DJCO | Daily Journal | | Publishing | 347.05 | 68 | -1.69% | 1.83% |
| KFY | Korn Ferry | | Staffing | 61.64 | 68 | -1.61% | 3.86% |
| URBN | Urban Outfitters | | Apparel | 38.79 | 68 | -1.02% | 8.69% |
| ACTG | Acacia Research | | Services | 4.94 | 68 | -0.80% | 26.02% |
| HGV | Hilton Grand | | Casinos | 44.43 | 68 | -0.80% | 10.58% |
| FLNT | Fluent | | Marketing | 2.67 | 68 | -0.74% | 298.51% |
| DBI | Designer Brands | | Apparel | 9.38 | 68 | -0.69% | 5.93% |
| CPNG | Coupang | | Internet Retail | 22.41 | 68 | -0.24% | 38.30% |
| DHX | DHI | | Staffing | 2.49 | 68 | 0.40% | -3.86% |
| SBGI | Slair Broadcast | | Broadcasting | 12.39 | 67 | -2.75% | -4.91% |
| QGEN | QIAGEN N.V | | Research | 40.69 | 67 | -2.00% | -6.31% |
| HVT | Haverty Furniture | | Retail | 31.95 | 67 | -1.84% | -10.00% |
| NSP | Insperity | | Services | 107.69 | 67 | -1.68% | -8.13% |
| EXPO | Exponent | | Services | 79.94 | 67 | -0.82% | -9.20% |
| HSIC | Henry Schein | | Medical | 72.61 | 67 | -0.81% | -4.09% |
| DIN | Dine Brands | | Restaurants | 45.15 | 67 | -0.31% | -9.06% |
| For chart view version of above stock list: Chart View ➞ 0 - 25 , 25 - 50 , 50 - 75 , 75 - 100 , 100 - 125 , 125 - 150 , 150 - 175 , 175 - 200 , 200 - 225 , 225 - 250 , 250 - 275 , 275 - 300 , 300 - 325 , 325 - 350 , 350 - 375 , 375 - 400 , 400 - 425 , 425 - 450 , 450 - 475 | ||
 | Click To Change The Sort Order: By Market Cap or Company Size Performance: Year-to-date, Week and Day |  |
|
Get the most comprehensive stock market coverage daily at 12Stocks.com ➞ Best Stocks Today ➞ Best Stocks Weekly ➞ Best Stocks Year-to-Date ➞ Best Stocks Trends ➞  Best Stocks Today 12Stocks.com Best Nasdaq Stocks ➞ Best S&P 500 Stocks ➞ Best Tech Stocks ➞ Best Biotech Stocks ➞ |
| Detailed Overview of Consumer Services Stocks |
| Consumer Services Technical Overview, Leaders & Laggards, Top Consumer Services ETF Funds & Detailed Consumer Services Stocks List, Charts, Trends & More |
| Consumer Services Sector: Technical Analysis, Trends & YTD Performance | |
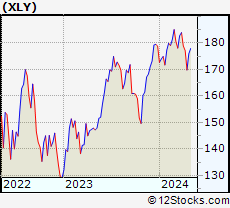
| Consumer Services sector is composed of stocks
from retail, entertainment, media/publishing, consumer goods
and services subsectors. Consumer Services sector, as represented by XLY, an exchange-traded fund [ETF] that holds basket of Consumer Services stocks (e.g, Walmart, Alibaba) is down by -3.54% and is currently underperforming the overall market by -7.79% year-to-date. Below is a quick view of Technical charts and trends: |
|
 XLY Weekly Chart |
|
| Long Term Trend: Good | |
| Medium Term Trend: Not Good | |
 XLY Daily Chart |
|
| Short Term Trend: Very Good | |
| Overall Trend Score: 31 | |
| YTD Performance: -3.54% | |
| **Trend Scores & Views Are Only For Educational Purposes And Not For Investing | |
| 12Stocks.com: Top Performing Consumer Services Sector Stocks | ||||||||||||||||||||||||||||||||||||||||||||||||
 The top performing Consumer Services sector stocks year to date are
Now, more recently, over last week, the top performing Consumer Services sector stocks on the move are


|
||||||||||||||||||||||||||||||||||||||||||||||||
| 12Stocks.com: Investing in Consumer Services Sector using Exchange Traded Funds | |
|
The following table shows list of key exchange traded funds (ETF) that
help investors track Consumer Services Index. For detailed view, check out our ETF Funds section of our website. Quick View: Move mouse or cursor over ETF symbol (ticker) to view short-term Technical chart and over ETF name to view long term chart. Click on ticker or stock name for detailed view. Click on to add stock symbol to your watchlist and to view watchlist. |
12Stocks.com List of ETFs that track Consumer Services Index
| Ticker | ETF Name | Watchlist | Recent Price | Smart Investing & Trading Score | Change % | Week % | Year-to-date % |
| XLY | Consumer Discret Sel | | 172.48 | 31 | -0.98 | 1.6 | -3.54% |
| RTH | Retail | | 199.62 | 44 | -0.09 | 0.5 | 6.05% |
| XRT | Retail | | 71.57 | 51 | -1.31 | 0.56 | -1.04% |
| UCC | Consumer Services | | 33.25 | 66 | -0.36 | 5.3 | -7.4% |
| RXI | Globl Consumer Discretionary | | 158.03 | 36 | -1.41 | 0.56 | -0.65% |
| SCC | Short Consumer Services | | 16.55 | 42 | 2.67 | -2.38 | 8% |
| UGE | Consumer Goods | | 17.31 | 90 | 0.41 | 4.11 | 9.97% |
| 12Stocks.com: Charts, Trends, Fundamental Data and Performances of Consumer Services Stocks | |
|
We now take in-depth look at all Consumer Services stocks including charts, multi-period performances and overall trends (as measured by Smart Investing & Trading Score). One can sort Consumer Services stocks (click link to choose) by Daily, Weekly and by Year-to-Date performances. Also, one can sort by size of the company or by market capitalization. |
| Select Your Default Chart Type: | |||||
| |||||
| Click on stock symbol or name for detailed view. Click on to add stock symbol to your watchlist and to view watchlist. Quick View: Move mouse or cursor over "Daily" to quickly view daily Technical stock chart and over "Weekly" to view weekly Technical stock chart. | |||||

 | VSEC VSE Corporation |
| Sector: Services & Goods | |
| SubSector: Technical Services | |
| MarketCap: 183.61 Millions | |
| Recent Price: 76.67 Smart Investing & Trading Score: 69 | |
| Day Percent Change: -2.47% Day Change: -1.94 | |
| Week Change: 1.31% Year-to-date Change: 18.7% | |
| VSEC Links: Profile News Message Board | |
| Charts:- Daily , Weekly | |
| Add VSEC to Watchlist: View: Get Complete VSEC Trend Analysis ➞ | |
 | DPZ Domino s Pizza, Inc. |
| Sector: Services & Goods | |
| SubSector: Restaurants | |
| MarketCap: 12166 Millions | |
| Recent Price: 491.52 Smart Investing & Trading Score: 68 | |
| Day Percent Change: 0.78% Day Change: 3.81 | |
| Week Change: 3.8% Year-to-date Change: 19.2% | |
| DPZ Links: Profile News Message Board | |
| Charts:- Daily , Weekly | |
| Add DPZ to Watchlist: View: Get Complete DPZ Trend Analysis ➞ | |
 | APEI American Public Education, Inc. |
| Sector: Services & Goods | |
| SubSector: Education & Training Services | |
| MarketCap: 361.306 Millions | |
| Recent Price: 13.30 Smart Investing & Trading Score: 68 | |
| Day Percent Change: 0.61% Day Change: 0.08 | |
| Week Change: 5.47% Year-to-date Change: 37.8% | |
| APEI Links: Profile News Message Board | |
| Charts:- Daily , Weekly | |
| Add APEI to Watchlist: View: Get Complete APEI Trend Analysis ➞ | |
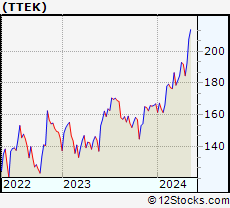 | TTEK Tetra Tech, Inc. |
| Sector: Services & Goods | |
| SubSector: Technical Services | |
| MarketCap: 3985.5 Millions | |
| Recent Price: 190.31 Smart Investing & Trading Score: 68 | |
| Day Percent Change: 0.54% Day Change: 1.02 | |
| Week Change: 3.05% Year-to-date Change: 14.0% | |
| TTEK Links: Profile News Message Board | |
| Charts:- Daily , Weekly | |
| Add TTEK to Watchlist: View: Get Complete TTEK Trend Analysis ➞ | |
 | SEAT Vivid Seats Inc. |
| Sector: Services & Goods | |
| SubSector: Internet Content & Information | |
| MarketCap: 1560 Millions | |
| Recent Price: 5.81 Smart Investing & Trading Score: 68 | |
| Day Percent Change: 0.17% Day Change: 0.01 | |
| Week Change: -1.36% Year-to-date Change: -6.9% | |
| SEAT Links: Profile News Message Board | |
| Charts:- Daily , Weekly | |
| Add SEAT to Watchlist: View: Get Complete SEAT Trend Analysis ➞ | |
 | RVLV Revolve Group, Inc. |
| Sector: Services & Goods | |
| SubSector: Specialty Retail, Other | |
| MarketCap: 652.244 Millions | |
| Recent Price: 19.14 Smart Investing & Trading Score: 68 | |
| Day Percent Change: -3.36% Day Change: -0.66 | |
| Week Change: -0.34% Year-to-date Change: 15.4% | |
| RVLV Links: Profile News Message Board | |
| Charts:- Daily , Weekly | |
| Add RVLV to Watchlist: View: Get Complete RVLV Trend Analysis ➞ | |
 | PRAA PRA Group, Inc. |
| Sector: Services & Goods | |
| SubSector: Business Services | |
| MarketCap: 1290.32 Millions | |
| Recent Price: 24.05 Smart Investing & Trading Score: 68 | |
| Day Percent Change: -2.99% Day Change: -0.74 | |
| Week Change: -1.31% Year-to-date Change: -8.2% | |
| PRAA Links: Profile News Message Board | |
| Charts:- Daily , Weekly | |
| Add PRAA to Watchlist: View: Get Complete PRAA Trend Analysis ➞ | |
 | EEFT Euronet Worldwide, Inc. |
| Sector: Services & Goods | |
| SubSector: Business Services | |
| MarketCap: 4809.62 Millions | |
| Recent Price: 102.99 Smart Investing & Trading Score: 68 | |
| Day Percent Change: -2.54% Day Change: -2.69 | |
| Week Change: -0.05% Year-to-date Change: 1.5% | |
| EEFT Links: Profile News Message Board | |
| Charts:- Daily , Weekly | |
| Add EEFT to Watchlist: View: Get Complete EEFT Trend Analysis ➞ | |
 | LTH Life Time Group Holdings, Inc. |
| Sector: Services & Goods | |
| SubSector: Leisure | |
| MarketCap: 3740 Millions | |
| Recent Price: 14.31 Smart Investing & Trading Score: 68 | |
| Day Percent Change: -1.99% Day Change: -0.29 | |
| Week Change: 2.14% Year-to-date Change: -5.5% | |
| LTH Links: Profile News Message Board | |
| Charts:- Daily , Weekly | |
| Add LTH to Watchlist: View: Get Complete LTH Trend Analysis ➞ | |
 | DJCO Daily Journal Corporation |
| Sector: Services & Goods | |
| SubSector: Publishing - Newspapers | |
| MarketCap: 306.822 Millions | |
| Recent Price: 347.05 Smart Investing & Trading Score: 68 | |
| Day Percent Change: -1.69% Day Change: -5.95 | |
| Week Change: -0.27% Year-to-date Change: 1.8% | |
| DJCO Links: Profile News Message Board | |
| Charts:- Daily , Weekly | |
| Add DJCO to Watchlist: View: Get Complete DJCO Trend Analysis ➞ | |
 | KFY Korn Ferry |
| Sector: Services & Goods | |
| SubSector: Staffing & Outsourcing Services | |
| MarketCap: 1534.28 Millions | |
| Recent Price: 61.64 Smart Investing & Trading Score: 68 | |
| Day Percent Change: -1.61% Day Change: -1.01 | |
| Week Change: 0.57% Year-to-date Change: 3.9% | |
| KFY Links: Profile News Message Board | |
| Charts:- Daily , Weekly | |
| Add KFY to Watchlist: View: Get Complete KFY Trend Analysis ➞ | |
 | URBN Urban Outfitters, Inc. |
| Sector: Services & Goods | |
| SubSector: Apparel Stores | |
| MarketCap: 1638.08 Millions | |
| Recent Price: 38.79 Smart Investing & Trading Score: 68 | |
| Day Percent Change: -1.02% Day Change: -0.40 | |
| Week Change: 4.89% Year-to-date Change: 8.7% | |
| URBN Links: Profile News Message Board | |
| Charts:- Daily , Weekly | |
| Add URBN to Watchlist: View: Get Complete URBN Trend Analysis ➞ | |
 | ACTG Acacia Research Corporation |
| Sector: Services & Goods | |
| SubSector: Business Services | |
| MarketCap: 112.782 Millions | |
| Recent Price: 4.94 Smart Investing & Trading Score: 68 | |
| Day Percent Change: -0.80% Day Change: -0.04 | |
| Week Change: 1.23% Year-to-date Change: 26.0% | |
| ACTG Links: Profile News Message Board | |
| Charts:- Daily , Weekly | |
| Add ACTG to Watchlist: View: Get Complete ACTG Trend Analysis ➞ | |
 | HGV Hilton Grand Vacations Inc. |
| Sector: Services & Goods | |
| SubSector: Resorts & Casinos | |
| MarketCap: 1333.04 Millions | |
| Recent Price: 44.43 Smart Investing & Trading Score: 68 | |
| Day Percent Change: -0.80% Day Change: -0.36 | |
| Week Change: 2.82% Year-to-date Change: 10.6% | |
| HGV Links: Profile News Message Board | |
| Charts:- Daily , Weekly | |
| Add HGV to Watchlist: View: Get Complete HGV Trend Analysis ➞ | |
 | FLNT Fluent, Inc. |
| Sector: Services & Goods | |
| SubSector: Marketing Services | |
| MarketCap: 110.015 Millions | |
| Recent Price: 2.67 Smart Investing & Trading Score: 68 | |
| Day Percent Change: -0.74% Day Change: -0.02 | |
| Week Change: 1.14% Year-to-date Change: 298.5% | |
| FLNT Links: Profile News Message Board | |
| Charts:- Daily , Weekly | |
| Add FLNT to Watchlist: View: Get Complete FLNT Trend Analysis ➞ | |
 | DBI Designer Brands Inc. |
| Sector: Services & Goods | |
| SubSector: Apparel Stores | |
| MarketCap: 467.308 Millions | |
| Recent Price: 9.38 Smart Investing & Trading Score: 68 | |
| Day Percent Change: -0.69% Day Change: -0.06 | |
| Week Change: 6.66% Year-to-date Change: 5.9% | |
| DBI Links: Profile News Message Board | |
| Charts:- Daily , Weekly | |
| Add DBI to Watchlist: View: Get Complete DBI Trend Analysis ➞ | |
 | CPNG Coupang, Inc. |
| Sector: Services & Goods | |
| SubSector: Internet Retail | |
| MarketCap: 30840 Millions | |
| Recent Price: 22.41 Smart Investing & Trading Score: 68 | |
| Day Percent Change: -0.24% Day Change: -0.05 | |
| Week Change: 1.79% Year-to-date Change: 38.3% | |
| CPNG Links: Profile News Message Board | |
| Charts:- Daily , Weekly | |
| Add CPNG to Watchlist: View: Get Complete CPNG Trend Analysis ➞ | |
 | DHX DHI Group, Inc. |
| Sector: Services & Goods | |
| SubSector: Staffing & Outsourcing Services | |
| MarketCap: 144.728 Millions | |
| Recent Price: 2.49 Smart Investing & Trading Score: 68 | |
| Day Percent Change: 0.40% Day Change: 0.01 | |
| Week Change: 0.4% Year-to-date Change: -3.9% | |
| DHX Links: Profile News Message Board | |
| Charts:- Daily , Weekly | |
| Add DHX to Watchlist: View: Get Complete DHX Trend Analysis ➞ | |
 | SBGI Sinclair Broadcast Group, Inc. |
| Sector: Services & Goods | |
| SubSector: Broadcasting - TV | |
| MarketCap: 1461.73 Millions | |
| Recent Price: 12.39 Smart Investing & Trading Score: 67 | |
| Day Percent Change: -2.75% Day Change: -0.35 | |
| Week Change: 0.32% Year-to-date Change: -4.9% | |
| SBGI Links: Profile News Message Board | |
| Charts:- Daily , Weekly | |
| Add SBGI to Watchlist: View: Get Complete SBGI Trend Analysis ➞ | |
 | QGEN QIAGEN N.V. |
| Sector: Services & Goods | |
| SubSector: Research Services | |
| MarketCap: 8698.94 Millions | |
| Recent Price: 40.69 Smart Investing & Trading Score: 67 | |
| Day Percent Change: -2.00% Day Change: -0.83 | |
| Week Change: 1.73% Year-to-date Change: -6.3% | |
| QGEN Links: Profile News Message Board | |
| Charts:- Daily , Weekly | |
| Add QGEN to Watchlist: View: Get Complete QGEN Trend Analysis ➞ | |
 | HVT Haverty Furniture Companies, Inc. |
| Sector: Services & Goods | |
| SubSector: Home Furnishing Stores | |
| MarketCap: 253.125 Millions | |
| Recent Price: 31.95 Smart Investing & Trading Score: 67 | |
| Day Percent Change: -1.84% Day Change: -0.60 | |
| Week Change: 2.54% Year-to-date Change: -10.0% | |
| HVT Links: Profile News Message Board | |
| Charts:- Daily , Weekly | |
| Add HVT to Watchlist: View: Get Complete HVT Trend Analysis ➞ | |
 | NSP Insperity, Inc. |
| Sector: Services & Goods | |
| SubSector: Business Services | |
| MarketCap: 1385.32 Millions | |
| Recent Price: 107.69 Smart Investing & Trading Score: 67 | |
| Day Percent Change: -1.68% Day Change: -1.83 | |
| Week Change: -0.61% Year-to-date Change: -8.1% | |
| NSP Links: Profile News Message Board | |
| Charts:- Daily , Weekly | |
| Add NSP to Watchlist: View: Get Complete NSP Trend Analysis ➞ | |
 | EXPO Exponent, Inc. |
| Sector: Services & Goods | |
| SubSector: Management Services | |
| MarketCap: 3605.95 Millions | |
| Recent Price: 79.94 Smart Investing & Trading Score: 67 | |
| Day Percent Change: -0.82% Day Change: -0.66 | |
| Week Change: 0.97% Year-to-date Change: -9.2% | |
| EXPO Links: Profile News Message Board | |
| Charts:- Daily , Weekly | |
| Add EXPO to Watchlist: View: Get Complete EXPO Trend Analysis ➞ | |
 | HSIC Henry Schein, Inc. |
| Sector: Services & Goods | |
| SubSector: Medical Equipment Wholesale | |
| MarketCap: 6760.9 Millions | |
| Recent Price: 72.61 Smart Investing & Trading Score: 67 | |
| Day Percent Change: -0.81% Day Change: -0.59 | |
| Week Change: 2.48% Year-to-date Change: -4.1% | |
| HSIC Links: Profile News Message Board | |
| Charts:- Daily , Weekly | |
| Add HSIC to Watchlist: View: Get Complete HSIC Trend Analysis ➞ | |
 | DIN Dine Brands Global, Inc. |
| Sector: Services & Goods | |
| SubSector: Restaurants | |
| MarketCap: 421.17 Millions | |
| Recent Price: 45.15 Smart Investing & Trading Score: 67 | |
| Day Percent Change: -0.31% Day Change: -0.14 | |
| Week Change: 4.15% Year-to-date Change: -9.1% | |
| DIN Links: Profile News Message Board | |
| Charts:- Daily , Weekly | |
| Add DIN to Watchlist: View: Get Complete DIN Trend Analysis ➞ | |
| For tabular summary view of above stock list: Summary View ➞ 0 - 25 , 25 - 50 , 50 - 75 , 75 - 100 , 100 - 125 , 125 - 150 , 150 - 175 , 175 - 200 , 200 - 225 , 225 - 250 , 250 - 275 , 275 - 300 , 300 - 325 , 325 - 350 , 350 - 375 , 375 - 400 , 400 - 425 , 425 - 450 , 450 - 475 | ||
| Click To Change The Sort Order: By Market Cap or Company Size Performance: Year-to-date, Week and Day | |
| Select Chart Type: | ||
|
Best Stocks Today 12Stocks.com |
© 2024 12Stocks.com Terms & Conditions Privacy Contact Us
All Information Provided Only For Education And Not To Be Used For Investing or Trading. See Terms & Conditions


One More Thing ... Get Best Stocks Delivered Daily!
Never Ever Miss A Move With Our Top Ten Stocks Lists
Find Best Stocks In Any Market - Bull or Bear Market
Take A Peek At Our Top Ten Stocks Lists: Daily, Weekly, Year-to-Date & Top Trends
Find Best Stocks In Any Market - Bull or Bear Market
Take A Peek At Our Top Ten Stocks Lists: Daily, Weekly, Year-to-Date & Top Trends
Consumer Services Stocks With Best Up Trends [0-bearish to 100-bullish]: Ardagh Metal[100], Churchill Downs[100], Yatsen Holding[100], Chipotle Mexican[100], MYT Netherlands[100], Dada Nexus[100], Avnet [100], Reynolds Consumer[100], Omnicom [100], Alibaba [100], FTI Consulting[100]
Best Consumer Services Stocks Year-to-Date:
U Power[2896.65%], Vroom [1804.53%], Yatsen Holding[502.79%], Fluent [298.51%], Codere Online[133.9%], Research[107.01%], Sweetgreen [91.24%], RealReal [64.43%], Bright Scholar[59.2%], PaySign [55.54%], DXP Enterprises[50.59%] Best Consumer Services Stocks This Week:
Chicken Soup[210%], Yatsen Holding[21.99%], Hibbett Sports[21%], Golden Heaven[15.91%], K12 [15.21%], Strategic Education[15.13%], Sonic Automotive[14.21%], TAL Education[13.12%], Watsco [12.7%], Ardagh Metal[12.61%], iHeartMedia [12.37%] Best Consumer Services Stocks Daily:
Boqii Holding[15.69%], Strategic Education[12.22%], Altisource Portfolio[8.82%], Red Robin[8.77%], TransUnion [8.77%], Sonic Automotive[8.63%], MOGU [8.43%], Ardagh Metal[6.65%], Churchill Downs[6.18%], TAL Education[5.46%], Soho House[5.19%]