
 Login Sign Up


| |||||
 |  | ||||

| 12Stocks.com Market Intelligence |
Best Consumer Services Stocks
| In a hurry? Services & Goods Stocks: Performance Trends Table, Stock Charts
Sort Consumer Services: Daily, Weekly, Year-to-Date, Market Cap & Trends. Filter Services & Goods stocks list by size: All Large Mid-Range Small |
| 12Stocks.com Consumer Services Stocks Performances & Trends Daily | |||||||||
|
|  The overall Smart Investing & Trading Score is 13 (0-bearish to 100-bullish) which puts Consumer Services sector in short term bearish trend. The Smart Investing & Trading Score from previous trading session is 26 and a deterioration of trend continues.
| ||||||||
Here are the Smart Investing & Trading Scores of the most requested Consumer Services stocks at 12Stocks.com (click stock name for detailed review):
|


| Consider signing up for our daily 12Stocks.com "Best Stocks Newsletter". You will never ever miss a big stock move again! |
| 12Stocks.com: Investing in Consumer Services sector with Stocks | |
|
The following table helps investors and traders sort through current performance and trends (as measured by Smart Investing & Trading Score) of various
stocks in the Consumer Services sector. Quick View: Move mouse or cursor over stock symbol (ticker) to view short-term Technical chart and over stock name to view long term chart. Click on  to add stock symbol to your watchlist and to add stock symbol to your watchlist and  to view watchlist. Click on any ticker or stock name for detailed market intelligence report for that stock. to view watchlist. Click on any ticker or stock name for detailed market intelligence report for that stock. |
12Stocks.com Performance of Stocks in Consumer Services Sector
| Ticker | Stock Name | Watchlist | Category | Recent Price | Smart Investing & Trading Score | Change % | YTD Change% |
| HURN | Huron Consulting |   | Services | 92.32 | 42 | 2.08% | -10.19% |
| TGNA | TEGNA | | Broadcasting | 13.82 | 42 | 2.07% | -9.67% |
| NXST | Nexstar Media | | Broadcasting | 165.25 | 42 | 2.03% | 5.42% |
| CATO | Cato | | Apparel | 5.04 | 42 | 2.02% | -29.41% |
| NYT | New York | | Publishing | 42.60 | 42 | 1.99% | -13.04% |
| PRDO | Perdoceo Education | | Education | 17.32 | 42 | 1.94% | -1.37% |
| PZZA | Papa John | | Restaurants | 62.50 | 42 | 1.87% | -18.01% |
| CSV | Carriage Services | | Services | 24.00 | 42 | 1.82% | -4.04% |
| UA | Under Armour | | Apparel | 6.47 | 42 | 1.73% | -22.51% |
| FTDR | frontdoor | | Services | 30.50 | 42 | 1.62% | -13.42% |
| ARCO | Arcos Dorados | | Restaurants | 10.90 | 42 | 1.30% | -14.11% |
| VSCO | Victorias Secret | | Apparel Retail | 17.29 | 42 | 0.23% | -35.05% |
| DDS | Dillard s | | Department | 408.43 | 41 | 1.65% | 1.18% |
| PLYA | Playa Hotels | | Casinos | 9.00 | 41 | 1.47% | 4.05% |
| VSEC | VSE | | Services | 75.68 | 41 | 0.77% | 17.13% |
| HUYA | HUYA | | Entertainment | 4.41 | 41 | -2.22% | 20.49% |
| REAL | RealReal | | Retail | 3.11 | 41 | -1.27% | 54.73% |
| SHAK | Shake Shack | | Restaurants | 94.40 | 41 | -0.87% | 27.36% |
| WSM | Williams-Sonoma | | Retail | 279.20 | 41 | -0.12% | 38.37% |
| EDU | New Oriental | | Education | 84.99 | 41 | -2.19% | 15.98% |
| INSW | Seaways | | Services | 53.03 | 40 | 2.75% | 16.60% |
| PTVE | Pactiv Evergreen | | Packaging | 14.41 | 40 | 1.91% | 5.03% |
| LVWR | LiveWire | | Auto Manufacturers | 7.56 | 40 | -0.26% | -35.05% |
| YJ | Yunji | | Retail | 0.75 | 38 | 0.00% | 4.87% |
| QRTEA | Qurate Retail | | Retail | 1.00 | 38 | -2.91% | 14.22% |
| For chart view version of above stock list: Chart View ➞ 0 - 25 , 25 - 50 , 50 - 75 , 75 - 100 , 100 - 125 , 125 - 150 , 150 - 175 , 175 - 200 , 200 - 225 , 225 - 250 , 250 - 275 , 275 - 300 , 300 - 325 , 325 - 350 , 350 - 375 , 375 - 400 , 400 - 425 , 425 - 450 , 450 - 475 | ||
 | Click To Change The Sort Order: By Market Cap or Company Size Performance: Year-to-date, Week and Day |  |
|
Get the most comprehensive stock market coverage daily at 12Stocks.com ➞ Best Stocks Today ➞ Best Stocks Weekly ➞ Best Stocks Year-to-Date ➞ Best Stocks Trends ➞  Best Stocks Today 12Stocks.com Best Nasdaq Stocks ➞ Best S&P 500 Stocks ➞ Best Tech Stocks ➞ Best Biotech Stocks ➞ |
| Detailed Overview of Consumer Services Stocks |
| Consumer Services Technical Overview, Leaders & Laggards, Top Consumer Services ETF Funds & Detailed Consumer Services Stocks List, Charts, Trends & More |
| Consumer Services Sector: Technical Analysis, Trends & YTD Performance | |
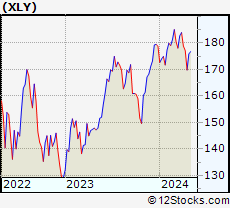
| Consumer Services sector is composed of stocks
from retail, entertainment, media/publishing, consumer goods
and services subsectors. Consumer Services sector, as represented by XLY, an exchange-traded fund [ETF] that holds basket of Consumer Services stocks (e.g, Walmart, Alibaba) is down by -5.06% and is currently underperforming the overall market by -8.44% year-to-date. Below is a quick view of Technical charts and trends: |
|
 XLY Weekly Chart |
|
| Long Term Trend: Not Good | |
| Medium Term Trend: Not Good | |
 XLY Daily Chart |
|
| Short Term Trend: Not Good | |
| Overall Trend Score: 13 | |
| YTD Performance: -5.06% | |
| **Trend Scores & Views Are Only For Educational Purposes And Not For Investing | |
| 12Stocks.com: Top Performing Consumer Services Sector Stocks | ||||||||||||||||||||||||||||||||||||||||||||||||
 The top performing Consumer Services sector stocks year to date are
Now, more recently, over last week, the top performing Consumer Services sector stocks on the move are


|
||||||||||||||||||||||||||||||||||||||||||||||||
| 12Stocks.com: Investing in Consumer Services Sector using Exchange Traded Funds | |
|
The following table shows list of key exchange traded funds (ETF) that
help investors track Consumer Services Index. For detailed view, check out our ETF Funds section of our website. Quick View: Move mouse or cursor over ETF symbol (ticker) to view short-term Technical chart and over ETF name to view long term chart. Click on ticker or stock name for detailed view. Click on to add stock symbol to your watchlist and to view watchlist. |
12Stocks.com List of ETFs that track Consumer Services Index
| Ticker | ETF Name | Watchlist | Recent Price | Smart Investing & Trading Score | Change % | Week % | Year-to-date % |
| XLY | Consumer Discret Sel | | 169.76 | 13 | -0.88 | -4.15 | -5.06% |
| RTH | Retail | | 198.63 | 44 | 0.00 | -1.52 | 5.53% |
| IYC | Consumer Services | | 76.27 | 26 | -1.03 | -3.69 | 0.66% |
| XRT | Retail | | 71.17 | 51 | 0.68 | -0.99 | -1.59% |
| IYK | Consumer Goods | | 65.81 | 75 | 1.29 | 2.57 | 2.98% |
| UCC | Consumer Services | | 31.58 | 20 | -3.26 | -8.28 | -12.06% |
| RETL | Retail Bull 3X | | 8.12 | 49 | 2.14 | -3.45 | -10.96% |
| RXI | Globl Consumer Discretionary | | 157.15 | 44 | -0.19 | -2.26 | -1.2% |
| SCC | Short Consumer Services | | 16.95 | 100 | 2.13 | 8.91 | 10.64% |
| UGE | Consumer Goods | | 16.63 | 73 | 2.26 | 2.71 | 5.63% |
| 12Stocks.com: Charts, Trends, Fundamental Data and Performances of Consumer Services Stocks | |
|
We now take in-depth look at all Consumer Services stocks including charts, multi-period performances and overall trends (as measured by Smart Investing & Trading Score). One can sort Consumer Services stocks (click link to choose) by Daily, Weekly and by Year-to-Date performances. Also, one can sort by size of the company or by market capitalization. |
| Select Your Default Chart Type: | |||||
| |||||
| Click on stock symbol or name for detailed view. Click on to add stock symbol to your watchlist and to view watchlist. Quick View: Move mouse or cursor over "Daily" to quickly view daily Technical stock chart and over "Weekly" to view weekly Technical stock chart. | |||||

 | HURN Huron Consulting Group Inc. |
| Sector: Services & Goods | |
| SubSector: Management Services | |
| MarketCap: 968.645 Millions | |
| Recent Price: 92.32 Smart Investing & Trading Score: 42 | |
| Day Percent Change: 2.08% Day Change: 1.88 | |
| Week Change: -0.08% Year-to-date Change: -10.2% | |
| HURN Links: Profile News Message Board | |
| Charts:- Daily , Weekly | |
| Add HURN to Watchlist: View: Get Complete HURN Trend Analysis ➞ | |
 | TGNA TEGNA Inc. |
| Sector: Services & Goods | |
| SubSector: Broadcasting - TV | |
| MarketCap: 2791.83 Millions | |
| Recent Price: 13.82 Smart Investing & Trading Score: 42 | |
| Day Percent Change: 2.07% Day Change: 0.28 | |
| Week Change: 1.62% Year-to-date Change: -9.7% | |
| TGNA Links: Profile News Message Board | |
| Charts:- Daily , Weekly | |
| Add TGNA to Watchlist: View: Get Complete TGNA Trend Analysis ➞ | |
 | NXST Nexstar Media Group, Inc. |
| Sector: Services & Goods | |
| SubSector: Broadcasting - TV | |
| MarketCap: 2763.73 Millions | |
| Recent Price: 165.25 Smart Investing & Trading Score: 42 | |
| Day Percent Change: 2.03% Day Change: 3.29 | |
| Week Change: 3.42% Year-to-date Change: 5.4% | |
| NXST Links: Profile News Message Board | |
| Charts:- Daily , Weekly | |
| Add NXST to Watchlist: View: Get Complete NXST Trend Analysis ➞ | |
 | CATO The Cato Corporation |
| Sector: Services & Goods | |
| SubSector: Apparel Stores | |
| MarketCap: 305.208 Millions | |
| Recent Price: 5.04 Smart Investing & Trading Score: 42 | |
| Day Percent Change: 2.02% Day Change: 0.10 | |
| Week Change: 0.4% Year-to-date Change: -29.4% | |
| CATO Links: Profile News Message Board | |
| Charts:- Daily , Weekly | |
| Add CATO to Watchlist: View: Get Complete CATO Trend Analysis ➞ | |
 | NYT The New York Times Company |
| Sector: Services & Goods | |
| SubSector: Publishing - Newspapers | |
| MarketCap: 5188.22 Millions | |
| Recent Price: 42.60 Smart Investing & Trading Score: 42 | |
| Day Percent Change: 1.99% Day Change: 0.83 | |
| Week Change: 0.42% Year-to-date Change: -13.0% | |
| NYT Links: Profile News Message Board | |
| Charts:- Daily , Weekly | |
| Add NYT to Watchlist: View: Get Complete NYT Trend Analysis ➞ | |
 | PRDO Perdoceo Education Corporation |
| Sector: Services & Goods | |
| SubSector: Education & Training Services | |
| MarketCap: 631.006 Millions | |
| Recent Price: 17.32 Smart Investing & Trading Score: 42 | |
| Day Percent Change: 1.94% Day Change: 0.33 | |
| Week Change: 1.23% Year-to-date Change: -1.4% | |
| PRDO Links: Profile News Message Board | |
| Charts:- Daily , Weekly | |
| Add PRDO to Watchlist: View: Get Complete PRDO Trend Analysis ➞ | |
 | PZZA Papa John s International, Inc. |
| Sector: Services & Goods | |
| SubSector: Specialty Eateries | |
| MarketCap: 1925.27 Millions | |
| Recent Price: 62.50 Smart Investing & Trading Score: 42 | |
| Day Percent Change: 1.87% Day Change: 1.15 | |
| Week Change: 1.17% Year-to-date Change: -18.0% | |
| PZZA Links: Profile News Message Board | |
| Charts:- Daily , Weekly | |
| Add PZZA to Watchlist: View: Get Complete PZZA Trend Analysis ➞ | |
 | CSV Carriage Services, Inc. |
| Sector: Services & Goods | |
| SubSector: Personal Services | |
| MarketCap: 304.725 Millions | |
| Recent Price: 24.00 Smart Investing & Trading Score: 42 | |
| Day Percent Change: 1.82% Day Change: 0.43 | |
| Week Change: -0.99% Year-to-date Change: -4.0% | |
| CSV Links: Profile News Message Board | |
| Charts:- Daily , Weekly | |
| Add CSV to Watchlist: View: Get Complete CSV Trend Analysis ➞ | |
 | UA Under Armour, Inc. |
| Sector: Services & Goods | |
| SubSector: Textile - Apparel Clothing | |
| MarketCap: 3926.93 Millions | |
| Recent Price: 6.47 Smart Investing & Trading Score: 42 | |
| Day Percent Change: 1.73% Day Change: 0.11 | |
| Week Change: 2.86% Year-to-date Change: -22.5% | |
| UA Links: Profile News Message Board | |
| Charts:- Daily , Weekly | |
| Add UA to Watchlist: View: Get Complete UA Trend Analysis ➞ | |
 | FTDR frontdoor, inc. |
| Sector: Services & Goods | |
| SubSector: Business Services | |
| MarketCap: 2974.22 Millions | |
| Recent Price: 30.50 Smart Investing & Trading Score: 42 | |
| Day Percent Change: 1.62% Day Change: 0.48 | |
| Week Change: 0.18% Year-to-date Change: -13.4% | |
| FTDR Links: Profile News Message Board | |
| Charts:- Daily , Weekly | |
| Add FTDR to Watchlist: View: Get Complete FTDR Trend Analysis ➞ | |
 | ARCO Arcos Dorados Holdings Inc. |
| Sector: Services & Goods | |
| SubSector: Restaurants | |
| MarketCap: 778.87 Millions | |
| Recent Price: 10.90 Smart Investing & Trading Score: 42 | |
| Day Percent Change: 1.30% Day Change: 0.14 | |
| Week Change: -0.91% Year-to-date Change: -14.1% | |
| ARCO Links: Profile News Message Board | |
| Charts:- Daily , Weekly | |
| Add ARCO to Watchlist: View: Get Complete ARCO Trend Analysis ➞ | |
 | VSCO Victorias Secret & Co. |
| Sector: Services & Goods | |
| SubSector: Apparel Retail | |
| MarketCap: 1340 Millions | |
| Recent Price: 17.29 Smart Investing & Trading Score: 42 | |
| Day Percent Change: 0.23% Day Change: 0.04 | |
| Week Change: -3.57% Year-to-date Change: -35.1% | |
| VSCO Links: Profile News Message Board | |
| Charts:- Daily , Weekly | |
| Add VSCO to Watchlist: View: Get Complete VSCO Trend Analysis ➞ | |
 | DDS Dillard s, Inc. |
| Sector: Services & Goods | |
| SubSector: Department Stores | |
| MarketCap: 1170.82 Millions | |
| Recent Price: 408.43 Smart Investing & Trading Score: 41 | |
| Day Percent Change: 1.65% Day Change: 6.62 | |
| Week Change: -0.53% Year-to-date Change: 1.2% | |
| DDS Links: Profile News Message Board | |
| Charts:- Daily , Weekly | |
| Add DDS to Watchlist: View: Get Complete DDS Trend Analysis ➞ | |
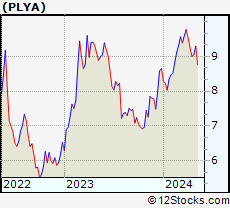 | PLYA Playa Hotels & Resorts N.V. |
| Sector: Services & Goods | |
| SubSector: Resorts & Casinos | |
| MarketCap: 360.194 Millions | |
| Recent Price: 9.00 Smart Investing & Trading Score: 41 | |
| Day Percent Change: 1.47% Day Change: 0.13 | |
| Week Change: -2.81% Year-to-date Change: 4.1% | |
| PLYA Links: Profile News Message Board | |
| Charts:- Daily , Weekly | |
| Add PLYA to Watchlist: View: Get Complete PLYA Trend Analysis ➞ | |
 | VSEC VSE Corporation |
| Sector: Services & Goods | |
| SubSector: Technical Services | |
| MarketCap: 183.61 Millions | |
| Recent Price: 75.68 Smart Investing & Trading Score: 41 | |
| Day Percent Change: 0.77% Day Change: 0.58 | |
| Week Change: -3.12% Year-to-date Change: 17.1% | |
| VSEC Links: Profile News Message Board | |
| Charts:- Daily , Weekly | |
| Add VSEC to Watchlist: View: Get Complete VSEC Trend Analysis ➞ | |
 | HUYA HUYA Inc. |
| Sector: Services & Goods | |
| SubSector: Entertainment - Diversified | |
| MarketCap: 3358.17 Millions | |
| Recent Price: 4.41 Smart Investing & Trading Score: 41 | |
| Day Percent Change: -2.22% Day Change: -0.10 | |
| Week Change: -3.5% Year-to-date Change: 20.5% | |
| HUYA Links: Profile News Message Board | |
| Charts:- Daily , Weekly | |
| Add HUYA to Watchlist: View: Get Complete HUYA Trend Analysis ➞ | |
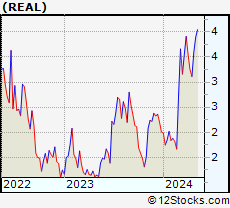 | REAL The RealReal, Inc. |
| Sector: Services & Goods | |
| SubSector: Specialty Retail, Other | |
| MarketCap: 839.344 Millions | |
| Recent Price: 3.11 Smart Investing & Trading Score: 41 | |
| Day Percent Change: -1.27% Day Change: -0.04 | |
| Week Change: -4.31% Year-to-date Change: 54.7% | |
| REAL Links: Profile News Message Board | |
| Charts:- Daily , Weekly | |
| Add REAL to Watchlist: View: Get Complete REAL Trend Analysis ➞ | |
 | SHAK Shake Shack Inc. |
| Sector: Services & Goods | |
| SubSector: Specialty Eateries | |
| MarketCap: 1497.67 Millions | |
| Recent Price: 94.40 Smart Investing & Trading Score: 41 | |
| Day Percent Change: -0.87% Day Change: -0.83 | |
| Week Change: -2.89% Year-to-date Change: 27.4% | |
| SHAK Links: Profile News Message Board | |
| Charts:- Daily , Weekly | |
| Add SHAK to Watchlist: View: Get Complete SHAK Trend Analysis ➞ | |
 | WSM Williams-Sonoma, Inc. |
| Sector: Services & Goods | |
| SubSector: Home Furnishing Stores | |
| MarketCap: 3370.05 Millions | |
| Recent Price: 279.20 Smart Investing & Trading Score: 41 | |
| Day Percent Change: -0.12% Day Change: -0.33 | |
| Week Change: -3.34% Year-to-date Change: 38.4% | |
| WSM Links: Profile News Message Board | |
| Charts:- Daily , Weekly | |
| Add WSM to Watchlist: View: Get Complete WSM Trend Analysis ➞ | |
 | EDU New Oriental Education & Technology Group Inc. |
| Sector: Services & Goods | |
| SubSector: Education & Training Services | |
| MarketCap: 18673.7 Millions | |
| Recent Price: 84.99 Smart Investing & Trading Score: 41 | |
| Day Percent Change: -2.19% Day Change: -1.90 | |
| Week Change: -1.81% Year-to-date Change: 16.0% | |
| EDU Links: Profile News Message Board | |
| Charts:- Daily , Weekly | |
| Add EDU to Watchlist: View: Get Complete EDU Trend Analysis ➞ | |
 | INSW International Seaways, Inc. |
| Sector: Services & Goods | |
| SubSector: Business Services | |
| MarketCap: 521.582 Millions | |
| Recent Price: 53.03 Smart Investing & Trading Score: 40 | |
| Day Percent Change: 2.75% Day Change: 1.42 | |
| Week Change: 1.67% Year-to-date Change: 16.6% | |
| INSW Links: Profile News Message Board | |
| Charts:- Daily , Weekly | |
| Add INSW to Watchlist: View: Get Complete INSW Trend Analysis ➞ | |
 | PTVE Pactiv Evergreen Inc. |
| Sector: Services & Goods | |
| SubSector: Packaging & Containers | |
| MarketCap: 33427 Millions | |
| Recent Price: 14.41 Smart Investing & Trading Score: 40 | |
| Day Percent Change: 1.91% Day Change: 0.27 | |
| Week Change: 0.49% Year-to-date Change: 5.0% | |
| PTVE Links: Profile News Message Board | |
| Charts:- Daily , Weekly | |
| Add PTVE to Watchlist: View: Get Complete PTVE Trend Analysis ➞ | |
 | LVWR LiveWire Group, Inc. |
| Sector: Services & Goods | |
| SubSector: Auto Manufacturers | |
| MarketCap: 2400 Millions | |
| Recent Price: 7.56 Smart Investing & Trading Score: 40 | |
| Day Percent Change: -0.26% Day Change: -0.02 | |
| Week Change: 3% Year-to-date Change: -35.1% | |
| LVWR Links: Profile News Message Board | |
| Charts:- Daily , Weekly | |
| Add LVWR to Watchlist: View: Get Complete LVWR Trend Analysis ➞ | |
 | YJ Yunji Inc. |
| Sector: Services & Goods | |
| SubSector: Specialty Retail, Other | |
| MarketCap: 770.644 Millions | |
| Recent Price: 0.75 Smart Investing & Trading Score: 38 | |
| Day Percent Change: 0.00% Day Change: 0.00 | |
| Week Change: -15.28% Year-to-date Change: 4.9% | |
| YJ Links: Profile News Message Board | |
| Charts:- Daily , Weekly | |
| Add YJ to Watchlist: View: Get Complete YJ Trend Analysis ➞ | |
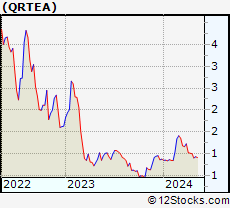 | QRTEA Qurate Retail, Inc. |
| Sector: Services & Goods | |
| SubSector: Specialty Retail, Other | |
| MarketCap: 1980.44 Millions | |
| Recent Price: 1.00 Smart Investing & Trading Score: 38 | |
| Day Percent Change: -2.91% Day Change: -0.03 | |
| Week Change: -0.99% Year-to-date Change: 14.2% | |
| QRTEA Links: Profile News Message Board | |
| Charts:- Daily , Weekly | |
| Add QRTEA to Watchlist: View: Get Complete QRTEA Trend Analysis ➞ | |
| For tabular summary view of above stock list: Summary View ➞ 0 - 25 , 25 - 50 , 50 - 75 , 75 - 100 , 100 - 125 , 125 - 150 , 150 - 175 , 175 - 200 , 200 - 225 , 225 - 250 , 250 - 275 , 275 - 300 , 300 - 325 , 325 - 350 , 350 - 375 , 375 - 400 , 400 - 425 , 425 - 450 , 450 - 475 | ||
| Click To Change The Sort Order: By Market Cap or Company Size Performance: Year-to-date, Week and Day | |
| Select Chart Type: | ||
|
Best Stocks Today 12Stocks.com |
© 2024 12Stocks.com Terms & Conditions Privacy Contact Us
All Information Provided Only For Education And Not To Be Used For Investing or Trading. See Terms & Conditions


One More Thing ... Get Best Stocks Delivered Daily!
Never Ever Miss A Move With Our Top Ten Stocks Lists
Find Best Stocks In Any Market - Bull or Bear Market
Take A Peek At Our Top Ten Stocks Lists: Daily, Weekly, Year-to-Date & Top Trends
Find Best Stocks In Any Market - Bull or Bear Market
Take A Peek At Our Top Ten Stocks Lists: Daily, Weekly, Year-to-Date & Top Trends
Consumer Services Stocks With Best Up Trends [0-bearish to 100-bullish]: Gannett Co[100], Gaia [100], Genuine Parts[100], Wendy s[100], Biglari [95], Envestnet [93], MYT Netherlands[93], PaySign [93], Weis Markets[93], FTI Consulting[93], Winmark [90]
Best Consumer Services Stocks Year-to-Date:
U Power[2768.3%], Vroom [1713.36%], Yatsen Holding[394.12%], Fluent [294.03%], Codere Online[136.64%], Research[96.15%], Sweetgreen [82.74%], Bright Scholar[60.8%], PaySign [55.71%], RealReal [54.73%], DXP Enterprises[49.76%] Best Consumer Services Stocks This Week:
Yatsen Holding[20.1%], AMC Entertainment[19.25%], Secoo Holding[17.14%], ContextLogic [16.8%], E.W. Scripps[12.19%], TH [11.82%], Genuine Parts[11.7%], Winmark [11.67%], Advance Auto[11.62%], Altisource Portfolio[11.49%], Envestnet [10.52%] Best Consumer Services Stocks Daily:
Lanvin [11.19%], Allego N.V[8.91%], AMC Entertainment[8.22%], Vision Marine[7.40%], Cumulus Media[7.17%], Altisource Portfolio[7.14%], Urban One[6.92%], Bright Scholar[6.91%], Red Robin[6.67%], Entravision [6.06%], MOGU [5.85%]