
 Login Sign Up


| |||||
 |  | ||||

| 12Stocks.com Market Intelligence |
Best Consumer Services Stocks
| In a hurry? Services & Goods Stocks: Performance Trends Table, Stock Charts
Sort Consumer Services: Daily, Weekly, Year-to-Date, Market Cap & Trends. Filter Services & Goods stocks list by size: All Large Mid-Range Small |
| 12Stocks.com Consumer Services Stocks Performances & Trends Daily | |||||||||
|
|  The overall Smart Investing & Trading Score is 23 (0-bearish to 100-bullish) which puts Consumer Services sector in short term bearish to neutral trend. The Smart Investing & Trading Score from previous trading session is 13 and hence an improvement of trend.
| ||||||||
Here are the Smart Investing & Trading Scores of the most requested Consumer Services stocks at 12Stocks.com (click stock name for detailed review):
|


| Consider signing up for our daily 12Stocks.com "Best Stocks Newsletter". You will never ever miss a big stock move again! |
| 12Stocks.com: Investing in Consumer Services sector with Stocks | |
|
The following table helps investors and traders sort through current performance and trends (as measured by Smart Investing & Trading Score) of various
stocks in the Consumer Services sector. Quick View: Move mouse or cursor over stock symbol (ticker) to view short-term Technical chart and over stock name to view long term chart. Click on  to add stock symbol to your watchlist and to add stock symbol to your watchlist and  to view watchlist. Click on any ticker or stock name for detailed market intelligence report for that stock. to view watchlist. Click on any ticker or stock name for detailed market intelligence report for that stock. |
12Stocks.com Performance of Stocks in Consumer Services Sector
| Ticker | Stock Name | Watchlist | Category | Recent Price | Smart Investing & Trading Score | Change % | YTD Change% |
| YUM | Yum! Brands |   | Restaurants | 138.53 | 75 | 0.48% | 6.02% |
| SGA | Saga | | Broadcasting | 22.90 | 74 | 0.66% | 2.88% |
| MSC | Studio City | | Casinos | 7.58 | 73 | 3.12% | 16.98% |
| TAL | TAL Education | | Education | 11.47 | 73 | -1.59% | -9.22% |
| ABM | ABM Industries | | Services | 44.12 | 73 | 0.72% | -1.59% |
| ETSY | Etsy | | Retail | 67.76 | 73 | 0.62% | -16.40% |
| CNK | Cinemark | | Entertainment | 18.12 | 69 | 0.00% | 28.60% |
| JWN | Nordstrom | | Apparel | 19.22 | 68 | 2.56% | 4.17% |
| EBAY | eBay | | Retail | 50.95 | 68 | 2.01% | 16.82% |
| TSCO | Tractor Supply | | Retail | 251.60 | 68 | 1.72% | 17.01% |
| ARMK | Aramark | | Restaurants | 31.73 | 68 | 1.70% | 12.92% |
| PRAA | PRA | | Services | 23.82 | 68 | 1.49% | -9.06% |
| HCSG | Healthcare Services | | Services | 11.86 | 68 | 1.37% | 14.37% |
| ACEL | Accel Entertainment | | Gaming | 11.40 | 68 | 1.24% | 11.00% |
| KR | Kroger Co | | Grocery | 56.16 | 68 | 1.07% | 22.87% |
| KBR | KBR | | Services | 62.78 | 68 | 1.05% | 13.30% |
| BKR | Baker Hughes | | Services | 32.52 | 68 | 1.01% | -4.84% |
| RERE | ATRenew | | Internet Retail | 1.60 | 68 | 0.95% | -15.34% |
| WLDN | Willdan | | Services | 26.95 | 68 | 0.90% | 25.35% |
| PSMT | PriceSmart | | Retail | 81.08 | 68 | 0.83% | 7.00% |
| VAC | Marriott Vacations | | Casinos | 99.43 | 68 | 0.50% | 17.13% |
| AAP | Advance Auto | | Auto Parts | 77.58 | 68 | 0.49% | 27.12% |
| TGT | Target | | Retail | 167.30 | 68 | 0.43% | 17.47% |
| DG | Dollar General | | Retail | 146.24 | 68 | 0.38% | 7.57% |
| YUMC | Yum China | | Restaurants | 37.32 | 68 | 0.27% | -12.04% |
| For chart view version of above stock list: Chart View ➞ 0 - 25 , 25 - 50 , 50 - 75 , 75 - 100 , 100 - 125 , 125 - 150 , 150 - 175 , 175 - 200 , 200 - 225 , 225 - 250 , 250 - 275 , 275 - 300 , 300 - 325 , 325 - 350 , 350 - 375 , 375 - 400 , 400 - 425 , 425 - 450 , 450 - 475 | ||
 | Click To Change The Sort Order: By Market Cap or Company Size Performance: Year-to-date, Week and Day |  |
|
Get the most comprehensive stock market coverage daily at 12Stocks.com ➞ Best Stocks Today ➞ Best Stocks Weekly ➞ Best Stocks Year-to-Date ➞ Best Stocks Trends ➞  Best Stocks Today 12Stocks.com Best Nasdaq Stocks ➞ Best S&P 500 Stocks ➞ Best Tech Stocks ➞ Best Biotech Stocks ➞ |
| Detailed Overview of Consumer Services Stocks |
| Consumer Services Technical Overview, Leaders & Laggards, Top Consumer Services ETF Funds & Detailed Consumer Services Stocks List, Charts, Trends & More |
| Consumer Services Sector: Technical Analysis, Trends & YTD Performance | |
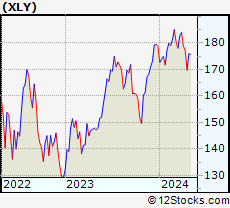
| Consumer Services sector is composed of stocks
from retail, entertainment, media/publishing, consumer goods
and services subsectors. Consumer Services sector, as represented by XLY, an exchange-traded fund [ETF] that holds basket of Consumer Services stocks (e.g, Walmart, Alibaba) is down by -4.39% and is currently underperforming the overall market by -8.47% year-to-date. Below is a quick view of Technical charts and trends: |
|
 XLY Weekly Chart |
|
| Long Term Trend: Good | |
| Medium Term Trend: Not Good | |
 XLY Daily Chart |
|
| Short Term Trend: Not Good | |
| Overall Trend Score: 23 | |
| YTD Performance: -4.39% | |
| **Trend Scores & Views Are Only For Educational Purposes And Not For Investing | |
| 12Stocks.com: Top Performing Consumer Services Sector Stocks | ||||||||||||||||||||||||||||||||||||||||||||||||
 The top performing Consumer Services sector stocks year to date are
Now, more recently, over last week, the top performing Consumer Services sector stocks on the move are


|
||||||||||||||||||||||||||||||||||||||||||||||||
| 12Stocks.com: Investing in Consumer Services Sector using Exchange Traded Funds | |
|
The following table shows list of key exchange traded funds (ETF) that
help investors track Consumer Services Index. For detailed view, check out our ETF Funds section of our website. Quick View: Move mouse or cursor over ETF symbol (ticker) to view short-term Technical chart and over ETF name to view long term chart. Click on ticker or stock name for detailed view. Click on to add stock symbol to your watchlist and to view watchlist. |
12Stocks.com List of ETFs that track Consumer Services Index
| Ticker | ETF Name | Watchlist | Recent Price | Smart Investing & Trading Score | Change % | Week % | Year-to-date % |
| XLY | Consumer Discret Sel | | 170.96 | 23 | -0.18 | -3.47 | -4.39% |
| RTH | Retail | | 198.72 | 44 | 0.05 | -1.47 | 5.57% |
| XRT | Retail | | 71.02 | 51 | 0.47 | -1.2 | -1.8% |
| UCC | Consumer Services | | 32.26 | 33 | -1.16 | -6.3 | -10.16% |
| RXI | Globl Consumer Discretionary | | 157.08 | 44 | -0.24 | -2.31 | -1.25% |
| SCC | Short Consumer Services | | 16.71 | 82 | 0.66 | 7.34 | 9.05% |
| UGE | Consumer Goods | | 16.28 | 73 | 0.13 | 0.57 | 3.43% |
| 12Stocks.com: Charts, Trends, Fundamental Data and Performances of Consumer Services Stocks | |
|
We now take in-depth look at all Consumer Services stocks including charts, multi-period performances and overall trends (as measured by Smart Investing & Trading Score). One can sort Consumer Services stocks (click link to choose) by Daily, Weekly and by Year-to-Date performances. Also, one can sort by size of the company or by market capitalization. |
| Select Your Default Chart Type: | |||||
| |||||
| Click on stock symbol or name for detailed view. Click on to add stock symbol to your watchlist and to view watchlist. Quick View: Move mouse or cursor over "Daily" to quickly view daily Technical stock chart and over "Weekly" to view weekly Technical stock chart. | |||||

 | YUM Yum! Brands, Inc. |
| Sector: Services & Goods | |
| SubSector: Restaurants | |
| MarketCap: 18033.3 Millions | |
| Recent Price: 138.53 Smart Investing & Trading Score: 75 | |
| Day Percent Change: 0.48% Day Change: 0.66 | |
| Week Change: 0.53% Year-to-date Change: 6.0% | |
| YUM Links: Profile News Message Board | |
| Charts:- Daily , Weekly | |
| Add YUM to Watchlist: View: Get Complete YUM Trend Analysis ➞ | |
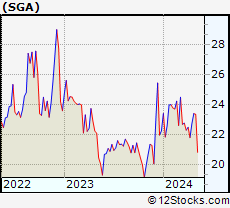 | SGA Saga Communications, Inc. |
| Sector: Services & Goods | |
| SubSector: Broadcasting - Radio | |
| MarketCap: 158.295 Millions | |
| Recent Price: 22.90 Smart Investing & Trading Score: 74 | |
| Day Percent Change: 0.66% Day Change: 0.15 | |
| Week Change: 5% Year-to-date Change: 2.9% | |
| SGA Links: Profile News Message Board | |
| Charts:- Daily , Weekly | |
| Add SGA to Watchlist: View: Get Complete SGA Trend Analysis ➞ | |
 | MSC Studio City International Holdings Limited |
| Sector: Services & Goods | |
| SubSector: Resorts & Casinos | |
| MarketCap: 1420.54 Millions | |
| Recent Price: 7.58 Smart Investing & Trading Score: 73 | |
| Day Percent Change: 3.12% Day Change: 0.23 | |
| Week Change: -10.82% Year-to-date Change: 17.0% | |
| MSC Links: Profile News Message Board | |
| Charts:- Daily , Weekly | |
| Add MSC to Watchlist: View: Get Complete MSC Trend Analysis ➞ | |
 | TAL TAL Education Group |
| Sector: Services & Goods | |
| SubSector: Education & Training Services | |
| MarketCap: 30103.1 Millions | |
| Recent Price: 11.47 Smart Investing & Trading Score: 73 | |
| Day Percent Change: -1.59% Day Change: -0.19 | |
| Week Change: -2.01% Year-to-date Change: -9.2% | |
| TAL Links: Profile News Message Board | |
| Charts:- Daily , Weekly | |
| Add TAL to Watchlist: View: Get Complete TAL Trend Analysis ➞ | |
 | ABM ABM Industries Incorporated |
| Sector: Services & Goods | |
| SubSector: Business Services | |
| MarketCap: 1706.72 Millions | |
| Recent Price: 44.12 Smart Investing & Trading Score: 73 | |
| Day Percent Change: 0.72% Day Change: 0.32 | |
| Week Change: 1.25% Year-to-date Change: -1.6% | |
| ABM Links: Profile News Message Board | |
| Charts:- Daily , Weekly | |
| Add ABM to Watchlist: View: Get Complete ABM Trend Analysis ➞ | |
 | ETSY Etsy, Inc. |
| Sector: Services & Goods | |
| SubSector: Specialty Retail, Other | |
| MarketCap: 4263.24 Millions | |
| Recent Price: 67.76 Smart Investing & Trading Score: 73 | |
| Day Percent Change: 0.62% Day Change: 0.42 | |
| Week Change: -0.95% Year-to-date Change: -16.4% | |
| ETSY Links: Profile News Message Board | |
| Charts:- Daily , Weekly | |
| Add ETSY to Watchlist: View: Get Complete ETSY Trend Analysis ➞ | |
 | CNK Cinemark Holdings, Inc. |
| Sector: Services & Goods | |
| SubSector: Movie Production, Theaters | |
| MarketCap: 1776.29 Millions | |
| Recent Price: 18.12 Smart Investing & Trading Score: 69 | |
| Day Percent Change: 0.00% Day Change: 0.00 | |
| Week Change: 1.85% Year-to-date Change: 28.6% | |
| CNK Links: Profile News Message Board | |
| Charts:- Daily , Weekly | |
| Add CNK to Watchlist: View: Get Complete CNK Trend Analysis ➞ | |
 | JWN Nordstrom, Inc. |
| Sector: Services & Goods | |
| SubSector: Apparel Stores | |
| MarketCap: 3351.68 Millions | |
| Recent Price: 19.22 Smart Investing & Trading Score: 68 | |
| Day Percent Change: 2.56% Day Change: 0.48 | |
| Week Change: 0.84% Year-to-date Change: 4.2% | |
| JWN Links: Profile News Message Board | |
| Charts:- Daily , Weekly | |
| Add JWN to Watchlist: View: Get Complete JWN Trend Analysis ➞ | |
 | EBAY eBay Inc. |
| Sector: Services & Goods | |
| SubSector: Specialty Retail, Other | |
| MarketCap: 23152.3 Millions | |
| Recent Price: 50.95 Smart Investing & Trading Score: 68 | |
| Day Percent Change: 2.01% Day Change: 1.00 | |
| Week Change: -0.69% Year-to-date Change: 16.8% | |
| EBAY Links: Profile News Message Board | |
| Charts:- Daily , Weekly | |
| Add EBAY to Watchlist: View: Get Complete EBAY Trend Analysis ➞ | |
 | TSCO Tractor Supply Company |
| Sector: Services & Goods | |
| SubSector: Specialty Retail, Other | |
| MarketCap: 9692.94 Millions | |
| Recent Price: 251.60 Smart Investing & Trading Score: 68 | |
| Day Percent Change: 1.72% Day Change: 4.25 | |
| Week Change: 2.74% Year-to-date Change: 17.0% | |
| TSCO Links: Profile News Message Board | |
| Charts:- Daily , Weekly | |
| Add TSCO to Watchlist: View: Get Complete TSCO Trend Analysis ➞ | |
 | ARMK Aramark |
| Sector: Services & Goods | |
| SubSector: Specialty Eateries | |
| MarketCap: 5242.27 Millions | |
| Recent Price: 31.73 Smart Investing & Trading Score: 68 | |
| Day Percent Change: 1.70% Day Change: 0.53 | |
| Week Change: 0.44% Year-to-date Change: 12.9% | |
| ARMK Links: Profile News Message Board | |
| Charts:- Daily , Weekly | |
| Add ARMK to Watchlist: View: Get Complete ARMK Trend Analysis ➞ | |
 | PRAA PRA Group, Inc. |
| Sector: Services & Goods | |
| SubSector: Business Services | |
| MarketCap: 1290.32 Millions | |
| Recent Price: 23.82 Smart Investing & Trading Score: 68 | |
| Day Percent Change: 1.49% Day Change: 0.35 | |
| Week Change: -2.32% Year-to-date Change: -9.1% | |
| PRAA Links: Profile News Message Board | |
| Charts:- Daily , Weekly | |
| Add PRAA to Watchlist: View: Get Complete PRAA Trend Analysis ➞ | |
 | HCSG Healthcare Services Group, Inc. |
| Sector: Services & Goods | |
| SubSector: Business Services | |
| MarketCap: 1758.32 Millions | |
| Recent Price: 11.86 Smart Investing & Trading Score: 68 | |
| Day Percent Change: 1.37% Day Change: 0.16 | |
| Week Change: 1.98% Year-to-date Change: 14.4% | |
| HCSG Links: Profile News Message Board | |
| Charts:- Daily , Weekly | |
| Add HCSG to Watchlist: View: Get Complete HCSG Trend Analysis ➞ | |
 | ACEL Accel Entertainment, Inc. |
| Sector: Services & Goods | |
| SubSector: Gaming Activities | |
| MarketCap: 486.589 Millions | |
| Recent Price: 11.40 Smart Investing & Trading Score: 68 | |
| Day Percent Change: 1.24% Day Change: 0.14 | |
| Week Change: 3.54% Year-to-date Change: 11.0% | |
| ACEL Links: Profile News Message Board | |
| Charts:- Daily , Weekly | |
| Add ACEL to Watchlist: View: Get Complete ACEL Trend Analysis ➞ | |
 | KR The Kroger Co. |
| Sector: Services & Goods | |
| SubSector: Grocery Stores | |
| MarketCap: 26718.5 Millions | |
| Recent Price: 56.16 Smart Investing & Trading Score: 68 | |
| Day Percent Change: 1.07% Day Change: 0.59 | |
| Week Change: 1.75% Year-to-date Change: 22.9% | |
| KR Links: Profile News Message Board | |
| Charts:- Daily , Weekly | |
| Add KR to Watchlist: View: Get Complete KR Trend Analysis ➞ | |
 | KBR KBR, Inc. |
| Sector: Services & Goods | |
| SubSector: Technical Services | |
| MarketCap: 2526.1 Millions | |
| Recent Price: 62.78 Smart Investing & Trading Score: 68 | |
| Day Percent Change: 1.05% Day Change: 0.65 | |
| Week Change: 0.06% Year-to-date Change: 13.3% | |
| KBR Links: Profile News Message Board | |
| Charts:- Daily , Weekly | |
| Add KBR to Watchlist: View: Get Complete KBR Trend Analysis ➞ | |
 | BKR Baker Hughes Company |
| Sector: Services & Goods | |
| SubSector: Technical Services | |
| MarketCap: 1330 Millions | |
| Recent Price: 32.52 Smart Investing & Trading Score: 68 | |
| Day Percent Change: 1.01% Day Change: 0.32 | |
| Week Change: -1.59% Year-to-date Change: -4.8% | |
| BKR Links: Profile News Message Board | |
| Charts:- Daily , Weekly | |
| Add BKR to Watchlist: View: Get Complete BKR Trend Analysis ➞ | |
 | RERE ATRenew Inc. |
| Sector: Services & Goods | |
| SubSector: Internet Retail | |
| MarketCap: 672 Millions | |
| Recent Price: 1.60 Smart Investing & Trading Score: 68 | |
| Day Percent Change: 0.95% Day Change: 0.02 | |
| Week Change: -8.05% Year-to-date Change: -15.3% | |
| RERE Links: Profile News Message Board | |
| Charts:- Daily , Weekly | |
| Add RERE to Watchlist: View: Get Complete RERE Trend Analysis ➞ | |
 | WLDN Willdan Group, Inc. |
| Sector: Services & Goods | |
| SubSector: Technical Services | |
| MarketCap: 235.61 Millions | |
| Recent Price: 26.95 Smart Investing & Trading Score: 68 | |
| Day Percent Change: 0.90% Day Change: 0.24 | |
| Week Change: -0.99% Year-to-date Change: 25.4% | |
| WLDN Links: Profile News Message Board | |
| Charts:- Daily , Weekly | |
| Add WLDN to Watchlist: View: Get Complete WLDN Trend Analysis ➞ | |
 | PSMT PriceSmart, Inc. |
| Sector: Services & Goods | |
| SubSector: Discount, Variety Stores | |
| MarketCap: 1655.72 Millions | |
| Recent Price: 81.08 Smart Investing & Trading Score: 68 | |
| Day Percent Change: 0.83% Day Change: 0.66 | |
| Week Change: 2.06% Year-to-date Change: 7.0% | |
| PSMT Links: Profile News Message Board | |
| Charts:- Daily , Weekly | |
| Add PSMT to Watchlist: View: Get Complete PSMT Trend Analysis ➞ | |
 | VAC Marriott Vacations Worldwide Corporation |
| Sector: Services & Goods | |
| SubSector: Resorts & Casinos | |
| MarketCap: 2173.54 Millions | |
| Recent Price: 99.43 Smart Investing & Trading Score: 68 | |
| Day Percent Change: 0.50% Day Change: 0.49 | |
| Week Change: 2.51% Year-to-date Change: 17.1% | |
| VAC Links: Profile News Message Board | |
| Charts:- Daily , Weekly | |
| Add VAC to Watchlist: View: Get Complete VAC Trend Analysis ➞ | |
 | AAP Advance Auto Parts, Inc. |
| Sector: Services & Goods | |
| SubSector: Auto Parts Stores | |
| MarketCap: 5977.7 Millions | |
| Recent Price: 77.58 Smart Investing & Trading Score: 68 | |
| Day Percent Change: 0.49% Day Change: 0.38 | |
| Week Change: 10.04% Year-to-date Change: 27.1% | |
| AAP Links: Profile News Message Board | |
| Charts:- Daily , Weekly | |
| Add AAP to Watchlist: View: Get Complete AAP Trend Analysis ➞ | |
 | TGT Target Corporation |
| Sector: Services & Goods | |
| SubSector: Discount, Variety Stores | |
| MarketCap: 55980.6 Millions | |
| Recent Price: 167.30 Smart Investing & Trading Score: 68 | |
| Day Percent Change: 0.43% Day Change: 0.72 | |
| Week Change: 0.71% Year-to-date Change: 17.5% | |
| TGT Links: Profile News Message Board | |
| Charts:- Daily , Weekly | |
| Add TGT to Watchlist: View: Get Complete TGT Trend Analysis ➞ | |
 | DG Dollar General Corporation |
| Sector: Services & Goods | |
| SubSector: Discount, Variety Stores | |
| MarketCap: 39611.9 Millions | |
| Recent Price: 146.24 Smart Investing & Trading Score: 68 | |
| Day Percent Change: 0.38% Day Change: 0.56 | |
| Week Change: -1.04% Year-to-date Change: 7.6% | |
| DG Links: Profile News Message Board | |
| Charts:- Daily , Weekly | |
| Add DG to Watchlist: View: Get Complete DG Trend Analysis ➞ | |
 | YUMC Yum China Holdings, Inc. |
| Sector: Services & Goods | |
| SubSector: Restaurants | |
| MarketCap: 16284.5 Millions | |
| Recent Price: 37.32 Smart Investing & Trading Score: 68 | |
| Day Percent Change: 0.27% Day Change: 0.10 | |
| Week Change: -0.05% Year-to-date Change: -12.0% | |
| YUMC Links: Profile News Message Board | |
| Charts:- Daily , Weekly | |
| Add YUMC to Watchlist: View: Get Complete YUMC Trend Analysis ➞ | |
| For tabular summary view of above stock list: Summary View ➞ 0 - 25 , 25 - 50 , 50 - 75 , 75 - 100 , 100 - 125 , 125 - 150 , 150 - 175 , 175 - 200 , 200 - 225 , 225 - 250 , 250 - 275 , 275 - 300 , 300 - 325 , 325 - 350 , 350 - 375 , 375 - 400 , 400 - 425 , 425 - 450 , 450 - 475 | ||
| Click To Change The Sort Order: By Market Cap or Company Size Performance: Year-to-date, Week and Day | |
| Select Chart Type: | ||
|
Best Stocks Today 12Stocks.com |
© 2024 12Stocks.com Terms & Conditions Privacy Contact Us
All Information Provided Only For Education And Not To Be Used For Investing or Trading. See Terms & Conditions


One More Thing ... Get Best Stocks Delivered Daily!
Never Ever Miss A Move With Our Top Ten Stocks Lists
Find Best Stocks In Any Market - Bull or Bear Market
Take A Peek At Our Top Ten Stocks Lists: Daily, Weekly, Year-to-Date & Top Trends
Find Best Stocks In Any Market - Bull or Bear Market
Take A Peek At Our Top Ten Stocks Lists: Daily, Weekly, Year-to-Date & Top Trends
Consumer Services Stocks With Best Up Trends [0-bearish to 100-bullish]: Gannett Co[100], Gaia [100], Genuine Parts[100], IMAX [100], ContextLogic [95], Biglari [95], MYT Netherlands[93], Envestnet [93], FTI Consulting[93], Bright Scholar[90], Donnelley Financial[90]
Best Consumer Services Stocks Year-to-Date:
U Power[2818.53%], Vroom [1713.36%], Yatsen Holding[394.12%], Fluent [288.06%], Codere Online[138.01%], Research[96.93%], Sweetgreen [86.02%], Bright Scholar[68%], RealReal [57.96%], PaySign [52.5%], DXP Enterprises[50.45%] Best Consumer Services Stocks This Week:
Yatsen Holding[20.1%], ContextLogic [20%], AMC Entertainment[17.36%], Secoo Holding[15.24%], Bright Scholar[14.13%], E.W. Scripps[12.5%], Genuine Parts[10.93%], Advance Auto[10.04%], Envestnet [9.27%], Smart Share[9.26%], Altisource Portfolio[8.45%] Best Consumer Services Stocks Daily:
Bright Scholar[11.70%], Vision Marine[7.40%], Lanvin [6.99%], AMC Entertainment[6.51%], Allbirds [5.72%], GreenTree Hospitality[4.56%], E.W. Scripps[4.35%], ContextLogic [4.35%], Altisource Portfolio[4.22%], MYT Netherlands[4.06%], Allego N.V[3.96%]