
 Login Sign Up


| |||||
 |  | ||||

| 12Stocks.com Market Intelligence |
Best Consumer Services Stocks
| In a hurry? Services & Goods Stocks: Performance Trends Table, Stock Charts
Sort Consumer Services: Daily, Weekly, Year-to-Date, Market Cap & Trends. Filter Services & Goods stocks list by size: All Large Mid-Range Small |
| 12Stocks.com Consumer Services Stocks Performances & Trends Daily | |||||||||
|
|  The overall Smart Investing & Trading Score is 100 (0-bearish to 100-bullish) which puts Consumer Services sector in short term bullish trend. The Smart Investing & Trading Score from previous trading session is 90 and an improvement of trend continues.
| ||||||||
Here are the Smart Investing & Trading Scores of the most requested Consumer Services stocks at 12Stocks.com (click stock name for detailed review):
|


| Consider signing up for our daily 12Stocks.com "Best Stocks Newsletter". You will never ever miss a big stock move again! |
| 12Stocks.com: Investing in Consumer Services sector with Stocks | |
|
The following table helps investors and traders sort through current performance and trends (as measured by Smart Investing & Trading Score) of various
stocks in the Consumer Services sector. Quick View: Move mouse or cursor over stock symbol (ticker) to view short-term Technical chart and over stock name to view long term chart. Click on  to add stock symbol to your watchlist and to add stock symbol to your watchlist and  to view watchlist. Click on any ticker or stock name for detailed market intelligence report for that stock. to view watchlist. Click on any ticker or stock name for detailed market intelligence report for that stock. |
12Stocks.com Performance of Stocks in Consumer Services Sector
| Ticker | Stock Name | Watchlist | Category | Recent Price | Smart Investing & Trading Score | Change % | Weekly Change% |
| DXPE | DXP Enterprises |   | Equipment | 119.78 | 80 | 3.67% | 6.58% |
| VAC | Marriott Vacations | | Casinos | 76.83 | 70 | 2.56% | 6.44% |
| LYV | Live Nation | | Entertainment | 158.87 | 80 | 0.88% | 6.42% |
| PRAA | PRA | | Services | 16.63 | 90 | 5.58% | 6.40% |
| CCO | Clear Channel | | Marketing | 1.17 | 80 | -5.13% | 6.36% |
| LAD | Lithia Motors | | Automobile | 315.08 | 70 | -0.55% | 6.32% |
| HURN | Huron Consulting | | Services | 137.00 | 70 | 7.92% | 6.28% |
| OUT | Outfront Media | | Marketing | 18.78 | 100 | 5.04% | 6.28% |
| RUSHA | Rush Enterprises | | Automobile | 58.95 | 100 | -16.32% | 6.15% |
| DDS | Dillard s | | Department | 497.93 | 80 | 6.43% | 6.06% |
| ABG | Asbury Automotive | | Automobile | 243.18 | 80 | 4.90% | 6.02% |
| SBUX | Starbucks | | Restaurants | 94.18 | 60 | 1.70% | 5.83% |
| SCHL | Scholastic | | Publishing | 26.35 | 80 | 2.00% | 5.82% |
| RHI | Robert Half | | Staffing | 36.66 | 60 | 2.92% | 5.77% |
| WINA | Winmark | | Retail | 414.77 | 90 | 2.73% | 5.77% |
| KFY | Korn Ferry | | Staffing | 74.52 | 90 | 3.15% | 5.76% |
| EEFT | Euronet Worldwide | | Services | 97.72 | 50 | 2.30% | 5.75% |
| ODP | Office Depot | | Retail | 20.31 | 100 | 1.94% | 5.73% |
| TNET | TriNet | | Services | 67.06 | 60 | 4.08% | 5.72% |
| LFUS | Littelfuse | | Retail | 263.42 | 90 | 1.34% | 5.71% |
| MED | Medifast | | Retail | 13.70 | 60 | 5.38% | 5.71% |
| GCO | Genesco | | Apparel | 27.15 | 100 | 5.09% | 5.68% |
| BJRI | BJ s | | Restaurants | 36.06 | 50 | 3.08% | 5.53% |
| ACTG | Acacia Research | | Services | 3.44 | 20 | 2.13% | 5.52% |
| AEO | American Eagle | | Apparel | 13.52 | 100 | 4.23% | 5.46% |
| For chart view version of above stock list: Chart View ➞ 0 - 25 , 25 - 50 , 50 - 75 , 75 - 100 , 100 - 125 , 125 - 150 , 150 - 175 , 175 - 200 , 200 - 225 , 225 - 250 , 250 - 275 , 275 - 300 | ||
 | Click To Change The Sort Order: By Market Cap or Company Size Performance: Year-to-date, Week and Day |  |
|
Get the most comprehensive stock market coverage daily at 12Stocks.com ➞ Best Stocks Today ➞ Best Stocks Weekly ➞ Best Stocks Year-to-Date ➞ Best Stocks Trends ➞  Best Stocks Today 12Stocks.com Best Nasdaq Stocks ➞ Best S&P 500 Stocks ➞ Best Tech Stocks ➞ Best Biotech Stocks ➞ |
| Detailed Overview of Consumer Services Stocks |
| Consumer Services Technical Overview, Leaders & Laggards, Top Consumer Services ETF Funds & Detailed Consumer Services Stocks List, Charts, Trends & More |
| Consumer Services Sector: Technical Analysis, Trends & YTD Performance | |
| Consumer Services sector is composed of stocks
from retail, entertainment, media/publishing, consumer goods
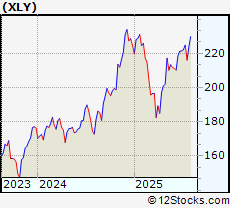
and services subsectors. Consumer Services sector, as represented by XLY, an exchange-traded fund [ETF] that holds basket of Consumer Services stocks (e.g, Walmart, Alibaba) is up by 2.95% and is currently underperforming the overall market by -7.38% year-to-date. Below is a quick view of Technical charts and trends: |
|
 XLY Weekly Chart |
|
| Long Term Trend: Very Good | |
| Medium Term Trend: Very Good | |
 XLY Daily Chart |
|
| Short Term Trend: Very Good | |
| Overall Trend Score: 100 | |
| YTD Performance: 2.95% | |
| **Trend Scores & Views Are Only For Educational Purposes And Not For Investing | |
| 12Stocks.com: Top Performing Consumer Services Sector Stocks | ||||||||||||||||||||||||||||||||||||||||||||||||
 The top performing Consumer Services sector stocks year to date are
Now, more recently, over last week, the top performing Consumer Services sector stocks on the move are


|
||||||||||||||||||||||||||||||||||||||||||||||||
| 12Stocks.com: Investing in Consumer Services Sector using Exchange Traded Funds | |
|
The following table shows list of key exchange traded funds (ETF) that
help investors track Consumer Services Index. For detailed view, check out our ETF Funds section of our website. Quick View: Move mouse or cursor over ETF symbol (ticker) to view short-term Technical chart and over ETF name to view long term chart. Click on ticker or stock name for detailed view. Click on to add stock symbol to your watchlist and to view watchlist. |
12Stocks.com List of ETFs that track Consumer Services Index
| Ticker | ETF Name | Watchlist | Recent Price | Smart Investing & Trading Score | Change % | Week % | Year-to-date % |
| XLY | Consumer Discret Sel | | 229.85 | 100 | 2.01 | 2.86 | 2.95% |
| RTH | Retail | | 247.67 | 100 | 0.63 | 0.8 | 10.46% |
| XRT | Retail | | 85.03 | 100 | 2.54 | 4.47 | 7.4% |
| IYK | Consumer Goods | | 70.39 | 70 | 0.37 | 1.49 | 8.38% |
| UCC | Consumer Services | | 49.99 | 100 | 2.96 | 5.78 | -2.73% |
| SCC | Short Consumer Services | | 15.90 | 0 | -19.86 | -5.49 | -12.44% |
| UGE | Consumer Goods | | 19.18 | 70 | 1.05 | 2.4 | 7.27% |
| 12Stocks.com: Charts, Trends, Fundamental Data and Performances of Consumer Services Stocks | |
|
We now take in-depth look at all Consumer Services stocks including charts, multi-period performances and overall trends (as measured by Smart Investing & Trading Score). One can sort Consumer Services stocks (click link to choose) by Daily, Weekly and by Year-to-Date performances. Also, one can sort by size of the company or by market capitalization. |
| Select Your Default Chart Type: | |||||
| |||||
| Click on stock symbol or name for detailed view. Click on to add stock symbol to your watchlist and to view watchlist. Quick View: Move mouse or cursor over "Daily" to quickly view daily Technical stock chart and over "Weekly" to view weekly Technical stock chart. | |||||

 | DXPE DXP Enterprises, Inc. |
| Sector: Services & Goods | |
| SubSector: Industrial Equipment Wholesale | |
| MarketCap: 243.758 Millions | |
| Recent Price: 119.78 Smart Investing & Trading Score: 80 | |
| Day Percent Change: 3.67% Day Change: 1.84 | |
| Week Change: 6.58% Year-to-date Change: 45.0% | |
| DXPE Links: Profile News Message Board | |
| Charts:- Daily , Weekly | |
| Add DXPE to Watchlist: View: Get Complete DXPE Trend Analysis ➞ | |
 | VAC Marriott Vacations Worldwide Corporation |
| Sector: Services & Goods | |
| SubSector: Resorts & Casinos | |
| MarketCap: 2173.54 Millions | |
| Recent Price: 76.83 Smart Investing & Trading Score: 70 | |
| Day Percent Change: 2.56% Day Change: 1.85 | |
| Week Change: 6.44% Year-to-date Change: -12.5% | |
| VAC Links: Profile News Message Board | |
| Charts:- Daily , Weekly | |
| Add VAC to Watchlist: View: Get Complete VAC Trend Analysis ➞ | |
 | LYV Live Nation Entertainment, Inc. |
| Sector: Services & Goods | |
| SubSector: Entertainment - Diversified | |
| MarketCap: 8457.17 Millions | |
| Recent Price: 158.87 Smart Investing & Trading Score: 80 | |
| Day Percent Change: 0.88% Day Change: 0.84 | |
| Week Change: 6.42% Year-to-date Change: 22.7% | |
| LYV Links: Profile News Message Board | |
| Charts:- Daily , Weekly | |
| Add LYV to Watchlist: View: Get Complete LYV Trend Analysis ➞ | |
 | PRAA PRA Group, Inc. |
| Sector: Services & Goods | |
| SubSector: Business Services | |
| MarketCap: 1290.32 Millions | |
| Recent Price: 16.63 Smart Investing & Trading Score: 90 | |
| Day Percent Change: 5.58% Day Change: 1.21 | |
| Week Change: 6.4% Year-to-date Change: -20.4% | |
| PRAA Links: Profile News Message Board | |
| Charts:- Daily , Weekly | |
| Add PRAA to Watchlist: View: Get Complete PRAA Trend Analysis ➞ | |
 | CCO Clear Channel Outdoor Holdings, Inc. |
| Sector: Services & Goods | |
| SubSector: Marketing Services | |
| MarketCap: 312.715 Millions | |
| Recent Price: 1.17 Smart Investing & Trading Score: 80 | |
| Day Percent Change: -5.13% Day Change: -0.08 | |
| Week Change: 6.36% Year-to-date Change: -14.6% | |
| CCO Links: Profile News Message Board | |
| Charts:- Daily , Weekly | |
| Add CCO to Watchlist: View: Get Complete CCO Trend Analysis ➞ | |
 | LAD Lithia Motors, Inc. |
| Sector: Services & Goods | |
| SubSector: Auto Dealerships | |
| MarketCap: 1727.21 Millions | |
| Recent Price: 315.08 Smart Investing & Trading Score: 70 | |
| Day Percent Change: -0.55% Day Change: -1.66 | |
| Week Change: 6.32% Year-to-date Change: -11.4% | |
| LAD Links: Profile News Message Board | |
| Charts:- Daily , Weekly | |
| Add LAD to Watchlist: View: Get Complete LAD Trend Analysis ➞ | |
 | HURN Huron Consulting Group Inc. |
| Sector: Services & Goods | |
| SubSector: Management Services | |
| MarketCap: 968.645 Millions | |
| Recent Price: 137.00 Smart Investing & Trading Score: 70 | |
| Day Percent Change: 7.92% Day Change: 7.9 | |
| Week Change: 6.28% Year-to-date Change: 10.3% | |
| HURN Links: Profile News Message Board | |
| Charts:- Daily , Weekly | |
| Add HURN to Watchlist: View: Get Complete HURN Trend Analysis ➞ | |
 | OUT Outfront Media Inc. |
| Sector: Services & Goods | |
| SubSector: Marketing Services | |
| MarketCap: 1388.15 Millions | |
| Recent Price: 18.78 Smart Investing & Trading Score: 100 | |
| Day Percent Change: 5.04% Day Change: 0.8 | |
| Week Change: 6.28% Year-to-date Change: 7.1% | |
| OUT Links: Profile News Message Board | |
| Charts:- Daily , Weekly | |
| Add OUT to Watchlist: View: Get Complete OUT Trend Analysis ➞ | |
 | RUSHA Rush Enterprises, Inc. |
| Sector: Services & Goods | |
| SubSector: Auto Dealerships | |
| MarketCap: 1183.21 Millions | |
| Recent Price: 58.95 Smart Investing & Trading Score: 100 | |
| Day Percent Change: -16.32% Day Change: -10.46 | |
| Week Change: 6.15% Year-to-date Change: 8.7% | |
| RUSHA Links: Profile News Message Board | |
| Charts:- Daily , Weekly | |
| Add RUSHA to Watchlist: View: Get Complete RUSHA Trend Analysis ➞ | |
 | DDS Dillard s, Inc. |
| Sector: Services & Goods | |
| SubSector: Department Stores | |
| MarketCap: 1170.82 Millions | |
| Recent Price: 497.93 Smart Investing & Trading Score: 80 | |
| Day Percent Change: 6.43% Day Change: 21.65 | |
| Week Change: 6.06% Year-to-date Change: 15.5% | |
| DDS Links: Profile News Message Board | |
| Charts:- Daily , Weekly | |
| Add DDS to Watchlist: View: Get Complete DDS Trend Analysis ➞ | |
 | ABG Asbury Automotive Group, Inc. |
| Sector: Services & Goods | |
| SubSector: Auto Dealerships | |
| MarketCap: 1203.21 Millions | |
| Recent Price: 243.18 Smart Investing & Trading Score: 80 | |
| Day Percent Change: 4.9% Day Change: 11.28 | |
| Week Change: 6.02% Year-to-date Change: 0.1% | |
| ABG Links: Profile News Message Board | |
| Charts:- Daily , Weekly | |
| Add ABG to Watchlist: View: Get Complete ABG Trend Analysis ➞ | |
 | SBUX Starbucks Corporation |
| Sector: Services & Goods | |
| SubSector: Specialty Eateries | |
| MarketCap: 74909.7 Millions | |
| Recent Price: 94.18 Smart Investing & Trading Score: 60 | |
| Day Percent Change: 1.7% Day Change: 1.57 | |
| Week Change: 5.83% Year-to-date Change: 4.5% | |
| SBUX Links: Profile News Message Board | |
| Charts:- Daily , Weekly | |
| Add SBUX to Watchlist: View: Get Complete SBUX Trend Analysis ➞ | |
 | SCHL Scholastic Corporation |
| Sector: Services & Goods | |
| SubSector: Publishing - Books | |
| MarketCap: 791 Millions | |
| Recent Price: 26.35 Smart Investing & Trading Score: 80 | |
| Day Percent Change: 2% Day Change: 0.62 | |
| Week Change: 5.82% Year-to-date Change: 26.2% | |
| SCHL Links: Profile News Message Board | |
| Charts:- Daily , Weekly | |
| Add SCHL to Watchlist: View: Get Complete SCHL Trend Analysis ➞ | |
 | RHI Robert Half International Inc. |
| Sector: Services & Goods | |
| SubSector: Staffing & Outsourcing Services | |
| MarketCap: 4302 Millions | |
| Recent Price: 36.66 Smart Investing & Trading Score: 60 | |
| Day Percent Change: 2.92% Day Change: 1.81 | |
| Week Change: 5.77% Year-to-date Change: -46.8% | |
| RHI Links: Profile News Message Board | |
| Charts:- Daily , Weekly | |
| Add RHI to Watchlist: View: Get Complete RHI Trend Analysis ➞ | |
 | WINA Winmark Corporation |
| Sector: Services & Goods | |
| SubSector: Specialty Retail, Other | |
| MarketCap: 520.444 Millions | |
| Recent Price: 414.77 Smart Investing & Trading Score: 90 | |
| Day Percent Change: 2.73% Day Change: 9.88 | |
| Week Change: 5.77% Year-to-date Change: 6.0% | |
| WINA Links: Profile News Message Board | |
| Charts:- Daily , Weekly | |
| Add WINA to Watchlist: View: Get Complete WINA Trend Analysis ➞ | |
 | KFY Korn Ferry |
| Sector: Services & Goods | |
| SubSector: Staffing & Outsourcing Services | |
| MarketCap: 1534.28 Millions | |
| Recent Price: 74.52 Smart Investing & Trading Score: 90 | |
| Day Percent Change: 3.15% Day Change: 2.2 | |
| Week Change: 5.76% Year-to-date Change: 12.0% | |
| KFY Links: Profile News Message Board | |
| Charts:- Daily , Weekly | |
| Add KFY to Watchlist: View: Get Complete KFY Trend Analysis ➞ | |
 | EEFT Euronet Worldwide, Inc. |
| Sector: Services & Goods | |
| SubSector: Business Services | |
| MarketCap: 4809.62 Millions | |
| Recent Price: 97.72 Smart Investing & Trading Score: 50 | |
| Day Percent Change: 2.3% Day Change: 2.38 | |
| Week Change: 5.75% Year-to-date Change: -5.0% | |
| EEFT Links: Profile News Message Board | |
| Charts:- Daily , Weekly | |
| Add EEFT to Watchlist: View: Get Complete EEFT Trend Analysis ➞ | |
 | ODP Office Depot, Inc. |
| Sector: Services & Goods | |
| SubSector: Specialty Retail, Other | |
| MarketCap: 1024.44 Millions | |
| Recent Price: 20.31 Smart Investing & Trading Score: 100 | |
| Day Percent Change: 1.94% Day Change: 0.56 | |
| Week Change: 5.73% Year-to-date Change: -10.7% | |
| ODP Links: Profile News Message Board | |
| Charts:- Daily , Weekly | |
| Add ODP to Watchlist: View: Get Complete ODP Trend Analysis ➞ | |
 | TNET TriNet Group, Inc. |
| Sector: Services & Goods | |
| SubSector: Business Services | |
| MarketCap: 2648.72 Millions | |
| Recent Price: 67.06 Smart Investing & Trading Score: 60 | |
| Day Percent Change: 4.08% Day Change: 4.02 | |
| Week Change: 5.72% Year-to-date Change: -25.4% | |
| TNET Links: Profile News Message Board | |
| Charts:- Daily , Weekly | |
| Add TNET to Watchlist: View: Get Complete TNET Trend Analysis ➞ | |
 | LFUS Littelfuse, Inc. |
| Sector: Services & Goods | |
| SubSector: Electronics Wholesale | |
| MarketCap: 2965.23 Millions | |
| Recent Price: 263.42 Smart Investing & Trading Score: 90 | |
| Day Percent Change: 1.34% Day Change: 3.61 | |
| Week Change: 5.71% Year-to-date Change: 12.5% | |
| LFUS Links: Profile News Message Board | |
| Charts:- Daily , Weekly | |
| Add LFUS to Watchlist: View: Get Complete LFUS Trend Analysis ➞ | |
 | MED Medifast, Inc. |
| Sector: Services & Goods | |
| SubSector: Specialty Retail, Other | |
| MarketCap: 681.044 Millions | |
| Recent Price: 13.70 Smart Investing & Trading Score: 60 | |
| Day Percent Change: 5.38% Day Change: 1.02 | |
| Week Change: 5.71% Year-to-date Change: -22.3% | |
| MED Links: Profile News Message Board | |
| Charts:- Daily , Weekly | |
| Add MED to Watchlist: View: Get Complete MED Trend Analysis ➞ | |
 | GCO Genesco Inc. |
| Sector: Services & Goods | |
| SubSector: Apparel Stores | |
| MarketCap: 187.508 Millions | |
| Recent Price: 27.15 Smart Investing & Trading Score: 100 | |
| Day Percent Change: 5.09% Day Change: 1.51 | |
| Week Change: 5.68% Year-to-date Change: -36.5% | |
| GCO Links: Profile News Message Board | |
| Charts:- Daily , Weekly | |
| Add GCO to Watchlist: View: Get Complete GCO Trend Analysis ➞ | |
 | BJRI BJ s Restaurants, Inc. |
| Sector: Services & Goods | |
| SubSector: Restaurants | |
| MarketCap: 183.67 Millions | |
| Recent Price: 36.06 Smart Investing & Trading Score: 50 | |
| Day Percent Change: 3.08% Day Change: 0.98 | |
| Week Change: 5.53% Year-to-date Change: 2.6% | |
| BJRI Links: Profile News Message Board | |
| Charts:- Daily , Weekly | |
| Add BJRI to Watchlist: View: Get Complete BJRI Trend Analysis ➞ | |
 | ACTG Acacia Research Corporation |
| Sector: Services & Goods | |
| SubSector: Business Services | |
| MarketCap: 112.782 Millions | |
| Recent Price: 3.44 Smart Investing & Trading Score: 20 | |
| Day Percent Change: 2.13% Day Change: 0.1 | |
| Week Change: 5.52% Year-to-date Change: -20.7% | |
| ACTG Links: Profile News Message Board | |
| Charts:- Daily , Weekly | |
| Add ACTG to Watchlist: View: Get Complete ACTG Trend Analysis ➞ | |
 | AEO American Eagle Outfitters, Inc. |
| Sector: Services & Goods | |
| SubSector: Apparel Stores | |
| MarketCap: 1577.08 Millions | |
| Recent Price: 13.52 Smart Investing & Trading Score: 100 | |
| Day Percent Change: 4.23% Day Change: 0.9 | |
| Week Change: 5.46% Year-to-date Change: -16.3% | |
| AEO Links: Profile News Message Board | |
| Charts:- Daily , Weekly | |
| Add AEO to Watchlist: View: Get Complete AEO Trend Analysis ➞ | |
| For tabular summary view of above stock list: Summary View ➞ 0 - 25 , 25 - 50 , 50 - 75 , 75 - 100 , 100 - 125 , 125 - 150 , 150 - 175 , 175 - 200 , 200 - 225 , 225 - 250 , 250 - 275 , 275 - 300 | ||
| Click To Change The Sort Order: By Market Cap or Company Size Performance: Year-to-date, Week and Day | |
| Select Chart Type: | ||
|
Best Stocks Today 12Stocks.com |
© 2025 12Stocks.com Terms & Conditions Privacy Contact Us
All Information Provided Only For Education And Not To Be Used For Investing or Trading. See Terms & Conditions


One More Thing ... Get Best Stocks Delivered Daily!
Never Ever Miss A Move With Our Top Ten Stocks Lists
Find Best Stocks In Any Market - Bull or Bear Market
Take A Peek At Our Top Ten Stocks Lists: Daily, Weekly, Year-to-Date & Top Trends
Find Best Stocks In Any Market - Bull or Bear Market
Take A Peek At Our Top Ten Stocks Lists: Daily, Weekly, Year-to-Date & Top Trends
Consumer Services Stocks With Best Up Trends [0-bearish to 100-bullish]: Daily Journal[100], Napco Security[100], Louisiana-Pacific [100], Ritchie Bros.[100], eBay [100], Graham [100], Fastenal [100], AECOM [100], Kelly Services[100], Wayfair [100], Gray Television[100]
Best Consumer Services Stocks Year-to-Date:
Willdan [210.66%], Kratos Defense[160.61%], Altisource Portfolio[97.94%], Gray Television[94.26%], Wayfair [77.55%], Noodles & [76.23%], VSE [73.56%], Sears [67.56%], eBay [64.06%], WNS ()[58.64%], Dollar General[55.7%] Best Consumer Services Stocks This Week:
Willdan [34.44%], Gray Television[33.03%], Park-Ohio [27.27%], TEGNA [27.26%], Etsy [24.72%], AMC Networks[22.47%], Deluxe [21.77%], Kohl s[19.15%], Petco Health[19%], Kelly Services[18.78%], CompX [18.12%] Best Consumer Services Stocks Daily:
CareDx [185.69%], Wingstop [150.46%], National CineMedia[112.46%], VSE [69.41%], Burlington Stores[66.03%], Myriad Genetics[64.88%], Costco Wholesale[58.1%], Daily Journal[57.5%], Texas Roadhouse[55.27%], Royal Caribbean[53.63%], CRA [53.26%]