
 Login Sign Up


| |||||
 |  | ||||

| 12Stocks.com Market Intelligence |
Best Consumer Services Stocks
| In a hurry? Services & Goods Stocks: Performance Trends Table, Stock Charts
Sort Consumer Services: Daily, Weekly, Year-to-Date, Market Cap & Trends. Filter Services & Goods stocks list by size: All Large Mid-Range Small |
| 12Stocks.com Consumer Services Stocks Performances & Trends Daily | |||||||||
|
|  The overall Smart Investing & Trading Score is 80 (0-bearish to 100-bullish) which puts Consumer Services sector in short term neutral to bullish trend. The Smart Investing & Trading Score from previous trading session is 90 and hence a deterioration of trend.
| ||||||||
Here are the Smart Investing & Trading Scores of the most requested Consumer Services stocks at 12Stocks.com (click stock name for detailed review):
|


| Consider signing up for our daily 12Stocks.com "Best Stocks Newsletter". You will never ever miss a big stock move again! |
| 12Stocks.com: Investing in Consumer Services sector with Stocks | |
|
The following table helps investors and traders sort through current performance and trends (as measured by Smart Investing & Trading Score) of various
stocks in the Consumer Services sector. Quick View: Move mouse or cursor over stock symbol (ticker) to view short-term Technical chart and over stock name to view long term chart. Click on  to add stock symbol to your watchlist and to add stock symbol to your watchlist and  to view watchlist. Click on any ticker or stock name for detailed market intelligence report for that stock. to view watchlist. Click on any ticker or stock name for detailed market intelligence report for that stock. |
12Stocks.com Performance of Stocks in Consumer Services Sector
| Ticker | Stock Name | Watchlist | Category | Recent Price | Smart Investing & Trading Score | Change % | Weekly Change% |
| GTN.A | GRAY TELEVSN |   | BRDCST-RADIO/TV | 7.85 | 0 | -7.65% | -49.32% |
| AXE | Anixter | | Equipment | 2.01 | 40 | 0.50% | -51.33% |
| SP | SP Plus | | Services | 25.77 | 30 | 1.50% | -52.25% |
| PLKI | Popeyes Louisiana | | Restaurants | 8.21 | 20 | 0.61% | -52.76% |
| CEB | CEB | | Services | 34.58 | 20 | -0.09% | -54.28% |
| KATE | Kate Spade | | Apparel | 50.16 | 0 | 3.96% | -55.55% |
| FRED | Freds | | Retail | 2.00 | 0 | 0.00% | -57.63% |
| VSI | Vitamin Shoppe | | Retail | 2.29 | 0 | 2.23% | -59.97% |
| XOXO | XO | | Retail | 2.29 | 10 | 2.23% | -59.97% |
| SECO | Secoo Holding | | Retail | 0.15 | 0 | -62.93% | -62.01% |
| STS | Supreme Industries | | Automotive | 3.46 | 10 | -3.62% | -63.62% |
| HMHC | Houghton Mifflin | | Education | 7.45 | 30 | 1.36% | -64.54% |
| ZOES | Zoes Kitchen | | Restaurants | 7.98 | 20 | 2.05% | -64.85% |
| BEL | Belmond | | Lodging | 35.00 | 30 | 1.04% | -65.97% |
| SONC | Sonic | | Restaurants | 23.33 | 0 | -0.26% | -67.36% |
| CSSEP | Chicken Soup | | Broadcasting | 0.40 | 10 | 6.67% | -67.48% |
| P | Pandora Media | | Broadcasting | 15.15 | 0 | -0.13% | -68.69% |
| CDI | CDI | | Staffing | 8.85 | 40 | 1.14% | -71.48% |
| JMBA | Jamba | | Restaurants | 8.85 | 40 | 1.14% | -71.48% |
| SFS | Smart & Final Stores | | Grocery | 6.60 | 30 | 5.26% | -82.78% |
| JOBS | 51job | | Staffing | 9.75 | 0 | -0.51% | -84.00% |
| MDP | Meredith | | Publishing | 8.47 | 0 | -0.24% | -85.64% |
| LL | Lumber Liquidators | | Retail | 0.11 | 0 | -86.96% | -86.42% |
| MYCC | ClubCorp | | Sporting | 8.11 | 0 | 0.50% | -86.44% |
| SRSC | Sears Canada | | Department | 1.02 | 10 | 0.99% | -87.22% |
| For chart view version of above stock list: Chart View ➞ 0 - 25 , 25 - 50 , 50 - 75 , 75 - 100 , 100 - 125 , 125 - 150 , 150 - 175 , 175 - 200 , 200 - 225 , 225 - 250 , 250 - 275 , 275 - 300 , 300 - 325 , 325 - 350 , 350 - 375 , 375 - 400 , 400 - 425 , 425 - 450 , 450 - 475 , 475 - 500 , 500 - 525 , 525 - 550 , 550 - 575 , 575 - 600 , 600 - 625 | ||
 | Click To Change The Sort Order: By Market Cap or Company Size Performance: Year-to-date, Week and Day |  |
|
Get the most comprehensive stock market coverage daily at 12Stocks.com ➞ Best Stocks Today ➞ Best Stocks Weekly ➞ Best Stocks Year-to-Date ➞ Best Stocks Trends ➞  Best Stocks Today 12Stocks.com Best Nasdaq Stocks ➞ Best S&P 500 Stocks ➞ Best Tech Stocks ➞ Best Biotech Stocks ➞ |
| Detailed Overview of Consumer Services Stocks |
| Consumer Services Technical Overview, Leaders & Laggards, Top Consumer Services ETF Funds & Detailed Consumer Services Stocks List, Charts, Trends & More |
| Consumer Services Sector: Technical Analysis, Trends & YTD Performance | |
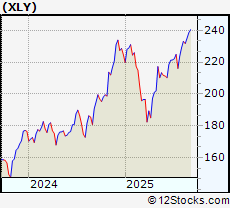
| Consumer Services sector is composed of stocks
from retail, entertainment, media/publishing, consumer goods
and services subsectors. Consumer Services sector, as represented by XLY, an exchange-traded fund [ETF] that holds basket of Consumer Services stocks (e.g, Walmart, Alibaba) is up by 9.14834% and is currently underperforming the overall market by -4.71176% year-to-date. Below is a quick view of Technical charts and trends: |
|
 XLY Weekly Chart |
|
| Long Term Trend: Very Good | |
| Medium Term Trend: Good | |
 XLY Daily Chart |
|
| Short Term Trend: Not Good | |
| Overall Trend Score: 80 | |
| YTD Performance: 9.14834% | |
| **Trend Scores & Views Are Only For Educational Purposes And Not For Investing | |
| 12Stocks.com: Top Performing Consumer Services Sector Stocks | ||||||||||||||||||||||||||||||||||||||||||||||||
 The top performing Consumer Services sector stocks year to date are
Now, more recently, over last week, the top performing Consumer Services sector stocks on the move are


|
||||||||||||||||||||||||||||||||||||||||||||||||
| 12Stocks.com: Investing in Consumer Services Sector using Exchange Traded Funds | |
|
The following table shows list of key exchange traded funds (ETF) that
help investors track Consumer Services Index. For detailed view, check out our ETF Funds section of our website. Quick View: Move mouse or cursor over ETF symbol (ticker) to view short-term Technical chart and over ETF name to view long term chart. Click on ticker or stock name for detailed view. Click on to add stock symbol to your watchlist and to view watchlist. |
12Stocks.com List of ETFs that track Consumer Services Index
| Ticker | ETF Name | Watchlist | Recent Price | Smart Investing & Trading Score | Change % | Week % | Year-to-date % |
| PMR | Retail | | 40.96 | 70 | -0.0244081 | 2.86288 | 0% |
| 12Stocks.com: Charts, Trends, Fundamental Data and Performances of Consumer Services Stocks | |
|
We now take in-depth look at all Consumer Services stocks including charts, multi-period performances and overall trends (as measured by Smart Investing & Trading Score). One can sort Consumer Services stocks (click link to choose) by Daily, Weekly and by Year-to-Date performances. Also, one can sort by size of the company or by market capitalization. |
| Select Your Default Chart Type: | |||||
| |||||
| Click on stock symbol or name for detailed view. Click on to add stock symbol to your watchlist and to view watchlist. Quick View: Move mouse or cursor over "Daily" to quickly view daily Technical stock chart and over "Weekly" to view weekly Technical stock chart. | |||||

 | GTN.A GRAY TELEVSN -A |
| Sector: Services & Goods | |
| SubSector: BRDCST-RADIO/TV | |
| MarketCap: 253.421 Millions | |
| Recent Price: 7.85 Smart Investing & Trading Score: 0 | |
| Day Percent Change: -7.64706% Day Change: -9999 | |
| Week Change: -49.3221% Year-to-date Change: 0.0% | |
| GTN.A Links: Profile News Message Board | |
| Charts:- Daily , Weekly | |
| Add GTN.A to Watchlist: View: Get Complete GTN.A Trend Analysis ➞ | |
 | AXE Anixter International Inc. |
| Sector: Services & Goods | |
| SubSector: Industrial Equipment Wholesale | |
| MarketCap: 2840.58 Millions | |
| Recent Price: 2.01 Smart Investing & Trading Score: 40 | |
| Day Percent Change: 0.5% Day Change: -9999 | |
| Week Change: -51.3317% Year-to-date Change: 0.0% | |
| AXE Links: Profile News Message Board | |
| Charts:- Daily , Weekly | |
| Add AXE to Watchlist: View: Get Complete AXE Trend Analysis ➞ | |
 | SP SP Plus Corporation |
| Sector: Services & Goods | |
| SubSector: Management Services | |
| MarketCap: 494.545 Millions | |
| Recent Price: 25.77 Smart Investing & Trading Score: 30 | |
| Day Percent Change: 1.49665% Day Change: -9999 | |
| Week Change: -52.2513% Year-to-date Change: 0.0% | |
| SP Links: Profile News Message Board | |
| Charts:- Daily , Weekly | |
| Add SP to Watchlist: View: Get Complete SP Trend Analysis ➞ | |
 | PLKI Popeyes Louisiana Kitchen, Inc. |
| Sector: Services & Goods | |
| SubSector: Restaurants | |
| MarketCap: 1636.67 Millions | |
| Recent Price: 8.21 Smart Investing & Trading Score: 20 | |
| Day Percent Change: 0.612745% Day Change: -9999 | |
| Week Change: -52.7618% Year-to-date Change: 0.0% | |
| PLKI Links: Profile News Message Board | |
| Charts:- Daily , Weekly | |
| Add PLKI to Watchlist: View: Get Complete PLKI Trend Analysis ➞ | |
 | CEB CEB Inc. |
| Sector: Services & Goods | |
| SubSector: Management Services | |
| MarketCap: 2547.93 Millions | |
| Recent Price: 34.58 Smart Investing & Trading Score: 20 | |
| Day Percent Change: -0.0866802% Day Change: -9999 | |
| Week Change: -54.2774% Year-to-date Change: 0.0% | |
| CEB Links: Profile News Message Board | |
| Charts:- Daily , Weekly | |
| Add CEB to Watchlist: View: Get Complete CEB Trend Analysis ➞ | |
 | KATE Kate Spade & Company |
| Sector: Services & Goods | |
| SubSector: Textile - Apparel Clothing | |
| MarketCap: 3084.31 Millions | |
| Recent Price: 50.16 Smart Investing & Trading Score: 0 | |
| Day Percent Change: 3.95855% Day Change: -9999 | |
| Week Change: -55.5516% Year-to-date Change: 0.0% | |
| KATE Links: Profile News Message Board | |
| Charts:- Daily , Weekly | |
| Add KATE to Watchlist: View: Get Complete KATE Trend Analysis ➞ | |
 | FRED Freds, Inc. |
| Sector: Services & Goods | |
| SubSector: Discount, Variety Stores | |
| MarketCap: 554.01 Millions | |
| Recent Price: 2.00 Smart Investing & Trading Score: 0 | |
| Day Percent Change: 0% Day Change: -9999 | |
| Week Change: -57.6271% Year-to-date Change: 0.0% | |
| FRED Links: Profile News Message Board | |
| Charts:- Daily , Weekly | |
| Add FRED to Watchlist: View: Get Complete FRED Trend Analysis ➞ | |
 | VSI Vitamin Shoppe, Inc. |
| Sector: Services & Goods | |
| SubSector: Specialty Retail, Other | |
| MarketCap: 450.98 Millions | |
| Recent Price: 2.29 Smart Investing & Trading Score: 0 | |
| Day Percent Change: 2.23214% Day Change: -9999 | |
| Week Change: -59.965% Year-to-date Change: 0.0% | |
| VSI Links: Profile News Message Board | |
| Charts:- Daily , Weekly | |
| Add VSI to Watchlist: View: Get Complete VSI Trend Analysis ➞ | |
 | XOXO XO Group Inc. |
| Sector: Services & Goods | |
| SubSector: Specialty Retail, Other | |
| MarketCap: 450.63 Millions | |
| Recent Price: 2.29 Smart Investing & Trading Score: 10 | |
| Day Percent Change: 2.23214% Day Change: -9999 | |
| Week Change: -59.965% Year-to-date Change: 0.0% | |
| XOXO Links: Profile News Message Board | |
| Charts:- Daily , Weekly | |
| Add XOXO to Watchlist: View: Get Complete XOXO Trend Analysis ➞ | |
 | SECO Secoo Holding Limited |
| Sector: Services & Goods | |
| SubSector: Specialty Retail, Other | |
| MarketCap: 209.144 Millions | |
| Recent Price: 0.15 Smart Investing & Trading Score: 0 | |
| Day Percent Change: -62.9291% Day Change: -9999 | |
| Week Change: -62.0096% Year-to-date Change: 0.0% | |
| SECO Links: Profile News Message Board | |
| Charts:- Daily , Weekly | |
| Add SECO to Watchlist: View: Get Complete SECO Trend Analysis ➞ | |
 | STS Supreme Industries, Inc. |
| Sector: Services & Goods | |
| SubSector: Trucks & Other Vehicles | |
| MarketCap: 335.57 Millions | |
| Recent Price: 3.46 Smart Investing & Trading Score: 10 | |
| Day Percent Change: -3.62117% Day Change: -9999 | |
| Week Change: -63.6172% Year-to-date Change: 0.0% | |
| STS Links: Profile News Message Board | |
| Charts:- Daily , Weekly | |
| Add STS to Watchlist: View: Get Complete STS Trend Analysis ➞ | |
 | HMHC Houghton Mifflin Harcourt Company |
| Sector: Services & Goods | |
| SubSector: Education & Training Services | |
| MarketCap: 316.706 Millions | |
| Recent Price: 7.45 Smart Investing & Trading Score: 30 | |
| Day Percent Change: 1.36054% Day Change: -9999 | |
| Week Change: -64.5407% Year-to-date Change: 0.0% | |
| HMHC Links: Profile News Message Board | |
| Charts:- Daily , Weekly | |
| Add HMHC to Watchlist: View: Get Complete HMHC Trend Analysis ➞ | |
 | ZOES Zoes Kitchen, Inc. |
| Sector: Services & Goods | |
| SubSector: Restaurants | |
| MarketCap: 323.88 Millions | |
| Recent Price: 7.98 Smart Investing & Trading Score: 20 | |
| Day Percent Change: 2.04604% Day Change: -9999 | |
| Week Change: -64.8458% Year-to-date Change: 0.0% | |
| ZOES Links: Profile News Message Board | |
| Charts:- Daily , Weekly | |
| Add ZOES to Watchlist: View: Get Complete ZOES Trend Analysis ➞ | |
 | BEL Belmond Ltd. |
| Sector: Services & Goods | |
| SubSector: Lodging | |
| MarketCap: 1431.91 Millions | |
| Recent Price: 35.00 Smart Investing & Trading Score: 30 | |
| Day Percent Change: 1.03926% Day Change: -9999 | |
| Week Change: -65.9732% Year-to-date Change: 0.0% | |
| BEL Links: Profile News Message Board | |
| Charts:- Daily , Weekly | |
| Add BEL to Watchlist: View: Get Complete BEL Trend Analysis ➞ | |
 | SONC Sonic Corp. |
| Sector: Services & Goods | |
| SubSector: Restaurants | |
| MarketCap: 1031.9 Millions | |
| Recent Price: 23.33 Smart Investing & Trading Score: 0 | |
| Day Percent Change: -0.25652% Day Change: -9999 | |
| Week Change: -67.3569% Year-to-date Change: 0.0% | |
| SONC Links: Profile News Message Board | |
| Charts:- Daily , Weekly | |
| Add SONC to Watchlist: View: Get Complete SONC Trend Analysis ➞ | |
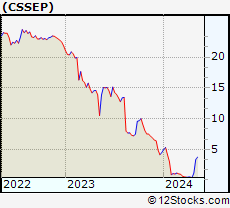 | CSSEP Chicken Soup for the Soul Entertainment, Inc. |
| Sector: Services & Goods | |
| SubSector: Broadcasting - TV | |
| MarketCap: 195.763 Millions | |
| Recent Price: 0.40 Smart Investing & Trading Score: 10 | |
| Day Percent Change: 6.66667% Day Change: -9999 | |
| Week Change: -67.4797% Year-to-date Change: 0.0% | |
| CSSEP Links: Profile News Message Board | |
| Charts:- Daily , Weekly | |
| Add CSSEP to Watchlist: View: Get Complete CSSEP Trend Analysis ➞ | |
 | P Pandora Media, Inc. |
| Sector: Services & Goods | |
| SubSector: Broadcasting - Radio | |
| MarketCap: 2610 Millions | |
| Recent Price: 15.15 Smart Investing & Trading Score: 0 | |
| Day Percent Change: -0.131839% Day Change: -9999 | |
| Week Change: -68.6919% Year-to-date Change: 0.0% | |
| P Links: Profile News Message Board | |
| Charts:- Daily , Weekly | |
| Add P to Watchlist: View: Get Complete P Trend Analysis ➞ | |
 | CDI CDI Corp. |
| Sector: Services & Goods | |
| SubSector: Staffing & Outsourcing Services | |
| MarketCap: 149.5 Millions | |
| Recent Price: 8.85 Smart Investing & Trading Score: 40 | |
| Day Percent Change: 1.14286% Day Change: -9999 | |
| Week Change: -71.4792% Year-to-date Change: 0.0% | |
| CDI Links: Profile News Message Board | |
| Charts:- Daily , Weekly | |
| Add CDI to Watchlist: View: Get Complete CDI Trend Analysis ➞ | |
 | JMBA Jamba, Inc. |
| Sector: Services & Goods | |
| SubSector: Restaurants | |
| MarketCap: 149.75 Millions | |
| Recent Price: 8.85 Smart Investing & Trading Score: 40 | |
| Day Percent Change: 1.14286% Day Change: -9999 | |
| Week Change: -71.4792% Year-to-date Change: 0.0% | |
| JMBA Links: Profile News Message Board | |
| Charts:- Daily , Weekly | |
| Add JMBA to Watchlist: View: Get Complete JMBA Trend Analysis ➞ | |
 | SFS Smart & Final Stores, Inc. |
| Sector: Services & Goods | |
| SubSector: Grocery Stores | |
| MarketCap: 857.96 Millions | |
| Recent Price: 6.60 Smart Investing & Trading Score: 30 | |
| Day Percent Change: 5.26316% Day Change: -9999 | |
| Week Change: -82.7811% Year-to-date Change: 0.0% | |
| SFS Links: Profile News Message Board | |
| Charts:- Daily , Weekly | |
| Add SFS to Watchlist: View: Get Complete SFS Trend Analysis ➞ | |
 | JOBS 51job, Inc. |
| Sector: Services & Goods | |
| SubSector: Staffing & Outsourcing Services | |
| MarketCap: 4232.18 Millions | |
| Recent Price: 9.75 Smart Investing & Trading Score: 0 | |
| Day Percent Change: -0.510204% Day Change: -9999 | |
| Week Change: -84.0007% Year-to-date Change: 0.0% | |
| JOBS Links: Profile News Message Board | |
| Charts:- Daily , Weekly | |
| Add JOBS to Watchlist: View: Get Complete JOBS Trend Analysis ➞ | |
 | MDP Meredith Corporation |
| Sector: Services & Goods | |
| SubSector: Publishing - Periodicals | |
| MarketCap: 825.6 Millions | |
| Recent Price: 8.47 Smart Investing & Trading Score: 0 | |
| Day Percent Change: -0.235571% Day Change: -9999 | |
| Week Change: -85.6441% Year-to-date Change: 0.0% | |
| MDP Links: Profile News Message Board | |
| Charts:- Daily , Weekly | |
| Add MDP to Watchlist: View: Get Complete MDP Trend Analysis ➞ | |
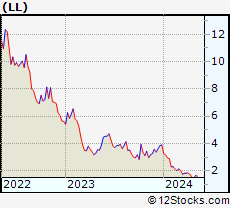 | LL Lumber Liquidators Holdings, Inc. |
| Sector: Services & Goods | |
| SubSector: Home Improvement Stores | |
| MarketCap: 143.352 Millions | |
| Recent Price: 0.11 Smart Investing & Trading Score: 0 | |
| Day Percent Change: -86.9637% Day Change: -9999 | |
| Week Change: -86.4164% Year-to-date Change: 0.0% | |
| LL Links: Profile News Message Board | |
| Charts:- Daily , Weekly | |
| Add LL to Watchlist: View: Get Complete LL Trend Analysis ➞ | |
 | MYCC ClubCorp Holdings, Inc. |
| Sector: Services & Goods | |
| SubSector: Sporting Activities | |
| MarketCap: 1066.62 Millions | |
| Recent Price: 8.11 Smart Investing & Trading Score: 0 | |
| Day Percent Change: 0.495663% Day Change: -9999 | |
| Week Change: -86.4427% Year-to-date Change: 0.0% | |
| MYCC Links: Profile News Message Board | |
| Charts:- Daily , Weekly | |
| Add MYCC to Watchlist: View: Get Complete MYCC Trend Analysis ➞ | |
 | SRSC Sears Canada Inc. |
| Sector: Services & Goods | |
| SubSector: Department Stores | |
| MarketCap: 132.44 Millions | |
| Recent Price: 1.02 Smart Investing & Trading Score: 10 | |
| Day Percent Change: 0.990099% Day Change: -9999 | |
| Week Change: -87.218% Year-to-date Change: 0.0% | |
| SRSC Links: Profile News Message Board | |
| Charts:- Daily , Weekly | |
| Add SRSC to Watchlist: View: Get Complete SRSC Trend Analysis ➞ | |
| For tabular summary view of above stock list: Summary View ➞ 0 - 25 , 25 - 50 , 50 - 75 , 75 - 100 , 100 - 125 , 125 - 150 , 150 - 175 , 175 - 200 , 200 - 225 , 225 - 250 , 250 - 275 , 275 - 300 , 300 - 325 , 325 - 350 , 350 - 375 , 375 - 400 , 400 - 425 , 425 - 450 , 450 - 475 , 475 - 500 , 500 - 525 , 525 - 550 , 550 - 575 , 575 - 600 , 600 - 625 | ||
| Click To Change The Sort Order: By Market Cap or Company Size Performance: Year-to-date, Week and Day | |
| Select Chart Type: | ||
|
Best Stocks Today 12Stocks.com |
© 2025 12Stocks.com Terms & Conditions Privacy Contact Us
All Information Provided Only For Education And Not To Be Used For Investing or Trading. See Terms & Conditions


One More Thing ... Get Best Stocks Delivered Daily!
Never Ever Miss A Move With Our Top Ten Stocks Lists
Find Best Stocks In Any Market - Bull or Bear Market
Take A Peek At Our Top Ten Stocks Lists: Daily, Weekly, Year-to-Date & Top Trends
Find Best Stocks In Any Market - Bull or Bear Market
Take A Peek At Our Top Ten Stocks Lists: Daily, Weekly, Year-to-Date & Top Trends
Consumer Services Stocks With Best Up Trends [0-bearish to 100-bullish]: SES AI[100], QuantumScape Corp[100], Whole Foods[100], Net 1[100], China Automotive[100], Flexsteel Industries[100], Hooker Furnishings[100], Urban One[100], National Vision[100], Resources Connection[100], LiveWire [100]
Best Consumer Services Stocks Year-to-Date:
WW [2010.49%], Nova Lifestyle[688.863%], ThredUp [656.028%], Lucid [576.568%], Vroom [455.146%], China Yuchai[299.164%], Luxottica [210.802%], Jumia Technologies[205.641%], Cooper-Standard [190.097%], Niu Technologies[150%], National Vision[145.404%] Best Consumer Services Stocks This Week:
Party City[37593.9%], Companhia Brasileira[18587.4%], Conn s[16420.1%], Rite Aid[10214.6%], Arctic Cat[2387.5%], Chico s[2120.53%], Multi-Color [2063.68%], Reis [1734.59%], Quotient Technology[954.386%], Express [946.725%], Volt Information[705.085%] Best Consumer Services Stocks Daily:
Container Store[22.6852%], SES AI[21.5385%], SUPERVALU [20.4138%], QuantumScape Corp[18.2261%], World Wrestling[14.734%], Global Sources[13.1016%], Whole Foods[11.8363%], Ranpak [10.8974%], iClick Interactive[10%], Net 1[9.46197%], RCI Hospitality[9.18605%]