
 Login Sign Up


| |||||
 |  | ||||

| 12Stocks.com Market Intelligence |
Best Consumer Services Stocks
| In a hurry? Services & Goods Stocks: Performance Trends Table, Stock Charts
Sort Consumer Services: Daily, Weekly, Year-to-Date, Market Cap & Trends. Filter Services & Goods stocks list by size: All Large Mid-Range Small |
| 12Stocks.com Consumer Services Stocks Performances & Trends Daily | |||||||||
|
|  The overall Smart Investing & Trading Score is 50 (0-bearish to 100-bullish) which puts Consumer Services sector in short term neutral trend. The Smart Investing & Trading Score from previous trading session is 60 and hence a deterioration of trend.
| ||||||||
Here are the Smart Investing & Trading Scores of the most requested Consumer Services stocks at 12Stocks.com (click stock name for detailed review):
|


| Consider signing up for our daily 12Stocks.com "Best Stocks Newsletter". You will never ever miss a big stock move again! |
| 12Stocks.com: Investing in Consumer Services sector with Stocks | |
|
The following table helps investors and traders sort through current performance and trends (as measured by Smart Investing & Trading Score) of various
stocks in the Consumer Services sector. Quick View: Move mouse or cursor over stock symbol (ticker) to view short-term Technical chart and over stock name to view long term chart. Click on  to add stock symbol to your watchlist and to add stock symbol to your watchlist and  to view watchlist. Click on any ticker or stock name for detailed market intelligence report for that stock. to view watchlist. Click on any ticker or stock name for detailed market intelligence report for that stock. |
12Stocks.com Performance of Stocks in Consumer Services Sector
| Ticker | Stock Name | Watchlist | Category | Recent Price | Smart Investing & Trading Score | Change % | YTD Change% |
| SCI | Service |   | Services | 79.25 | 0 | 0.31% | 2.59% |
| CSV | Carriage Services | | Services | 43.78 | 0 | 0.07% | 14.24% |
| QSR | Restaurant Brands | | Restaurants | 63.33 | 0 | 0.06% | -0.29% |
| MCW | Mister Car | | Services | 5.71 | 0 | -0.17% | -21.26% |
| GDEN | Golden Entertainment | | Casinos | 24.87 | 0 | -0.41% | -21.56% |
| COST | Costco Wholesale | | Retail | 938.82 | 0 | -0.48% | -3.83% |
| BFAM | Bright Horizons | | Services | 118.04 | 0 | -0.48% | 9.95% |
| OLLI | Ollie s | | Retail | 126.84 | 0 | -0.56% | 22.24% |
| PLNT | Planet Fitness | | Sporting | 104.80 | 0 | -0.57% | 8.17% |
| AVT | Avnet | | Retail | 54.57 | 0 | -0.86% | 2.31% |
| ARCO | Arcos Dorados | | Restaurants | 7.00 | 0 | -1.13% | -2.50% |
| EEFT | Euronet Worldwide | | Services | 93.19 | 0 | -1.15% | -8.60% |
| TT | TRANE | | BLDG PRD-AIR/HT | 410.44 | 0 | -1.24% | 13.46% |
| TRU | TransUnion | | Services | 88.40 | 0 | -1.28% | -6.30% |
| MMYT | MakeMyTrip | | Entertainment | 98.75 | 0 | -1.39% | -10.17% |
| MAR | Marriott | | Lodging | 263.67 | 0 | -1.56% | -8.83% |
| ARMK | Aramark | | Restaurants | 39.11 | 0 | -1.60% | 6.51% |
| NWSA | News | | Broadcasting | 28.9 | 0 | -1.73% | 3.16% |
| CTAS | Cintas | | Services | 206.37 | 0 | -1.74% | 3.27% |
| SFM | Sprouts Farmers | | Grocery | 140.54 | 0 | -1.75% | 16.79% |
| BJRI | BJ s | | Restaurants | 33.56 | 0 | -1.97% | -2.26% |
| MCO | Moody s | | Services | 499.19 | 0 | -2.07% | 0.33% |
| MUSA | Murphy USA | | Retail | 376.50 | 0 | -2.44% | -23.18% |
| PAYX | Paychex | | Staffing | 136.04 | 0 | -2.45% | -5.90% |
| WSO | Watsco | | Retail | 402.38 | 0 | -3.14% | -12.87% |
| For chart view version of above stock list: Chart View ➞ 0 - 25 , 25 - 50 , 50 - 75 , 75 - 100 , 100 - 125 , 125 - 150 , 150 - 175 , 175 - 200 , 200 - 225 , 225 - 250 , 250 - 275 , 275 - 300 , 300 - 325 , 325 - 350 , 350 - 375 , 375 - 400 , 400 - 425 , 425 - 450 | ||
 | Click To Change The Sort Order: By Market Cap or Company Size Performance: Year-to-date, Week and Day |  |
|
Get the most comprehensive stock market coverage daily at 12Stocks.com ➞ Best Stocks Today ➞ Best Stocks Weekly ➞ Best Stocks Year-to-Date ➞ Best Stocks Trends ➞  Best Stocks Today 12Stocks.com Best Nasdaq Stocks ➞ Best S&P 500 Stocks ➞ Best Tech Stocks ➞ Best Biotech Stocks ➞ |
| Detailed Overview of Consumer Services Stocks |
| Consumer Services Technical Overview, Leaders & Laggards, Top Consumer Services ETF Funds & Detailed Consumer Services Stocks List, Charts, Trends & More |
| Consumer Services Sector: Technical Analysis, Trends & YTD Performance | |
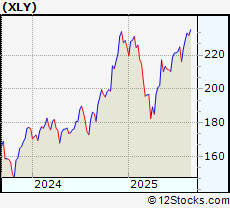
| Consumer Services sector is composed of stocks
from retail, entertainment, media/publishing, consumer goods
and services subsectors. Consumer Services sector, as represented by XLY, an exchange-traded fund [ETF] that holds basket of Consumer Services stocks (e.g, Walmart, Alibaba) is up by 0.83% and is currently underperforming the overall market by -5.69% year-to-date. Below is a quick view of Technical charts and trends: |
|
 XLY Weekly Chart |
|
| Long Term Trend: Very Good | |
| Medium Term Trend: Very Good | |
 XLY Daily Chart |
|
| Short Term Trend: Not Good | |
| Overall Trend Score: 50 | |
| YTD Performance: 0.83% | |
| **Trend Scores & Views Are Only For Educational Purposes And Not For Investing | |
| 12Stocks.com: Top Performing Consumer Services Sector Stocks | ||||||||||||||||||||||||||||||||||||||||||||||||
 The top performing Consumer Services sector stocks year to date are
Now, more recently, over last week, the top performing Consumer Services sector stocks on the move are


|
||||||||||||||||||||||||||||||||||||||||||||||||
| 12Stocks.com: Investing in Consumer Services Sector using Exchange Traded Funds | |
|
The following table shows list of key exchange traded funds (ETF) that
help investors track Consumer Services Index. For detailed view, check out our ETF Funds section of our website. Quick View: Move mouse or cursor over ETF symbol (ticker) to view short-term Technical chart and over ETF name to view long term chart. Click on ticker or stock name for detailed view. Click on to add stock symbol to your watchlist and to view watchlist. |
12Stocks.com List of ETFs that track Consumer Services Index
| Ticker | ETF Name | Watchlist | Recent Price | Smart Investing & Trading Score | Change % | Week % | Year-to-date % |
| XLY | Consumer Discret Sel | | 231.74 | 50 | 2.98 | 1.72 | 0.83% |
| RTH | Retail | | 248.13 | 80 | 0.04 | 0.04 | 3.55% |
| IYC | Consumer Services | | 103.45 | 40 | -0.77 | -1.16 | 6.01% |
| XRT | Retail | | 84.34 | 60 | 0.18 | 0.18 | 5.65% |
| IYK | Consumer Goods | | 70.34 | 40 | -0.08 | 2.42 | 10.27% |
| UCC | Consumer Services | | 50.49 | 50 | 5.11 | 2.52 | -7.59% |
| RETL | Retail Bull 3X | | 9.55 | 60 | -2.11 | -2.32 | -5.57% |
| RXI | Globl Consumer Discretionary | | 198.26 | 50 | -0.82 | -0.58 | 6.48% |
| SCC | Short Consumer Services | | 15.70 | 70 | -5.95 | -3.49 | -8.63% |
| UGE | Consumer Goods | | 18.18 | 20 | -0.14 | 1.22 | 6% |
| 12Stocks.com: Charts, Trends, Fundamental Data and Performances of Consumer Services Stocks | |
|
We now take in-depth look at all Consumer Services stocks including charts, multi-period performances and overall trends (as measured by Smart Investing & Trading Score). One can sort Consumer Services stocks (click link to choose) by Daily, Weekly and by Year-to-Date performances. Also, one can sort by size of the company or by market capitalization. |
| Select Your Default Chart Type: | |||||
| |||||
| Click on stock symbol or name for detailed view. Click on to add stock symbol to your watchlist and to view watchlist. Quick View: Move mouse or cursor over "Daily" to quickly view daily Technical stock chart and over "Weekly" to view weekly Technical stock chart. | |||||

 | SCI Service Corporation International |
| Sector: Services & Goods | |
| SubSector: Personal Services | |
| MarketCap: 7216.05 Millions | |
| Recent Price: 79.25 Smart Investing & Trading Score: 0 | |
| Day Percent Change: 0.31% Day Change: 0.25 | |
| Week Change: 0.69% Year-to-date Change: 2.6% | |
| SCI Links: Profile News Message Board | |
| Charts:- Daily , Weekly | |
| Add SCI to Watchlist: View: Get Complete SCI Trend Analysis ➞ | |
 | CSV Carriage Services, Inc. |
| Sector: Services & Goods | |
| SubSector: Personal Services | |
| MarketCap: 304.725 Millions | |
| Recent Price: 43.78 Smart Investing & Trading Score: 0 | |
| Day Percent Change: 0.07% Day Change: 0.03 | |
| Week Change: -2.88% Year-to-date Change: 14.2% | |
| CSV Links: Profile News Message Board | |
| Charts:- Daily , Weekly | |
| Add CSV to Watchlist: View: Get Complete CSV Trend Analysis ➞ | |
 | QSR Restaurant Brands International Inc. |
| Sector: Services & Goods | |
| SubSector: Restaurants | |
| MarketCap: 9551 Millions | |
| Recent Price: 63.33 Smart Investing & Trading Score: 0 | |
| Day Percent Change: 0.06% Day Change: 0.04 | |
| Week Change: -2.13% Year-to-date Change: -0.3% | |
| QSR Links: Profile News Message Board | |
| Charts:- Daily , Weekly | |
| Add QSR to Watchlist: View: Get Complete QSR Trend Analysis ➞ | |
 | MCW Mister Car Wash, Inc. |
| Sector: Services & Goods | |
| SubSector: Personal Services | |
| MarketCap: 2790 Millions | |
| Recent Price: 5.71 Smart Investing & Trading Score: 0 | |
| Day Percent Change: -0.17% Day Change: -0.01 | |
| Week Change: -2.88% Year-to-date Change: -21.3% | |
| MCW Links: Profile News Message Board | |
| Charts:- Daily , Weekly | |
| Add MCW to Watchlist: View: Get Complete MCW Trend Analysis ➞ | |
 | GDEN Golden Entertainment, Inc. |
| Sector: Services & Goods | |
| SubSector: Resorts & Casinos | |
| MarketCap: 130.794 Millions | |
| Recent Price: 24.87 Smart Investing & Trading Score: 0 | |
| Day Percent Change: -0.41% Day Change: -0.1 | |
| Week Change: -3.64% Year-to-date Change: -21.6% | |
| GDEN Links: Profile News Message Board | |
| Charts:- Daily , Weekly | |
| Add GDEN to Watchlist: View: Get Complete GDEN Trend Analysis ➞ | |
 | COST Costco Wholesale Corporation |
| Sector: Services & Goods | |
| SubSector: Discount, Variety Stores | |
| MarketCap: 136355 Millions | |
| Recent Price: 938.82 Smart Investing & Trading Score: 0 | |
| Day Percent Change: -0.48% Day Change: -4.5 | |
| Week Change: -0.48% Year-to-date Change: -3.8% | |
| COST Links: Profile News Message Board | |
| Charts:- Daily , Weekly | |
| Add COST to Watchlist: View: Get Complete COST Trend Analysis ➞ | |
 | BFAM Bright Horizons Family Solutions Inc. |
| Sector: Services & Goods | |
| SubSector: Personal Services | |
| MarketCap: 5487.65 Millions | |
| Recent Price: 118.04 Smart Investing & Trading Score: 0 | |
| Day Percent Change: -0.48% Day Change: -0.59 | |
| Week Change: 2.44% Year-to-date Change: 10.0% | |
| BFAM Links: Profile News Message Board | |
| Charts:- Daily , Weekly | |
| Add BFAM to Watchlist: View: Get Complete BFAM Trend Analysis ➞ | |
 | OLLI Ollie s Bargain Outlet Holdings, Inc. |
| Sector: Services & Goods | |
| SubSector: Discount, Variety Stores | |
| MarketCap: 2904.62 Millions | |
| Recent Price: 126.84 Smart Investing & Trading Score: 0 | |
| Day Percent Change: -0.56% Day Change: -0.75 | |
| Week Change: 1.69% Year-to-date Change: 22.2% | |
| OLLI Links: Profile News Message Board | |
| Charts:- Daily , Weekly | |
| Add OLLI to Watchlist: View: Get Complete OLLI Trend Analysis ➞ | |
 | PLNT Planet Fitness, Inc. |
| Sector: Services & Goods | |
| SubSector: Sporting Activities | |
| MarketCap: 3485.94 Millions | |
| Recent Price: 104.80 Smart Investing & Trading Score: 0 | |
| Day Percent Change: -0.57% Day Change: -0.61 | |
| Week Change: 2.01% Year-to-date Change: 8.2% | |
| PLNT Links: Profile News Message Board | |
| Charts:- Daily , Weekly | |
| Add PLNT to Watchlist: View: Get Complete PLNT Trend Analysis ➞ | |
 | AVT Avnet, Inc. |
| Sector: Services & Goods | |
| SubSector: Electronics Wholesale | |
| MarketCap: 2776.33 Millions | |
| Recent Price: 54.57 Smart Investing & Trading Score: 0 | |
| Day Percent Change: -0.86% Day Change: -0.46 | |
| Week Change: -2.38% Year-to-date Change: 2.3% | |
| AVT Links: Profile News Message Board | |
| Charts:- Daily , Weekly | |
| Add AVT to Watchlist: View: Get Complete AVT Trend Analysis ➞ | |
 | ARCO Arcos Dorados Holdings Inc. |
| Sector: Services & Goods | |
| SubSector: Restaurants | |
| MarketCap: 778.87 Millions | |
| Recent Price: 7.00 Smart Investing & Trading Score: 0 | |
| Day Percent Change: -1.13% Day Change: -0.08 | |
| Week Change: -6.92% Year-to-date Change: -2.5% | |
| ARCO Links: Profile News Message Board | |
| Charts:- Daily , Weekly | |
| Add ARCO to Watchlist: View: Get Complete ARCO Trend Analysis ➞ | |
 | EEFT Euronet Worldwide, Inc. |
| Sector: Services & Goods | |
| SubSector: Business Services | |
| MarketCap: 4809.62 Millions | |
| Recent Price: 93.19 Smart Investing & Trading Score: 0 | |
| Day Percent Change: -1.15% Day Change: -1.09 | |
| Week Change: -2.67% Year-to-date Change: -8.6% | |
| EEFT Links: Profile News Message Board | |
| Charts:- Daily , Weekly | |
| Add EEFT to Watchlist: View: Get Complete EEFT Trend Analysis ➞ | |
 | TT TRANE INC |
| Sector: Services & Goods | |
| SubSector: BLDG PRD-AIR/HT | |
| MarketCap: 8986.01 Millions | |
| Recent Price: 410.44 Smart Investing & Trading Score: 0 | |
| Day Percent Change: -1.24% Day Change: -5.16 | |
| Week Change: -1.24% Year-to-date Change: 13.5% | |
| TT Links: Profile News Message Board | |
| Charts:- Daily , Weekly | |
| Add TT to Watchlist: View: Get Complete TT Trend Analysis ➞ | |
 | TRU TransUnion |
| Sector: Services & Goods | |
| SubSector: Business Services | |
| MarketCap: 11457.2 Millions | |
| Recent Price: 88.40 Smart Investing & Trading Score: 0 | |
| Day Percent Change: -1.28% Day Change: -1.12 | |
| Week Change: -3.8% Year-to-date Change: -6.3% | |
| TRU Links: Profile News Message Board | |
| Charts:- Daily , Weekly | |
| Add TRU to Watchlist: View: Get Complete TRU Trend Analysis ➞ | |
 | MMYT MakeMyTrip Limited |
| Sector: Services & Goods | |
| SubSector: General Entertainment | |
| MarketCap: 1429.59 Millions | |
| Recent Price: 98.75 Smart Investing & Trading Score: 0 | |
| Day Percent Change: -1.39% Day Change: -1.42 | |
| Week Change: 6.93% Year-to-date Change: -10.2% | |
| MMYT Links: Profile News Message Board | |
| Charts:- Daily , Weekly | |
| Add MMYT to Watchlist: View: Get Complete MMYT Trend Analysis ➞ | |
 | MAR Marriott International, Inc. |
| Sector: Services & Goods | |
| SubSector: Lodging | |
| MarketCap: 25831.6 Millions | |
| Recent Price: 263.67 Smart Investing & Trading Score: 0 | |
| Day Percent Change: -1.56% Day Change: -4.19 | |
| Week Change: -1.56% Year-to-date Change: -8.8% | |
| MAR Links: Profile News Message Board | |
| Charts:- Daily , Weekly | |
| Add MAR to Watchlist: View: Get Complete MAR Trend Analysis ➞ | |
 | ARMK Aramark |
| Sector: Services & Goods | |
| SubSector: Specialty Eateries | |
| MarketCap: 5242.27 Millions | |
| Recent Price: 39.11 Smart Investing & Trading Score: 0 | |
| Day Percent Change: -1.6% Day Change: -0.64 | |
| Week Change: -0.61% Year-to-date Change: 6.5% | |
| ARMK Links: Profile News Message Board | |
| Charts:- Daily , Weekly | |
| Add ARMK to Watchlist: View: Get Complete ARMK Trend Analysis ➞ | |
 | NWSA News Corporation |
| Sector: Services & Goods | |
| SubSector: Broadcasting - TV | |
| MarketCap: 5857.53 Millions | |
| Recent Price: 28.9 Smart Investing & Trading Score: 0 | |
| Day Percent Change: -1.73% Day Change: -0.51 | |
| Week Change: -1.73% Year-to-date Change: 3.2% | |
| NWSA Links: Profile News Message Board | |
| Charts:- Daily , Weekly | |
| Add NWSA to Watchlist: View: Get Complete NWSA Trend Analysis ➞ | |
 | CTAS Cintas Corporation |
| Sector: Services & Goods | |
| SubSector: Business Services | |
| MarketCap: 20154.6 Millions | |
| Recent Price: 206.37 Smart Investing & Trading Score: 0 | |
| Day Percent Change: -1.74% Day Change: -3.66 | |
| Week Change: -1.74% Year-to-date Change: 3.3% | |
| CTAS Links: Profile News Message Board | |
| Charts:- Daily , Weekly | |
| Add CTAS to Watchlist: View: Get Complete CTAS Trend Analysis ➞ | |
 | SFM Sprouts Farmers Market, Inc. |
| Sector: Services & Goods | |
| SubSector: Grocery Stores | |
| MarketCap: 2495.85 Millions | |
| Recent Price: 140.54 Smart Investing & Trading Score: 0 | |
| Day Percent Change: -1.75% Day Change: -2.65 | |
| Week Change: 3.49% Year-to-date Change: 16.8% | |
| SFM Links: Profile News Message Board | |
| Charts:- Daily , Weekly | |
| Add SFM to Watchlist: View: Get Complete SFM Trend Analysis ➞ | |
 | BJRI BJ s Restaurants, Inc. |
| Sector: Services & Goods | |
| SubSector: Restaurants | |
| MarketCap: 183.67 Millions | |
| Recent Price: 33.56 Smart Investing & Trading Score: 0 | |
| Day Percent Change: -1.97% Day Change: -0.69 | |
| Week Change: -3.16% Year-to-date Change: -2.3% | |
| BJRI Links: Profile News Message Board | |
| Charts:- Daily , Weekly | |
| Add BJRI to Watchlist: View: Get Complete BJRI Trend Analysis ➞ | |
 | MCO Moody s Corporation |
| Sector: Services & Goods | |
| SubSector: Business Services | |
| MarketCap: 35998.5 Millions | |
| Recent Price: 499.19 Smart Investing & Trading Score: 0 | |
| Day Percent Change: -2.07% Day Change: -10.57 | |
| Week Change: -2.07% Year-to-date Change: 0.3% | |
| MCO Links: Profile News Message Board | |
| Charts:- Daily , Weekly | |
| Add MCO to Watchlist: View: Get Complete MCO Trend Analysis ➞ | |
 | MUSA Murphy USA Inc. |
| Sector: Services & Goods | |
| SubSector: Specialty Retail, Other | |
| MarketCap: 3133.14 Millions | |
| Recent Price: 376.50 Smart Investing & Trading Score: 0 | |
| Day Percent Change: -2.44% Day Change: -9.63 | |
| Week Change: -1.04% Year-to-date Change: -23.2% | |
| MUSA Links: Profile News Message Board | |
| Charts:- Daily , Weekly | |
| Add MUSA to Watchlist: View: Get Complete MUSA Trend Analysis ➞ | |
 | PAYX Paychex, Inc. |
| Sector: Services & Goods | |
| SubSector: Staffing & Outsourcing Services | |
| MarketCap: 20928.8 Millions | |
| Recent Price: 136.04 Smart Investing & Trading Score: 0 | |
| Day Percent Change: -2.45% Day Change: -3.42 | |
| Week Change: -2.45% Year-to-date Change: -5.9% | |
| PAYX Links: Profile News Message Board | |
| Charts:- Daily , Weekly | |
| Add PAYX to Watchlist: View: Get Complete PAYX Trend Analysis ➞ | |
 | WSO Watsco, Inc. |
| Sector: Services & Goods | |
| SubSector: Electronics Wholesale | |
| MarketCap: 6000.33 Millions | |
| Recent Price: 402.38 Smart Investing & Trading Score: 0 | |
| Day Percent Change: -3.14% Day Change: -13.14 | |
| Week Change: -3.79% Year-to-date Change: -12.9% | |
| WSO Links: Profile News Message Board | |
| Charts:- Daily , Weekly | |
| Add WSO to Watchlist: View: Get Complete WSO Trend Analysis ➞ | |
| For tabular summary view of above stock list: Summary View ➞ 0 - 25 , 25 - 50 , 50 - 75 , 75 - 100 , 100 - 125 , 125 - 150 , 150 - 175 , 175 - 200 , 200 - 225 , 225 - 250 , 250 - 275 , 275 - 300 , 300 - 325 , 325 - 350 , 350 - 375 , 375 - 400 , 400 - 425 , 425 - 450 | ||
| Click To Change The Sort Order: By Market Cap or Company Size Performance: Year-to-date, Week and Day | |
| Select Chart Type: | ||
|
Best Stocks Today 12Stocks.com |
© 2025 12Stocks.com Terms & Conditions Privacy Contact Us
All Information Provided Only For Education And Not To Be Used For Investing or Trading. See Terms & Conditions


One More Thing ... Get Best Stocks Delivered Daily!
Never Ever Miss A Move With Our Top Ten Stocks Lists
Find Best Stocks In Any Market - Bull or Bear Market
Take A Peek At Our Top Ten Stocks Lists: Daily, Weekly, Year-to-Date & Top Trends
Find Best Stocks In Any Market - Bull or Bear Market
Take A Peek At Our Top Ten Stocks Lists: Daily, Weekly, Year-to-Date & Top Trends
Consumer Services Stocks With Best Up Trends [0-bearish to 100-bullish]: Cato [100], Myriad Genetics[100], Seaways[100], Alibaba [100], Baozun [100], Huazhu [100], Quad/Graphics [100], Dillard s[100], Fox [100], Five Below[100], AMC Networks[100]
Best Consumer Services Stocks Year-to-Date:
WW [2341.73%], ThredUp [702.88%], Willdan [179%], Kratos Defense[145.56%], Yatsen Holding[141.21%], IHS Holding[139.04%], National Vision[130.71%], Altisource Portfolio[127.41%], Roblox [98.5%], Gray Television[93.93%], XPeng [92.47%] Best Consumer Services Stocks This Week:
Cato [34.15%], Guess [25.88%], Altisource Portfolio[24.32%], Zhihu [18.1%], XPeng [17.39%], Smart Share[14.53%], MINISO [13.58%], Soho House[12.68%], Ameresco [11.37%], Urban One[10.62%], ATRenew [9.67%] Best Consumer Services Stocks Daily:
Cato [34.15%], XPeng [11.68%], Designer Brands[9.15%], Altisource Portfolio[9.12%], E.W. Scripps[7.9%], Ulta Beauty[7.82%], Kohl s[7.1%], MINISO [6.38%], Genesco [5.5%], Myriad Genetics[5.42%], Seaways[5.35%]