
 Login Sign Up


| |||||
 |  | ||||

| 12Stocks.com Market Intelligence |
Best SmallCap Stocks
|
| In a hurry? Small Cap Stock Lists: Performance Trends Table, Stock Charts
Sort Small Cap stocks: Daily, Weekly, Year-to-Date, Market Cap & Trends. Filter Small Cap stocks list by sector: Show all, Tech, Finance, Energy, Staples, Retail, Industrial, Materials, Utilities and HealthCare Filter Small Cap stocks list by size: All Large Medium Small and MicroCap |
| 12Stocks.com Small Cap Stocks Performances & Trends Daily | |||||||||
|
|  The overall Smart Investing & Trading Score is 88 (0-bearish to 100-bullish) which puts Small Cap index in short term bullish trend. The Smart Investing & Trading Score from previous trading session is 56 and hence an improvement of trend.
| ||||||||
Here are the Smart Investing & Trading Scores of the most requested small cap stocks at 12Stocks.com (click stock name for detailed review):
|


| 12Stocks.com: Investing in Smallcap Index with Stocks | |
|
The following table helps investors and traders sort through current performance and trends (as measured by Smart Investing & Trading Score) of various
stocks in the Smallcap Index. Quick View: Move mouse or cursor over stock symbol (ticker) to view short-term technical chart and over stock name to view long term chart. Click on  to add stock symbol to your watchlist and to add stock symbol to your watchlist and  to view watchlist. Click on any ticker or stock name for detailed market intelligence report for that stock. to view watchlist. Click on any ticker or stock name for detailed market intelligence report for that stock. |
12Stocks.com Performance of Stocks in Smallcap Index
| Ticker | Stock Name | Watchlist | Category | Recent Price | Smart Investing & Trading Score | Change % | YTD Change% |
| SSB | South State |   | Financials | 77.08 | 0 | -1.12% | -8.73% |
| MCS | Marcus | | Services & Goods | 13.30 | 32 | -0.37% | -8.78% |
| FRME | First Merchants | | Financials | 33.82 | 42 | -0.91% | -8.79% |
| GNW | Genworth Financial | | Financials | 6.09 | 64 | 1.67% | -8.83% |
| HURN | Huron Consulting | | Services & Goods | 93.68 | 52 | 0.05% | -8.87% |
| BANF | BancFirst | | Financials | 88.69 | 48 | -0.44% | -8.88% |
| CBL | CBL & Associates Properties | | Financials | 22.25 | 74 | 1.51% | -8.89% |
| PLAB | Photronics | | Technology | 28.58 | 64 | 1.06% | -8.89% |
| PKOH | Park-Ohio | | Services & Goods | 24.56 | 62 | 1.95% | -8.90% |
| UE | Urban Edge | | Financials | 16.67 | 57 | 0.97% | -8.91% |
| AVTE | Aerovate | | Health Care | 20.55 | 41 | -5.52% | -8.95% |
| BSRR | Sierra Bancorp | | Financials | 20.53 | 54 | 0.15% | -8.96% |
| BLKB | Blackbaud | | Technology | 78.90 | 50 | 1.22% | -9.00% |
| ARI | Apollo Commercial | | Financials | 10.68 | 5 | -1.11% | -9.03% |
| EFC | Ellington Financial | | Financials | 11.56 | 42 | -1.28% | -9.05% |
| ENS | EnerSys | | Industrials | 91.79 | 50 | 0.56% | -9.08% |
| EBF | Ennis | | Consumer Staples | 19.92 | 64 | 1.12% | -9.08% |
| SCS | Steelcase | | Consumer Staples | 12.29 | 64 | 1.82% | -9.10% |
| FC | Franklin Covey | | Services & Goods | 39.57 | 49 | 0.08% | -9.10% |
| JBT | John Bean | | Industrials | 90.40 | 25 | -0.44% | -9.10% |
| BUSE | First Busey | | Financials | 22.56 | 37 | -1.05% | -9.11% |
| JBGS | JBG SMITH | | Financials | 15.46 | 69 | 2.18% | -9.11% |
| CSGS | CSG Systems | | Technology | 48.34 | 18 | 0.58% | -9.15% |
| LNN | Lindsay | | Industrials | 117.33 | 69 | 0.94% | -9.16% |
| KRMD | Repro Med | | Health Care | 2.23 | 100 | 1.83% | -9.16% |


| Too many stocks? View smallcap stocks filtered by marketcap & sector |
| Marketcap: All SmallCap Stocks (default-no microcap), Large, Mid-Range, Small |
| Smallcap Sector: Tech, Finance, Energy, Staples, Retail, Industrial, Materials, & Medical |
|
Get the most comprehensive stock market coverage daily at 12Stocks.com ➞ Best Stocks Today ➞ Best Stocks Weekly ➞ Best Stocks Year-to-Date ➞ Best Stocks Trends ➞  Best Stocks Today 12Stocks.com Best Nasdaq Stocks ➞ Best S&P 500 Stocks ➞ Best Tech Stocks ➞ Best Biotech Stocks ➞ |
| Detailed Overview of SmallCap Stocks |
| SmallCap Technical Overview, Leaders & Laggards, Top SmallCap ETF Funds & Detailed SmallCap Stocks List, Charts, Trends & More |
| Smallcap: Technical Analysis, Trends & YTD Performance | |
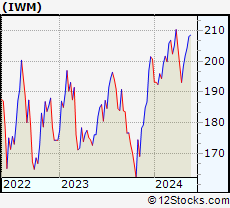
| SmallCap segment as represented by
IWM, an exchange-traded fund [ETF], holds basket of thousands of smallcap stocks from across all major sectors of the US stock market. The smallcap index (contains stocks like Riverbed & Sotheby's) is down by -0.37% and is currently underperforming the overall market by -6.93% year-to-date. Below is a quick view of technical charts and trends: | |
 IWM Weekly Chart |
|
| Long Term Trend: Very Good | |
| Medium Term Trend: Good | |
 IWM Daily Chart |
|
| Short Term Trend: Very Good | |
| Overall Trend Score: 88 | |
| YTD Performance: -0.37% | |
| **Trend Scores & Views Are Only For Educational Purposes And Not For Investing | |
| 12Stocks.com: Top Performing Small Cap Index Stocks | ||||||||||||||||||||||||||||||||||||||||||||||||
 The top performing Small Cap Index stocks year to date are
Now, more recently, over last week, the top performing Small Cap Index stocks on the move are


|
||||||||||||||||||||||||||||||||||||||||||||||||
| 12Stocks.com: Investing in Smallcap Index using Exchange Traded Funds | |
|
The following table shows list of key exchange traded funds (ETF) that
help investors track Smallcap index. The following list also includes leveraged ETF funds that track twice or thrice the daily returns of Smallcap indices. Short or inverse ETF funds move in the opposite direction to the index they track and are useful during market pullbacks or during bear markets. Quick View: Move mouse or cursor over ETF symbol (ticker) to view short-term technical chart and over ETF name to view long term chart. Click on ticker or stock name for detailed view. Click on to add stock symbol to your watchlist and to view watchlist. |
12Stocks.com List of ETFs that track Smallcap Index
| Ticker | ETF Name | Watchlist | Recent Price | Smart Investing & Trading Score | Change % | Week % | Year-to-date % |
| IWM | iShares Russell 2000 | | 199.96 | 88 | 0.79 | 0.79 | -0.37% |
| IJR | iShares Core S&P Small-Cap | | 106.41 | 93 | 0.72 | 0.72 | -1.7% |
| VTWO | Vanguard Russell 2000 ETF | | 80.78 | 88 | 0.70 | 0.7 | -0.39% |
| IWN | iShares Russell 2000 Value | | 152.05 | 93 | 0.60 | 0.6 | -2.11% |
| IWO | iShares Russell 2000 Growth | | 255.74 | 88 | 1.05 | 1.05 | 1.4% |
| IJS | iShares S&P Small-Cap 600 Value | | 97.95 | 75 | 0.78 | 0.78 | -4.97% |
| IJT | iShares S&P Small-Cap 600 Growth | | 126.96 | 95 | 0.69 | 0.69 | 1.45% |
| XSLV | PowerShares S&P SmallCap Low Volatil ETF | | 42.87 | 80 | 0.35 | 0.35 | -2.9% |
| SMLV | SPDR SSGA US Small Cap Low Volatil ETF | | 107.77 | 68 | 0.23 | 0.23 | -4.22% |
| SAA | ProShares Ultra SmallCap600 | | 23.27 | 95 | 1.00 | 1 | -6.73% |
| SBB | ProShares Short SmallCap600 | | 16.28 | 8 | -0.64 | -0.64 | 2.2% |
| SDD | ProShares UltraShort SmallCap600 | | 19.09 | 10 | -1.34 | -1.34 | 3.6% |
| 12Stocks.com: Charts, Trends, Fundamental Data and Performances of SmallCap Stocks | |
|
We now take in-depth look at all SmallCap stocks including charts, multi-period performances and overall trends (as measured by Smart Investing & Trading Score). One can sort SmallCap stocks (click link to choose) by Daily, Weekly and by Year-to-Date performances. Also, one can sort by size of the company or by market capitalization. |
| Select Your Default Chart Type: | |||||
| |||||
| Click on stock symbol or name for detailed view. Click on to add stock symbol to your watchlist and to view watchlist. Quick View: Move mouse or cursor over "Daily" to quickly view daily technical stock chart and over "Weekly" to view weekly technical stock chart. | |||||

 | SSB South State Corporation |
| Sector: Financials | |
| SubSector: Regional - Mid-Atlantic Banks | |
| MarketCap: 2113.49 Millions | |
| Recent Price: 77.08 Smart Investing & Trading Score: 0 | |
| Day Percent Change: -1.12% Day Change: -0.87 | |
| Week Change: -1.12% Year-to-date Change: -8.7% | |
| SSB Links: Profile News Message Board | |
| Charts:- Daily , Weekly | |
| Add SSB to Watchlist: View: Get Complete SSB Trend Analysis ➞ | |
 | MCS The Marcus Corporation |
| Sector: Services & Goods | |
| SubSector: Entertainment - Diversified | |
| MarketCap: 441.437 Millions | |
| Recent Price: 13.30 Smart Investing & Trading Score: 32 | |
| Day Percent Change: -0.37% Day Change: -0.05 | |
| Week Change: -0.37% Year-to-date Change: -8.8% | |
| MCS Links: Profile News Message Board | |
| Charts:- Daily , Weekly | |
| Add MCS to Watchlist: View: Get Complete MCS Trend Analysis ➞ | |
 | FRME First Merchants Corporation |
| Sector: Financials | |
| SubSector: Regional - Midwest Banks | |
| MarketCap: 1490.4 Millions | |
| Recent Price: 33.82 Smart Investing & Trading Score: 42 | |
| Day Percent Change: -0.91% Day Change: -0.31 | |
| Week Change: -0.91% Year-to-date Change: -8.8% | |
| FRME Links: Profile News Message Board | |
| Charts:- Daily , Weekly | |
| Add FRME to Watchlist: View: Get Complete FRME Trend Analysis ➞ | |
 | GNW Genworth Financial, Inc. |
| Sector: Financials | |
| SubSector: Life Insurance | |
| MarketCap: 1719.76 Millions | |
| Recent Price: 6.09 Smart Investing & Trading Score: 64 | |
| Day Percent Change: 1.67% Day Change: 0.10 | |
| Week Change: 1.67% Year-to-date Change: -8.8% | |
| GNW Links: Profile News Message Board | |
| Charts:- Daily , Weekly | |
| Add GNW to Watchlist: View: Get Complete GNW Trend Analysis ➞ | |
 | HURN Huron Consulting Group Inc. |
| Sector: Services & Goods | |
| SubSector: Management Services | |
| MarketCap: 968.645 Millions | |
| Recent Price: 93.68 Smart Investing & Trading Score: 52 | |
| Day Percent Change: 0.05% Day Change: 0.05 | |
| Week Change: 0.05% Year-to-date Change: -8.9% | |
| HURN Links: Profile News Message Board | |
| Charts:- Daily , Weekly | |
| Add HURN to Watchlist: View: Get Complete HURN Trend Analysis ➞ | |
 | BANF BancFirst Corporation |
| Sector: Financials | |
| SubSector: Regional - Southwest Banks | |
| MarketCap: 1068.65 Millions | |
| Recent Price: 88.69 Smart Investing & Trading Score: 48 | |
| Day Percent Change: -0.44% Day Change: -0.39 | |
| Week Change: -0.44% Year-to-date Change: -8.9% | |
| BANF Links: Profile News Message Board | |
| Charts:- Daily , Weekly | |
| Add BANF to Watchlist: View: Get Complete BANF Trend Analysis ➞ | |
 | CBL CBL & Associates Properties, Inc. |
| Sector: Financials | |
| SubSector: REIT - Retail | |
| MarketCap: 690 Millions | |
| Recent Price: 22.25 Smart Investing & Trading Score: 74 | |
| Day Percent Change: 1.51% Day Change: 0.33 | |
| Week Change: 1.51% Year-to-date Change: -8.9% | |
| CBL Links: Profile News Message Board | |
| Charts:- Daily , Weekly | |
| Add CBL to Watchlist: View: Get Complete CBL Trend Analysis ➞ | |
 | PLAB Photronics, Inc. |
| Sector: Technology | |
| SubSector: Semiconductor Equipment & Materials | |
| MarketCap: 709.018 Millions | |
| Recent Price: 28.58 Smart Investing & Trading Score: 64 | |
| Day Percent Change: 1.06% Day Change: 0.30 | |
| Week Change: 1.06% Year-to-date Change: -8.9% | |
| PLAB Links: Profile News Message Board | |
| Charts:- Daily , Weekly | |
| Add PLAB to Watchlist: View: Get Complete PLAB Trend Analysis ➞ | |
 | PKOH Park-Ohio Holdings Corp. |
| Sector: Services & Goods | |
| SubSector: Industrial Equipment Wholesale | |
| MarketCap: 214.358 Millions | |
| Recent Price: 24.56 Smart Investing & Trading Score: 62 | |
| Day Percent Change: 1.95% Day Change: 0.47 | |
| Week Change: 1.95% Year-to-date Change: -8.9% | |
| PKOH Links: Profile News Message Board | |
| Charts:- Daily , Weekly | |
| Add PKOH to Watchlist: View: Get Complete PKOH Trend Analysis ➞ | |
 | UE Urban Edge Properties |
| Sector: Financials | |
| SubSector: REIT - Diversified | |
| MarketCap: 1112.33 Millions | |
| Recent Price: 16.67 Smart Investing & Trading Score: 57 | |
| Day Percent Change: 0.97% Day Change: 0.16 | |
| Week Change: 0.97% Year-to-date Change: -8.9% | |
| UE Links: Profile News Message Board | |
| Charts:- Daily , Weekly | |
| Add UE to Watchlist: View: Get Complete UE Trend Analysis ➞ | |
 | AVTE Aerovate Therapeutics, Inc. |
| Sector: Health Care | |
| SubSector: Biotechnology | |
| MarketCap: 478 Millions | |
| Recent Price: 20.55 Smart Investing & Trading Score: 41 | |
| Day Percent Change: -5.52% Day Change: -1.20 | |
| Week Change: -5.52% Year-to-date Change: -9.0% | |
| AVTE Links: Profile News Message Board | |
| Charts:- Daily , Weekly | |
| Add AVTE to Watchlist: View: Get Complete AVTE Trend Analysis ➞ | |
 | BSRR Sierra Bancorp |
| Sector: Financials | |
| SubSector: Regional - Pacific Banks | |
| MarketCap: 256.929 Millions | |
| Recent Price: 20.53 Smart Investing & Trading Score: 54 | |
| Day Percent Change: 0.15% Day Change: 0.03 | |
| Week Change: 0.15% Year-to-date Change: -9.0% | |
| BSRR Links: Profile News Message Board | |
| Charts:- Daily , Weekly | |
| Add BSRR to Watchlist: View: Get Complete BSRR Trend Analysis ➞ | |
 | BLKB Blackbaud, Inc. |
| Sector: Technology | |
| SubSector: Business Software & Services | |
| MarketCap: 2838.48 Millions | |
| Recent Price: 78.90 Smart Investing & Trading Score: 50 | |
| Day Percent Change: 1.22% Day Change: 0.95 | |
| Week Change: 1.22% Year-to-date Change: -9.0% | |
| BLKB Links: Profile News Message Board | |
| Charts:- Daily , Weekly | |
| Add BLKB to Watchlist: View: Get Complete BLKB Trend Analysis ➞ | |
 | ARI Apollo Commercial Real Estate Finance, Inc. |
| Sector: Financials | |
| SubSector: Mortgage Investment | |
| MarketCap: 1302.19 Millions | |
| Recent Price: 10.68 Smart Investing & Trading Score: 5 | |
| Day Percent Change: -1.11% Day Change: -0.12 | |
| Week Change: -1.11% Year-to-date Change: -9.0% | |
| ARI Links: Profile News Message Board | |
| Charts:- Daily , Weekly | |
| Add ARI to Watchlist: View: Get Complete ARI Trend Analysis ➞ | |
 | EFC Ellington Financial Inc. |
| Sector: Financials | |
| SubSector: Mortgage Investment | |
| MarketCap: 380.239 Millions | |
| Recent Price: 11.56 Smart Investing & Trading Score: 42 | |
| Day Percent Change: -1.28% Day Change: -0.15 | |
| Week Change: -1.28% Year-to-date Change: -9.1% | |
| EFC Links: Profile News Message Board | |
| Charts:- Daily , Weekly | |
| Add EFC to Watchlist: View: Get Complete EFC Trend Analysis ➞ | |
 | ENS EnerSys |
| Sector: Industrials | |
| SubSector: Industrial Electrical Equipment | |
| MarketCap: 2068.79 Millions | |
| Recent Price: 91.79 Smart Investing & Trading Score: 50 | |
| Day Percent Change: 0.56% Day Change: 0.51 | |
| Week Change: 0.56% Year-to-date Change: -9.1% | |
| ENS Links: Profile News Message Board | |
| Charts:- Daily , Weekly | |
| Add ENS to Watchlist: View: Get Complete ENS Trend Analysis ➞ | |
 | EBF Ennis, Inc. |
| Sector: Consumer Staples | |
| SubSector: Office Supplies | |
| MarketCap: 464.5 Millions | |
| Recent Price: 19.92 Smart Investing & Trading Score: 64 | |
| Day Percent Change: 1.12% Day Change: 0.22 | |
| Week Change: 1.12% Year-to-date Change: -9.1% | |
| EBF Links: Profile News Message Board | |
| Charts:- Daily , Weekly | |
| Add EBF to Watchlist: View: Get Complete EBF Trend Analysis ➞ | |
 | SCS Steelcase Inc. |
| Sector: Consumer Staples | |
| SubSector: Business Equipment | |
| MarketCap: 1310.77 Millions | |
| Recent Price: 12.29 Smart Investing & Trading Score: 64 | |
| Day Percent Change: 1.82% Day Change: 0.22 | |
| Week Change: 1.82% Year-to-date Change: -9.1% | |
| SCS Links: Profile News Message Board | |
| Charts:- Daily , Weekly | |
| Add SCS to Watchlist: View: Get Complete SCS Trend Analysis ➞ | |
 | FC Franklin Covey Co. |
| Sector: Services & Goods | |
| SubSector: Education & Training Services | |
| MarketCap: 243.306 Millions | |
| Recent Price: 39.57 Smart Investing & Trading Score: 49 | |
| Day Percent Change: 0.08% Day Change: 0.03 | |
| Week Change: 0.08% Year-to-date Change: -9.1% | |
| FC Links: Profile News Message Board | |
| Charts:- Daily , Weekly | |
| Add FC to Watchlist: View: Get Complete FC Trend Analysis ➞ | |
 | JBT John Bean Technologies Corporation |
| Sector: Industrials | |
| SubSector: Diversified Machinery | |
| MarketCap: 2197.36 Millions | |
| Recent Price: 90.40 Smart Investing & Trading Score: 25 | |
| Day Percent Change: -0.44% Day Change: -0.40 | |
| Week Change: -0.44% Year-to-date Change: -9.1% | |
| JBT Links: Profile News Message Board | |
| Charts:- Daily , Weekly | |
| Add JBT to Watchlist: View: Get Complete JBT Trend Analysis ➞ | |
 | BUSE First Busey Corporation |
| Sector: Financials | |
| SubSector: Regional - Midwest Banks | |
| MarketCap: 876.97 Millions | |
| Recent Price: 22.56 Smart Investing & Trading Score: 37 | |
| Day Percent Change: -1.05% Day Change: -0.24 | |
| Week Change: -1.05% Year-to-date Change: -9.1% | |
| BUSE Links: Profile News Message Board | |
| Charts:- Daily , Weekly | |
| Add BUSE to Watchlist: View: Get Complete BUSE Trend Analysis ➞ | |
 | JBGS JBG SMITH Properties |
| Sector: Financials | |
| SubSector: Property Management | |
| MarketCap: 4335.32 Millions | |
| Recent Price: 15.46 Smart Investing & Trading Score: 69 | |
| Day Percent Change: 2.18% Day Change: 0.33 | |
| Week Change: 2.18% Year-to-date Change: -9.1% | |
| JBGS Links: Profile News Message Board | |
| Charts:- Daily , Weekly | |
| Add JBGS to Watchlist: View: Get Complete JBGS Trend Analysis ➞ | |
 | CSGS CSG Systems International, Inc. |
| Sector: Technology | |
| SubSector: Business Software & Services | |
| MarketCap: 1336.78 Millions | |
| Recent Price: 48.34 Smart Investing & Trading Score: 18 | |
| Day Percent Change: 0.58% Day Change: 0.28 | |
| Week Change: 0.58% Year-to-date Change: -9.2% | |
| CSGS Links: Profile News Message Board | |
| Charts:- Daily , Weekly | |
| Add CSGS to Watchlist: View: Get Complete CSGS Trend Analysis ➞ | |
 | LNN Lindsay Corporation |
| Sector: Industrials | |
| SubSector: Farm & Construction Machinery | |
| MarketCap: 1097.57 Millions | |
| Recent Price: 117.33 Smart Investing & Trading Score: 69 | |
| Day Percent Change: 0.94% Day Change: 1.09 | |
| Week Change: 0.94% Year-to-date Change: -9.2% | |
| LNN Links: Profile News Message Board | |
| Charts:- Daily , Weekly | |
| Add LNN to Watchlist: View: Get Complete LNN Trend Analysis ➞ | |
 | KRMD Repro Med Systems, Inc. |
| Sector: Health Care | |
| SubSector: Medical Instruments & Supplies | |
| MarketCap: 340.06 Millions | |
| Recent Price: 2.23 Smart Investing & Trading Score: 100 | |
| Day Percent Change: 1.83% Day Change: 0.04 | |
| Week Change: 1.83% Year-to-date Change: -9.2% | |
| KRMD Links: Profile News Message Board | |
| Charts:- Daily , Weekly | |
| Add KRMD to Watchlist: View: Get Complete KRMD Trend Analysis ➞ | |
| Too many stocks? View smallcap stocks filtered by marketcap & sector |
| Marketcap: All SmallCap Stocks (default-no microcap), Large, Mid-Range, Small & MicroCap |
| Sector: Tech, Finance, Energy, Staples, Retail, Industrial, Materials, Utilities & Medical |
|
Best Stocks Today 12Stocks.com |
© 2024 12Stocks.com Terms & Conditions Privacy Contact Us
All Information Provided Only For Education And Not To Be Used For Investing or Trading. See Terms & Conditions


One More Thing ... Get Best Stocks Delivered Daily!
Never Ever Miss A Move With Our Top Ten Stocks Lists
Find Best Stocks In Any Market - Bull or Bear Market
Take A Peek At Our Top Ten Stocks Lists: Daily, Weekly, Year-to-Date & Top Trends
Find Best Stocks In Any Market - Bull or Bear Market
Take A Peek At Our Top Ten Stocks Lists: Daily, Weekly, Year-to-Date & Top Trends
Smallcap Stocks With Best Up Trends [0-bearish to 100-bullish]: Bakkt [100], Deciphera [100], Phibro Animal[100], Heartland Financial[100], PTC [100], Day One[100], Richardson Electronics[100], Fulton Financial[100], Cullinan Oncology[100], Lands [100], TransMedics Group[100]
Best Smallcap Stocks Year-to-Date:
CareMax [580.41%], Janux [421.92%], Bakkt [346.64%], Viking [305.75%], Longboard [247.46%], Alpine Immune[239.81%], Super Micro[213.22%], Avidity Biosciences[173.23%], Arcutis Bio[171.83%], Vera [167.31%], Cullinan Oncology[166.01%] Best Smallcap Stocks This Week:
Deciphera [72.56%], Phibro Animal[31.81%], Vaxxinity [31.65%], Zevia PBC[20.94%], Velo3D [19.97%], Acrivon [18.2%], Janux [18.18%], MultiPlan [15.53%], Heartland Financial[15.15%], Codexis [14.66%], Eyenovia [13.37%] Best Smallcap Stocks Daily:
Bakkt [2391.87%], Deciphera [72.56%], Phibro Animal[31.81%], Vaxxinity [31.65%], Zevia PBC[20.94%], Velo3D [19.97%], Acrivon [18.20%], Janux [18.18%], MultiPlan [15.53%], Heartland Financial[15.15%], Codexis [14.66%]