
 Login Sign Up


| |||||
 |  | ||||

| 12Stocks.com Market Intelligence |
Best SmallCap Stocks
|
| In a hurry? Small Cap Stock Lists: Performance Trends Table, Stock Charts
Sort Small Cap stocks: Daily, Weekly, Year-to-Date, Market Cap & Trends. Filter Small Cap stocks list by sector: Show all, Tech, Finance, Energy, Staples, Retail, Industrial, Materials, Utilities and HealthCare Filter Small Cap stocks list by size: All Large Medium Small and MicroCap |
| 12Stocks.com Small Cap Stocks Performances & Trends Daily | |||||||||
|
|  The overall Smart Investing & Trading Score is 24 (0-bearish to 100-bullish) which puts Small Cap index in short term bearish to neutral trend. The Smart Investing & Trading Score from previous trading session is 14 and hence an improvement of trend.
| ||||||||
Here are the Smart Investing & Trading Scores of the most requested small cap stocks at 12Stocks.com (click stock name for detailed review):
|


| 12Stocks.com: Investing in Smallcap Index with Stocks | |
|
The following table helps investors and traders sort through current performance and trends (as measured by Smart Investing & Trading Score) of various
stocks in the Smallcap Index. Quick View: Move mouse or cursor over stock symbol (ticker) to view short-term technical chart and over stock name to view long term chart. Click on  to add stock symbol to your watchlist and to add stock symbol to your watchlist and  to view watchlist. Click on any ticker or stock name for detailed market intelligence report for that stock. to view watchlist. Click on any ticker or stock name for detailed market intelligence report for that stock. |
12Stocks.com Performance of Stocks in Smallcap Index
| Ticker | Stock Name | Watchlist | Category | Recent Price | Smart Investing & Trading Score | Change % | YTD Change% |
| AVA | Avista |   | Utilities | 36.65 | 100 | 0.03% | 2.55% |
| ORIC | ORIC | | Health Care | 9.45 | 49 | 1.23% | 2.44% |
| GRBK | Green Brick | | Financials | 53.20 | 17 | -3.36% | 2.43% |
| AX | Axos Financial | | Financials | 55.89 | 100 | 0.70% | 2.36% |
| HBI | Hanesbrands | | Consumer Staples | 4.57 | 37 | 0.33% | 2.35% |
| GOOD | Gladstone Commercial | | Financials | 13.55 | 100 | -0.07% | 2.34% |
| AMRX | Amneal | | Health Care | 6.21 | 90 | 1.47% | 2.31% |
| EPC | Edgewell Personal | | Consumer Staples | 37.47 | 57 | -0.16% | 2.29% |
| SQSP | Squarespace | | Technology | 33.95 | 26 | -0.73% | 2.29% |
| CMPX | Compass | | Health Care | 1.57 | 49 | 0.00% | 2.28% |
| FULT | Fulton Financial | | Financials | 16.82 | 81 | -0.44% | 2.22% |
| AKR | Acadia Realty | | Financials | 17.35 | 46 | 1.52% | 2.12% |
| ASB | Associated Banc-Corp | | Financials | 21.84 | 80 | 1.30% | 2.10% |
| CARA | Cara | | Health Care | 0.76 | 62 | 0.00% | 2.10% |
| CSTL | Castle Biosciences | | Health Care | 22.03 | 100 | 0.05% | 2.09% |
| RGR | Sturm Ruger | | Industrials | 46.38 | 83 | -0.15% | 2.05% |
| DM | Dominion Midstream | | Energy | 0.77 | 25 | -2.47% | 2.02% |
| ESNT | Essent Group | | Financials | 53.77 | 45 | 0.34% | 1.95% |
| AIV | Apartment | | Financials | 7.98 | 36 | 0.88% | 1.92% |
| REZI | Resideo | | Services & Goods | 19.18 | 0 | -0.57% | 1.91% |
| ANNX | Annexon | | Health Care | 4.64 | 39 | -2.21% | 1.86% |
| CDRE | Cadre | | Industrials | 33.58 | 57 | -0.43% | 1.84% |
| LCTX | Lineage Cell | | Health Care | 1.11 | 36 | -1.77% | 1.83% |
| JBLU | JetBlue Airways | | Transports | 5.65 | 15 | 1.16% | 1.80% |
| GLUE | Monte Rosa | | Health Care | 5.73 | 30 | -3.37% | 1.78% |
| For chart view version of above stock list: Chart View ➞ 0 - 25 , 25 - 50 , 50 - 75 , 75 - 100 , 100 - 125 , 125 - 150 , 150 - 175 , 175 - 200 , 200 - 225 , 225 - 250 , 250 - 275 , 275 - 300 , 300 - 325 , 325 - 350 , 350 - 375 , 375 - 400 , 400 - 425 , 425 - 450 , 450 - 475 , 475 - 500 , 500 - 525 , 525 - 550 , 550 - 575 , 575 - 600 , 600 - 625 , 625 - 650 , 650 - 675 , 675 - 700 , 700 - 725 , 725 - 750 , 750 - 775 , 775 - 800 , 800 - 825 , 825 - 850 , 850 - 875 , 875 - 900 , 900 - 925 , 925 - 950 , 950 - 975 , 975 - 1000 , 1000 - 1025 , 1025 - 1050 , 1050 - 1075 , 1075 - 1100 , 1100 - 1125 , 1125 - 1150 , 1150 - 1175 , 1175 - 1200 , 1200 - 1225 , 1225 - 1250 , 1250 - 1275 , 1275 - 1300 , 1300 - 1325 , 1325 - 1350 , 1350 - 1375 , 1375 - 1400 , 1400 - 1425 , 1425 - 1450 , 1450 - 1475 , 1475 - 1500 , 1500 - 1525 , 1525 - 1550 , 1550 - 1575 | ||
 | Click To Change The Sort Order: By Market Cap or Company Size Performance: Year-to-date, Week and Day |  |
| Too many stocks? View smallcap stocks filtered by marketcap & sector |
| Marketcap: All SmallCap Stocks (default-no microcap), Large, Mid-Range, Small |
| Smallcap Sector: Tech, Finance, Energy, Staples, Retail, Industrial, Materials, & Medical |
|
Get the most comprehensive stock market coverage daily at 12Stocks.com ➞ Best Stocks Today ➞ Best Stocks Weekly ➞ Best Stocks Year-to-Date ➞ Best Stocks Trends ➞  Best Stocks Today 12Stocks.com Best Nasdaq Stocks ➞ Best S&P 500 Stocks ➞ Best Tech Stocks ➞ Best Biotech Stocks ➞ |
| Detailed Overview of SmallCap Stocks |
| SmallCap Technical Overview, Leaders & Laggards, Top SmallCap ETF Funds & Detailed SmallCap Stocks List, Charts, Trends & More |
| Smallcap: Technical Analysis, Trends & YTD Performance | |
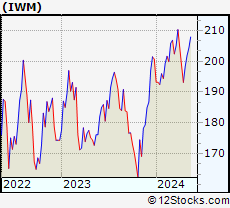
| SmallCap segment as represented by
IWM, an exchange-traded fund [ETF], holds basket of thousands of smallcap stocks from across all major sectors of the US stock market. The smallcap index (contains stocks like Riverbed & Sotheby's) is down by -1.78% and is currently underperforming the overall market by -6.59% year-to-date. Below is a quick view of technical charts and trends: | |
 IWM Weekly Chart |
|
| Long Term Trend: Not Good | |
| Medium Term Trend: Not Good | |
 IWM Daily Chart |
|
| Short Term Trend: Deteriorating | |
| Overall Trend Score: 24 | |
| YTD Performance: -1.78% | |
| **Trend Scores & Views Are Only For Educational Purposes And Not For Investing | |
| 12Stocks.com: Top Performing Small Cap Index Stocks | ||||||||||||||||||||||||||||||||||||||||||||||||
 The top performing Small Cap Index stocks year to date are
Now, more recently, over last week, the top performing Small Cap Index stocks on the move are


|
||||||||||||||||||||||||||||||||||||||||||||||||
| 12Stocks.com: Investing in Smallcap Index using Exchange Traded Funds | |
|
The following table shows list of key exchange traded funds (ETF) that
help investors track Smallcap index. The following list also includes leveraged ETF funds that track twice or thrice the daily returns of Smallcap indices. Short or inverse ETF funds move in the opposite direction to the index they track and are useful during market pullbacks or during bear markets. Quick View: Move mouse or cursor over ETF symbol (ticker) to view short-term technical chart and over ETF name to view long term chart. Click on ticker or stock name for detailed view. Click on to add stock symbol to your watchlist and to view watchlist. |
12Stocks.com List of ETFs that track Smallcap Index
| Ticker | ETF Name | Watchlist | Recent Price | Smart Investing & Trading Score | Change % | Week % | Year-to-date % |
| IWM | iShares Russell 2000 | | 197.13 | 24 | 0.42 | -0.64 | -1.78% |
| 12Stocks.com: Charts, Trends, Fundamental Data and Performances of SmallCap Stocks | |
|
We now take in-depth look at all SmallCap stocks including charts, multi-period performances and overall trends (as measured by Smart Investing & Trading Score). One can sort SmallCap stocks (click link to choose) by Daily, Weekly and by Year-to-Date performances. Also, one can sort by size of the company or by market capitalization. |
| Select Your Default Chart Type: | |||||
| |||||
| Click on stock symbol or name for detailed view. Click on to add stock symbol to your watchlist and to view watchlist. Quick View: Move mouse or cursor over "Daily" to quickly view daily technical stock chart and over "Weekly" to view weekly technical stock chart. | |||||

 | AVA Avista Corporation |
| Sector: Utilities | |
| SubSector: Diversified Utilities | |
| MarketCap: 2755.7 Millions | |
| Recent Price: 36.65 Smart Investing & Trading Score: 100 | |
| Day Percent Change: 0.03% Day Change: 0.01 | |
| Week Change: 3.09% Year-to-date Change: 2.6% | |
| AVA Links: Profile News Message Board | |
| Charts:- Daily , Weekly | |
| Add AVA to Watchlist: View: Get Complete AVA Trend Analysis ➞ | |
 | ORIC ORIC Pharmaceuticals, Inc. |
| Sector: Health Care | |
| SubSector: Biotechnology | |
| MarketCap: 12787 Millions | |
| Recent Price: 9.45 Smart Investing & Trading Score: 49 | |
| Day Percent Change: 1.23% Day Change: 0.12 | |
| Week Change: 17.04% Year-to-date Change: 2.4% | |
| ORIC Links: Profile News Message Board | |
| Charts:- Daily , Weekly | |
| Add ORIC to Watchlist: View: Get Complete ORIC Trend Analysis ➞ | |
 | GRBK Green Brick Partners, Inc. |
| Sector: Financials | |
| SubSector: Real Estate Development | |
| MarketCap: 341.819 Millions | |
| Recent Price: 53.20 Smart Investing & Trading Score: 17 | |
| Day Percent Change: -3.36% Day Change: -1.85 | |
| Week Change: -4.3% Year-to-date Change: 2.4% | |
| GRBK Links: Profile News Message Board | |
| Charts:- Daily , Weekly | |
| Add GRBK to Watchlist: View: Get Complete GRBK Trend Analysis ➞ | |
 | AX Axos Financial, Inc. |
| Sector: Financials | |
| SubSector: Savings & Loans | |
| MarketCap: 1037.3 Millions | |
| Recent Price: 55.89 Smart Investing & Trading Score: 100 | |
| Day Percent Change: 0.70% Day Change: 0.39 | |
| Week Change: 5.35% Year-to-date Change: 2.4% | |
| AX Links: Profile News Message Board | |
| Charts:- Daily , Weekly | |
| Add AX to Watchlist: View: Get Complete AX Trend Analysis ➞ | |
 | HBI Hanesbrands Inc. |
| Sector: Consumer Staples | |
| SubSector: Textile - Apparel Clothing | |
| MarketCap: 3559.75 Millions | |
| Recent Price: 4.57 Smart Investing & Trading Score: 37 | |
| Day Percent Change: 0.33% Day Change: 0.02 | |
| Week Change: 1.9% Year-to-date Change: 2.4% | |
| HBI Links: Profile News Message Board | |
| Charts:- Daily , Weekly | |
| Add HBI to Watchlist: View: Get Complete HBI Trend Analysis ➞ | |
 | GOOD Gladstone Commercial Corporation |
| Sector: Financials | |
| SubSector: REIT - Diversified | |
| MarketCap: 425.253 Millions | |
| Recent Price: 13.55 Smart Investing & Trading Score: 100 | |
| Day Percent Change: -0.07% Day Change: -0.01 | |
| Week Change: 1.65% Year-to-date Change: 2.3% | |
| GOOD Links: Profile News Message Board | |
| Charts:- Daily , Weekly | |
| Add GOOD to Watchlist: View: Get Complete GOOD Trend Analysis ➞ | |
 | AMRX Amneal Pharmaceuticals, Inc. |
| Sector: Health Care | |
| SubSector: Drug Related Products | |
| MarketCap: 1218.13 Millions | |
| Recent Price: 6.21 Smart Investing & Trading Score: 90 | |
| Day Percent Change: 1.47% Day Change: 0.09 | |
| Week Change: 5.79% Year-to-date Change: 2.3% | |
| AMRX Links: Profile News Message Board | |
| Charts:- Daily , Weekly | |
| Add AMRX to Watchlist: View: Get Complete AMRX Trend Analysis ➞ | |
 | EPC Edgewell Personal Care Company |
| Sector: Consumer Staples | |
| SubSector: Personal Products | |
| MarketCap: 1605.95 Millions | |
| Recent Price: 37.47 Smart Investing & Trading Score: 57 | |
| Day Percent Change: -0.16% Day Change: -0.06 | |
| Week Change: 0.11% Year-to-date Change: 2.3% | |
| EPC Links: Profile News Message Board | |
| Charts:- Daily , Weekly | |
| Add EPC to Watchlist: View: Get Complete EPC Trend Analysis ➞ | |
 | SQSP Squarespace, Inc. |
| Sector: Technology | |
| SubSector: Software - Infrastructure | |
| MarketCap: 4150 Millions | |
| Recent Price: 33.95 Smart Investing & Trading Score: 26 | |
| Day Percent Change: -0.73% Day Change: -0.25 | |
| Week Change: -4.45% Year-to-date Change: 2.3% | |
| SQSP Links: Profile News Message Board | |
| Charts:- Daily , Weekly | |
| Add SQSP to Watchlist: View: Get Complete SQSP Trend Analysis ➞ | |
 | CMPX Compass Therapeutics, Inc. |
| Sector: Health Care | |
| SubSector: Biotechnology | |
| MarketCap: 406 Millions | |
| Recent Price: 1.57 Smart Investing & Trading Score: 49 | |
| Day Percent Change: 0.00% Day Change: 0.00 | |
| Week Change: 8.28% Year-to-date Change: 2.3% | |
| CMPX Links: Profile News Message Board | |
| Charts:- Daily , Weekly | |
| Add CMPX to Watchlist: View: Get Complete CMPX Trend Analysis ➞ | |
 | FULT Fulton Financial Corporation |
| Sector: Financials | |
| SubSector: Regional - Northeast Banks | |
| MarketCap: 2030.89 Millions | |
| Recent Price: 16.82 Smart Investing & Trading Score: 81 | |
| Day Percent Change: -0.44% Day Change: -0.07 | |
| Week Change: 7.71% Year-to-date Change: 2.2% | |
| FULT Links: Profile News Message Board | |
| Charts:- Daily , Weekly | |
| Add FULT to Watchlist: View: Get Complete FULT Trend Analysis ➞ | |
 | AKR Acadia Realty Trust |
| Sector: Financials | |
| SubSector: Property Management | |
| MarketCap: 1367.42 Millions | |
| Recent Price: 17.35 Smart Investing & Trading Score: 46 | |
| Day Percent Change: 1.52% Day Change: 0.26 | |
| Week Change: 0.17% Year-to-date Change: 2.1% | |
| AKR Links: Profile News Message Board | |
| Charts:- Daily , Weekly | |
| Add AKR to Watchlist: View: Get Complete AKR Trend Analysis ➞ | |
 | ASB Associated Banc-Corp |
| Sector: Financials | |
| SubSector: Regional - Midwest Banks | |
| MarketCap: 1904.8 Millions | |
| Recent Price: 21.84 Smart Investing & Trading Score: 80 | |
| Day Percent Change: 1.30% Day Change: 0.28 | |
| Week Change: 1.25% Year-to-date Change: 2.1% | |
| ASB Links: Profile News Message Board | |
| Charts:- Daily , Weekly | |
| Add ASB to Watchlist: View: Get Complete ASB Trend Analysis ➞ | |
 | CARA Cara Therapeutics, Inc. |
| Sector: Health Care | |
| SubSector: Biotechnology | |
| MarketCap: 597.985 Millions | |
| Recent Price: 0.76 Smart Investing & Trading Score: 62 | |
| Day Percent Change: 0.00% Day Change: 0.00 | |
| Week Change: 10.86% Year-to-date Change: 2.1% | |
| CARA Links: Profile News Message Board | |
| Charts:- Daily , Weekly | |
| Add CARA to Watchlist: View: Get Complete CARA Trend Analysis ➞ | |
 | CSTL Castle Biosciences, Inc. |
| Sector: Health Care | |
| SubSector: Medical Laboratories & Research | |
| MarketCap: 545 Millions | |
| Recent Price: 22.03 Smart Investing & Trading Score: 100 | |
| Day Percent Change: 0.05% Day Change: 0.01 | |
| Week Change: 8.31% Year-to-date Change: 2.1% | |
| CSTL Links: Profile News Message Board | |
| Charts:- Daily , Weekly | |
| Add CSTL to Watchlist: View: Get Complete CSTL Trend Analysis ➞ | |
 | RGR Sturm, Ruger & Company, Inc. |
| Sector: Industrials | |
| SubSector: Aerospace/Defense Products & Services | |
| MarketCap: 752 Millions | |
| Recent Price: 46.38 Smart Investing & Trading Score: 83 | |
| Day Percent Change: -0.15% Day Change: -0.07 | |
| Week Change: -0.19% Year-to-date Change: 2.1% | |
| RGR Links: Profile News Message Board | |
| Charts:- Daily , Weekly | |
| Add RGR to Watchlist: View: Get Complete RGR Trend Analysis ➞ | |
 | DM Dominion Midstream Partners, LP |
| Sector: Energy | |
| SubSector: Oil & Gas Pipelines | |
| MarketCap: 3017.01 Millions | |
| Recent Price: 0.77 Smart Investing & Trading Score: 25 | |
| Day Percent Change: -2.47% Day Change: -0.02 | |
| Week Change: -6.74% Year-to-date Change: 2.0% | |
| DM Links: Profile News Message Board | |
| Charts:- Daily , Weekly | |
| Add DM to Watchlist: View: Get Complete DM Trend Analysis ➞ | |
 | ESNT Essent Group Ltd. |
| Sector: Financials | |
| SubSector: Mortgage Investment | |
| MarketCap: 2806.19 Millions | |
| Recent Price: 53.77 Smart Investing & Trading Score: 45 | |
| Day Percent Change: 0.34% Day Change: 0.18 | |
| Week Change: -0.39% Year-to-date Change: 2.0% | |
| ESNT Links: Profile News Message Board | |
| Charts:- Daily , Weekly | |
| Add ESNT to Watchlist: View: Get Complete ESNT Trend Analysis ➞ | |
 | AIV Apartment Investment and Management Company |
| Sector: Financials | |
| SubSector: REIT - Residential | |
| MarketCap: 4485.11 Millions | |
| Recent Price: 7.98 Smart Investing & Trading Score: 36 | |
| Day Percent Change: 0.88% Day Change: 0.07 | |
| Week Change: -0.87% Year-to-date Change: 1.9% | |
| AIV Links: Profile News Message Board | |
| Charts:- Daily , Weekly | |
| Add AIV to Watchlist: View: Get Complete AIV Trend Analysis ➞ | |
 | REZI Resideo Technologies, Inc. |
| Sector: Services & Goods | |
| SubSector: Security & Protection Services | |
| MarketCap: 712.603 Millions | |
| Recent Price: 19.18 Smart Investing & Trading Score: 0 | |
| Day Percent Change: -0.57% Day Change: -0.11 | |
| Week Change: -3.52% Year-to-date Change: 1.9% | |
| REZI Links: Profile News Message Board | |
| Charts:- Daily , Weekly | |
| Add REZI to Watchlist: View: Get Complete REZI Trend Analysis ➞ | |
 | ANNX Annexon, Inc. |
| Sector: Health Care | |
| SubSector: Biotechnology | |
| MarketCap: 94487 Millions | |
| Recent Price: 4.64 Smart Investing & Trading Score: 39 | |
| Day Percent Change: -2.21% Day Change: -0.11 | |
| Week Change: -1.17% Year-to-date Change: 1.9% | |
| ANNX Links: Profile News Message Board | |
| Charts:- Daily , Weekly | |
| Add ANNX to Watchlist: View: Get Complete ANNX Trend Analysis ➞ | |
 | CDRE Cadre Holdings, Inc. |
| Sector: Industrials | |
| SubSector: Aerospace & Defense | |
| MarketCap: 817 Millions | |
| Recent Price: 33.58 Smart Investing & Trading Score: 57 | |
| Day Percent Change: -0.43% Day Change: -0.14 | |
| Week Change: 1.37% Year-to-date Change: 1.8% | |
| CDRE Links: Profile News Message Board | |
| Charts:- Daily , Weekly | |
| Add CDRE to Watchlist: View: Get Complete CDRE Trend Analysis ➞ | |
 | LCTX Lineage Cell Therapeutics, Inc. |
| Sector: Health Care | |
| SubSector: Biotechnology | |
| MarketCap: 141.285 Millions | |
| Recent Price: 1.11 Smart Investing & Trading Score: 36 | |
| Day Percent Change: -1.77% Day Change: -0.02 | |
| Week Change: -2.63% Year-to-date Change: 1.8% | |
| LCTX Links: Profile News Message Board | |
| Charts:- Daily , Weekly | |
| Add LCTX to Watchlist: View: Get Complete LCTX Trend Analysis ➞ | |
 | JBLU JetBlue Airways Corporation |
| Sector: Transports | |
| SubSector: Regional Airlines | |
| MarketCap: 2383.1 Millions | |
| Recent Price: 5.65 Smart Investing & Trading Score: 15 | |
| Day Percent Change: 1.16% Day Change: 0.07 | |
| Week Change: -2.25% Year-to-date Change: 1.8% | |
| JBLU Links: Profile News Message Board | |
| Charts:- Daily , Weekly | |
| Add JBLU to Watchlist: View: Get Complete JBLU Trend Analysis ➞ | |
 | GLUE Monte Rosa Therapeutics, Inc. |
| Sector: Health Care | |
| SubSector: Biotechnology | |
| MarketCap: 346 Millions | |
| Recent Price: 5.73 Smart Investing & Trading Score: 30 | |
| Day Percent Change: -3.37% Day Change: -0.20 | |
| Week Change: 7.5% Year-to-date Change: 1.8% | |
| GLUE Links: Profile News Message Board | |
| Charts:- Daily , Weekly | |
| Add GLUE to Watchlist: View: Get Complete GLUE Trend Analysis ➞ | |
| For tabular summary view of above stock list: Summary View ➞ 0 - 25 , 25 - 50 , 50 - 75 , 75 - 100 , 100 - 125 , 125 - 150 , 150 - 175 , 175 - 200 , 200 - 225 , 225 - 250 , 250 - 275 , 275 - 300 , 300 - 325 , 325 - 350 , 350 - 375 , 375 - 400 , 400 - 425 , 425 - 450 , 450 - 475 , 475 - 500 , 500 - 525 , 525 - 550 , 550 - 575 , 575 - 600 , 600 - 625 , 625 - 650 , 650 - 675 , 675 - 700 , 700 - 725 , 725 - 750 , 750 - 775 , 775 - 800 , 800 - 825 , 825 - 850 , 850 - 875 , 875 - 900 , 900 - 925 , 925 - 950 , 950 - 975 , 975 - 1000 , 1000 - 1025 , 1025 - 1050 , 1050 - 1075 , 1075 - 1100 , 1100 - 1125 , 1125 - 1150 , 1150 - 1175 , 1175 - 1200 , 1200 - 1225 , 1225 - 1250 , 1250 - 1275 , 1275 - 1300 , 1300 - 1325 , 1325 - 1350 , 1350 - 1375 , 1375 - 1400 , 1400 - 1425 , 1425 - 1450 , 1450 - 1475 , 1475 - 1500 , 1500 - 1525 , 1525 - 1550 , 1550 - 1575 | ||
| Click To Change The Sort Order: By Market Cap or Company Size Performance: Year-to-date, Week and Day | |
| Select Chart Type: | ||
| Too many stocks? View smallcap stocks filtered by marketcap & sector |
| Marketcap: All SmallCap Stocks (default-no microcap), Large, Mid-Range, Small & MicroCap |
| Sector: Tech, Finance, Energy, Staples, Retail, Industrial, Materials, Utilities & Medical |
|
Best Stocks Today 12Stocks.com |
© 2024 12Stocks.com Terms & Conditions Privacy Contact Us
All Information Provided Only For Education And Not To Be Used For Investing or Trading. See Terms & Conditions


One More Thing ... Get Best Stocks Delivered Daily!
Never Ever Miss A Move With Our Top Ten Stocks Lists
Find Best Stocks In Any Market - Bull or Bear Market
Take A Peek At Our Top Ten Stocks Lists: Daily, Weekly, Year-to-Date & Top Trends
Find Best Stocks In Any Market - Bull or Bear Market
Take A Peek At Our Top Ten Stocks Lists: Daily, Weekly, Year-to-Date & Top Trends
Smallcap Stocks With Best Up Trends [0-bearish to 100-bullish]: Gannett Co[100], Pitney Bowes[100], Sprouts Farmers[100], Herbalife Nutrition[100], UFP [100], Carriage Services[100], Fluence Energy[100], Gray Television[100], USCB Financial[100], Outbrain [100], BankUnited [100]
Best Smallcap Stocks Year-to-Date:
Janux [434.2%], Longboard [253.44%], Alpine Immune[239.36%], Avidity Biosciences[180.42%], Cullinan Oncology[171.9%], Bakkt [169.51%], Vera [168.8%], Arcutis Bio[163.93%], Super Micro[150.63%], Y-mAbs [145.23%], Sana [130.96%] Best Smallcap Stocks This Week:
Emergent BioSolutions[61.72%], Eyenovia [44.86%], Cue Biopharma[35.9%], Poseida [34.51%], P3 Health[30.18%], Surmodics [29.08%], Phibro Animal[28.91%], TransMedics Group[28.2%], Enovix [27.36%], MediaAlpha [26.88%], Seres [26.67%] Best Smallcap Stocks Daily:
Emergent BioSolutions[60.88%], Enovix [26.38%], Gannett Co[23.65%], Office Properties[22.00%], Perdoceo Education[19.25%], Pitney Bowes[18.76%], Benchmark Electronics[17.86%], Butterfly [16.81%], Pulmonx [15.80%], MediaAlpha [13.63%], Sunnova Energy[13.46%]