
 Login Sign Up


| |||||
 |  | ||||

| 12Stocks.com Market Intelligence |
Best SmallCap Stocks
|
| In a hurry? Small Cap Stock Lists: Performance Trends Table, Stock Charts
Sort Small Cap stocks: Daily, Weekly, Year-to-Date, Market Cap & Trends. Filter Small Cap stocks list by sector: Show all, Tech, Finance, Energy, Staples, Retail, Industrial, Materials, Utilities and HealthCare Filter Small Cap stocks list by size: All Large Medium Small and MicroCap |
| 12Stocks.com Small Cap Stocks Performances & Trends Daily | |||||||||
|
|  The overall Smart Investing & Trading Score is 69 (0-bearish to 100-bullish) which puts Small Cap index in short term neutral to bullish trend. The Smart Investing & Trading Score from previous trading session is 49 and hence an improvement of trend.
| ||||||||
Here are the Smart Investing & Trading Scores of the most requested small cap stocks at 12Stocks.com (click stock name for detailed review):
|


| 12Stocks.com: Investing in Smallcap Index with Stocks | |
|
The following table helps investors and traders sort through current performance and trends (as measured by Smart Investing & Trading Score) of various
stocks in the Smallcap Index. Quick View: Move mouse or cursor over stock symbol (ticker) to view short-term technical chart and over stock name to view long term chart. Click on  to add stock symbol to your watchlist and to add stock symbol to your watchlist and  to view watchlist. Click on any ticker or stock name for detailed market intelligence report for that stock. to view watchlist. Click on any ticker or stock name for detailed market intelligence report for that stock. |
12Stocks.com Performance of Stocks in Smallcap Index
| Ticker | Stock Name | Watchlist | Category | Recent Price | Smart Investing & Trading Score | Change % | YTD Change% |
| HAYN | Haynes |   | Industrials | 59.24 | 13 | -0.72% | 3.84% |
| CMPR | Cimpress | | Services & Goods | 83.09 | 17 | 0.61% | 3.80% |
| TCBX | Third Coast | | Financials | 20.77 | 100 | 0.78% | 3.80% |
| MORF | Morphic Holding | | Health Care | 29.90 | 74 | 4.14% | 3.53% |
| MUR | Murphy Oil | | Energy | 44.15 | 46 | -0.16% | 3.49% |
| LGND | Ligand | | Health Care | 73.90 | 49 | 2.18% | 3.47% |
| TRS | TriMas | | Industrials | 26.21 | 80 | -0.04% | 3.47% |
| FULT | Fulton Financial | | Financials | 17.03 | 95 | 0.35% | 3.46% |
| MATX | Matson | | Transports | 113.36 | 90 | 3.90% | 3.43% |
| SWIM | Latham Group | | Industrials | 2.73 | 22 | 13.51% | 3.41% |
| ESNT | Essent Group | | Financials | 54.54 | 80 | 0.48% | 3.41% |
| BKH | Black Hills | | Utilities | 55.77 | 95 | -0.38% | 3.37% |
| OTTR | Otter Tail | | Utilities | 87.82 | 64 | 0.88% | 3.35% |
| SKIN | Beauty Health | | Consumer Staples | 3.27 | 49 | 3.15% | 3.32% |
| WOR | Worthington Industries | | Materials | 59.45 | 67 | 1.52% | 3.30% |
| CNNE | Cannae | | Financials | 20.15 | 37 | 2.13% | 3.28% |
| VIR | Vir | | Health Care | 10.39 | 74 | 13.18% | 3.28% |
| ACA | Arcosa | | Industrials | 85.33 | 100 | 9.96% | 3.26% |
| EPC | Edgewell Personal | | Consumer Staples | 37.82 | 57 | -0.40% | 3.25% |
| RGR | Sturm Ruger | | Industrials | 46.92 | 95 | 0.15% | 3.23% |
| ALXO | ALX Oncology | | Health Care | 15.36 | 63 | -7.58% | 3.23% |
| BCO | Brink s | | Services & Goods | 90.58 | 95 | 1.91% | 2.99% |
| CYRX | Cryoport | | Consumer Staples | 15.95 | 17 | -7.05% | 2.97% |
| PRK | Park National | | Financials | 136.79 | 100 | 0.29% | 2.96% |
| GLUE | Monte Rosa | | Health Care | 5.79 | 30 | 4.51% | 2.84% |


| Too many stocks? View smallcap stocks filtered by marketcap & sector |
| Marketcap: All SmallCap Stocks (default-no microcap), Large, Mid-Range, Small |
| Smallcap Sector: Tech, Finance, Energy, Staples, Retail, Industrial, Materials, & Medical |
|
Get the most comprehensive stock market coverage daily at 12Stocks.com ➞ Best Stocks Today ➞ Best Stocks Weekly ➞ Best Stocks Year-to-Date ➞ Best Stocks Trends ➞  Best Stocks Today 12Stocks.com Best Nasdaq Stocks ➞ Best S&P 500 Stocks ➞ Best Tech Stocks ➞ Best Biotech Stocks ➞ |
| Detailed Overview of SmallCap Stocks |
| SmallCap Technical Overview, Leaders & Laggards, Top SmallCap ETF Funds & Detailed SmallCap Stocks List, Charts, Trends & More |
| Smallcap: Technical Analysis, Trends & YTD Performance | |
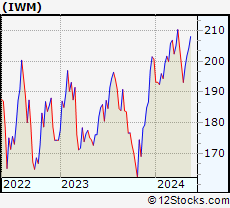
| SmallCap segment as represented by
IWM, an exchange-traded fund [ETF], holds basket of thousands of smallcap stocks from across all major sectors of the US stock market. The smallcap index (contains stocks like Riverbed & Sotheby's) is up by 0.59% and is currently underperforming the overall market by -6.29% year-to-date. Below is a quick view of technical charts and trends: | |
 IWM Weekly Chart |
|
| Long Term Trend: Not Good | |
| Medium Term Trend: Very Good | |
 IWM Daily Chart |
|
| Short Term Trend: Very Good | |
| Overall Trend Score: 69 | |
| YTD Performance: 0.59% | |
| **Trend Scores & Views Are Only For Educational Purposes And Not For Investing | |
| 12Stocks.com: Top Performing Small Cap Index Stocks | ||||||||||||||||||||||||||||||||||||||||||||||||
 The top performing Small Cap Index stocks year to date are
Now, more recently, over last week, the top performing Small Cap Index stocks on the move are


|
||||||||||||||||||||||||||||||||||||||||||||||||
| 12Stocks.com: Investing in Smallcap Index using Exchange Traded Funds | |
|
The following table shows list of key exchange traded funds (ETF) that
help investors track Smallcap index. The following list also includes leveraged ETF funds that track twice or thrice the daily returns of Smallcap indices. Short or inverse ETF funds move in the opposite direction to the index they track and are useful during market pullbacks or during bear markets. Quick View: Move mouse or cursor over ETF symbol (ticker) to view short-term technical chart and over ETF name to view long term chart. Click on ticker or stock name for detailed view. Click on to add stock symbol to your watchlist and to view watchlist. |
12Stocks.com List of ETFs that track Smallcap Index
| Ticker | ETF Name | Watchlist | Recent Price | Smart Investing & Trading Score | Change % | Week % | Year-to-date % |
| IWM | iShares Russell 2000 | | 201.90 | 69 | 0.99 | 1.77 | 0.59% |
| IJR | iShares Core S&P Small-Cap | | 107.13 | 82 | 0.75 | 1.4 | -1.03% |
| VTWO | Vanguard Russell 2000 ETF | | 81.61 | 69 | 0.94 | 1.73 | 0.63% |
| IWN | iShares Russell 2000 Value | | 154.21 | 100 | 0.87 | 2.03 | -0.72% |
| IJS | iShares S&P Small-Cap 600 Value | | 98.72 | 64 | 0.71 | 1.57 | -4.22% |
| IWO | iShares Russell 2000 Growth | | 256.87 | 57 | 0.99 | 1.49 | 1.84% |
| IJT | iShares S&P Small-Cap 600 Growth | | 127.76 | 95 | 0.82 | 1.32 | 2.09% |
| XSLV | PowerShares S&P SmallCap Low Volatil ETF | | 43.22 | 87 | 0.19 | 1.17 | -2.11% |
| SBB | ProShares Short SmallCap600 | | 16.16 | 13 | -1.28 | -1.37 | 1.44% |
| SDD | ProShares UltraShort SmallCap600 | | 18.84 | 23 | -2.41 | -2.61 | 2.27% |
| SAA | ProShares Ultra SmallCap600 | | 23.59 | 69 | 2.86 | 2.39 | -5.45% |
| SMLV | SPDR SSGA US Small Cap Low Volatil ETF | | 109.69 | 87 | 0.78 | 2.01 | -2.52% |
| 12Stocks.com: Charts, Trends, Fundamental Data and Performances of SmallCap Stocks | |
|
We now take in-depth look at all SmallCap stocks including charts, multi-period performances and overall trends (as measured by Smart Investing & Trading Score). One can sort SmallCap stocks (click link to choose) by Daily, Weekly and by Year-to-Date performances. Also, one can sort by size of the company or by market capitalization. |
| Select Your Default Chart Type: | |||||
| |||||
| Click on stock symbol or name for detailed view. Click on to add stock symbol to your watchlist and to view watchlist. Quick View: Move mouse or cursor over "Daily" to quickly view daily technical stock chart and over "Weekly" to view weekly technical stock chart. | |||||

 | HAYN Haynes International, Inc. |
| Sector: Industrials | |
| SubSector: Metal Fabrication | |
| MarketCap: 245.75 Millions | |
| Recent Price: 59.24 Smart Investing & Trading Score: 13 | |
| Day Percent Change: -0.72% Day Change: -0.43 | |
| Week Change: -1.77% Year-to-date Change: 3.8% | |
| HAYN Links: Profile News Message Board | |
| Charts:- Daily , Weekly | |
| Add HAYN to Watchlist: View: Get Complete HAYN Trend Analysis ➞ | |
 | CMPR Cimpress plc |
| Sector: Services & Goods | |
| SubSector: Business Services | |
| MarketCap: 1675.02 Millions | |
| Recent Price: 83.09 Smart Investing & Trading Score: 17 | |
| Day Percent Change: 0.61% Day Change: 0.50 | |
| Week Change: -6.72% Year-to-date Change: 3.8% | |
| CMPR Links: Profile News Message Board | |
| Charts:- Daily , Weekly | |
| Add CMPR to Watchlist: View: Get Complete CMPR Trend Analysis ➞ | |
 | TCBX Third Coast Bancshares, Inc. |
| Sector: Financials | |
| SubSector: Banks - Regional | |
| MarketCap: 212 Millions | |
| Recent Price: 20.77 Smart Investing & Trading Score: 100 | |
| Day Percent Change: 0.78% Day Change: 0.16 | |
| Week Change: 4.37% Year-to-date Change: 3.8% | |
| TCBX Links: Profile News Message Board | |
| Charts:- Daily , Weekly | |
| Add TCBX to Watchlist: View: Get Complete TCBX Trend Analysis ➞ | |
 | MORF Morphic Holding, Inc. |
| Sector: Health Care | |
| SubSector: Biotechnology | |
| MarketCap: 484.885 Millions | |
| Recent Price: 29.90 Smart Investing & Trading Score: 74 | |
| Day Percent Change: 4.14% Day Change: 1.19 | |
| Week Change: 6.52% Year-to-date Change: 3.5% | |
| MORF Links: Profile News Message Board | |
| Charts:- Daily , Weekly | |
| Add MORF to Watchlist: View: Get Complete MORF Trend Analysis ➞ | |
 | MUR Murphy Oil Corporation |
| Sector: Energy | |
| SubSector: Independent Oil & Gas | |
| MarketCap: 985.993 Millions | |
| Recent Price: 44.15 Smart Investing & Trading Score: 46 | |
| Day Percent Change: -0.16% Day Change: -0.07 | |
| Week Change: -4.93% Year-to-date Change: 3.5% | |
| MUR Links: Profile News Message Board | |
| Charts:- Daily , Weekly | |
| Add MUR to Watchlist: View: Get Complete MUR Trend Analysis ➞ | |
 | LGND Ligand Pharmaceuticals Incorporated |
| Sector: Health Care | |
| SubSector: Biotechnology | |
| MarketCap: 1344.45 Millions | |
| Recent Price: 73.90 Smart Investing & Trading Score: 49 | |
| Day Percent Change: 2.18% Day Change: 1.58 | |
| Week Change: 4.72% Year-to-date Change: 3.5% | |
| LGND Links: Profile News Message Board | |
| Charts:- Daily , Weekly | |
| Add LGND to Watchlist: View: Get Complete LGND Trend Analysis ➞ | |
 | TRS TriMas Corporation |
| Sector: Industrials | |
| SubSector: Industrial Equipment & Components | |
| MarketCap: 963.509 Millions | |
| Recent Price: 26.21 Smart Investing & Trading Score: 80 | |
| Day Percent Change: -0.04% Day Change: -0.01 | |
| Week Change: -1.02% Year-to-date Change: 3.5% | |
| TRS Links: Profile News Message Board | |
| Charts:- Daily , Weekly | |
| Add TRS to Watchlist: View: Get Complete TRS Trend Analysis ➞ | |
 | FULT Fulton Financial Corporation |
| Sector: Financials | |
| SubSector: Regional - Northeast Banks | |
| MarketCap: 2030.89 Millions | |
| Recent Price: 17.03 Smart Investing & Trading Score: 95 | |
| Day Percent Change: 0.35% Day Change: 0.06 | |
| Week Change: 9.03% Year-to-date Change: 3.5% | |
| FULT Links: Profile News Message Board | |
| Charts:- Daily , Weekly | |
| Add FULT to Watchlist: View: Get Complete FULT Trend Analysis ➞ | |
 | MATX Matson, Inc. |
| Sector: Transports | |
| SubSector: Shipping | |
| MarketCap: 1509.94 Millions | |
| Recent Price: 113.36 Smart Investing & Trading Score: 90 | |
| Day Percent Change: 3.90% Day Change: 4.25 | |
| Week Change: 4.06% Year-to-date Change: 3.4% | |
| MATX Links: Profile News Message Board | |
| Charts:- Daily , Weekly | |
| Add MATX to Watchlist: View: Get Complete MATX Trend Analysis ➞ | |
 | SWIM Latham Group, Inc. |
| Sector: Industrials | |
| SubSector: Building Products & Equipment | |
| MarketCap: 388 Millions | |
| Recent Price: 2.73 Smart Investing & Trading Score: 22 | |
| Day Percent Change: 13.51% Day Change: 0.33 | |
| Week Change: -10.49% Year-to-date Change: 3.4% | |
| SWIM Links: Profile News Message Board | |
| Charts:- Daily , Weekly | |
| Add SWIM to Watchlist: View: Get Complete SWIM Trend Analysis ➞ | |
 | ESNT Essent Group Ltd. |
| Sector: Financials | |
| SubSector: Mortgage Investment | |
| MarketCap: 2806.19 Millions | |
| Recent Price: 54.54 Smart Investing & Trading Score: 80 | |
| Day Percent Change: 0.48% Day Change: 0.26 | |
| Week Change: 1.04% Year-to-date Change: 3.4% | |
| ESNT Links: Profile News Message Board | |
| Charts:- Daily , Weekly | |
| Add ESNT to Watchlist: View: Get Complete ESNT Trend Analysis ➞ | |
 | BKH Black Hills Corporation |
| Sector: Utilities | |
| SubSector: Electric Utilities | |
| MarketCap: 3666.94 Millions | |
| Recent Price: 55.77 Smart Investing & Trading Score: 95 | |
| Day Percent Change: -0.38% Day Change: -0.21 | |
| Week Change: 3.55% Year-to-date Change: 3.4% | |
| BKH Links: Profile News Message Board | |
| Charts:- Daily , Weekly | |
| Add BKH to Watchlist: View: Get Complete BKH Trend Analysis ➞ | |
 | OTTR Otter Tail Corporation |
| Sector: Utilities | |
| SubSector: Diversified Utilities | |
| MarketCap: 1728.2 Millions | |
| Recent Price: 87.82 Smart Investing & Trading Score: 64 | |
| Day Percent Change: 0.88% Day Change: 0.77 | |
| Week Change: 3.83% Year-to-date Change: 3.4% | |
| OTTR Links: Profile News Message Board | |
| Charts:- Daily , Weekly | |
| Add OTTR to Watchlist: View: Get Complete OTTR Trend Analysis ➞ | |
 | SKIN The Beauty Health Company |
| Sector: Consumer Staples | |
| SubSector: Household & Personal Products | |
| MarketCap: 1070 Millions | |
| Recent Price: 3.27 Smart Investing & Trading Score: 49 | |
| Day Percent Change: 3.15% Day Change: 0.10 | |
| Week Change: 1.24% Year-to-date Change: 3.3% | |
| SKIN Links: Profile News Message Board | |
| Charts:- Daily , Weekly | |
| Add SKIN to Watchlist: View: Get Complete SKIN Trend Analysis ➞ | |
 | WOR Worthington Industries, Inc. |
| Sector: Materials | |
| SubSector: Steel & Iron | |
| MarketCap: 1354.48 Millions | |
| Recent Price: 59.45 Smart Investing & Trading Score: 67 | |
| Day Percent Change: 1.52% Day Change: 0.89 | |
| Week Change: 1.78% Year-to-date Change: 3.3% | |
| WOR Links: Profile News Message Board | |
| Charts:- Daily , Weekly | |
| Add WOR to Watchlist: View: Get Complete WOR Trend Analysis ➞ | |
 | CNNE Cannae Holdings, Inc. |
| Sector: Financials | |
| SubSector: Asset Management | |
| MarketCap: 2625.53 Millions | |
| Recent Price: 20.15 Smart Investing & Trading Score: 37 | |
| Day Percent Change: 2.13% Day Change: 0.42 | |
| Week Change: 0.8% Year-to-date Change: 3.3% | |
| CNNE Links: Profile News Message Board | |
| Charts:- Daily , Weekly | |
| Add CNNE to Watchlist: View: Get Complete CNNE Trend Analysis ➞ | |
 | VIR Vir Biotechnology, Inc. |
| Sector: Health Care | |
| SubSector: Biotechnology | |
| MarketCap: 3916.75 Millions | |
| Recent Price: 10.39 Smart Investing & Trading Score: 74 | |
| Day Percent Change: 13.18% Day Change: 1.21 | |
| Week Change: 26.25% Year-to-date Change: 3.3% | |
| VIR Links: Profile News Message Board | |
| Charts:- Daily , Weekly | |
| Add VIR to Watchlist: View: Get Complete VIR Trend Analysis ➞ | |
 | ACA Arcosa, Inc. |
| Sector: Industrials | |
| SubSector: Farm & Construction Machinery | |
| MarketCap: 1692.57 Millions | |
| Recent Price: 85.33 Smart Investing & Trading Score: 100 | |
| Day Percent Change: 9.96% Day Change: 7.73 | |
| Week Change: 10.33% Year-to-date Change: 3.3% | |
| ACA Links: Profile News Message Board | |
| Charts:- Daily , Weekly | |
| Add ACA to Watchlist: View: Get Complete ACA Trend Analysis ➞ | |
 | EPC Edgewell Personal Care Company |
| Sector: Consumer Staples | |
| SubSector: Personal Products | |
| MarketCap: 1605.95 Millions | |
| Recent Price: 37.82 Smart Investing & Trading Score: 57 | |
| Day Percent Change: -0.40% Day Change: -0.15 | |
| Week Change: 1.04% Year-to-date Change: 3.3% | |
| EPC Links: Profile News Message Board | |
| Charts:- Daily , Weekly | |
| Add EPC to Watchlist: View: Get Complete EPC Trend Analysis ➞ | |
 | RGR Sturm, Ruger & Company, Inc. |
| Sector: Industrials | |
| SubSector: Aerospace/Defense Products & Services | |
| MarketCap: 752 Millions | |
| Recent Price: 46.92 Smart Investing & Trading Score: 95 | |
| Day Percent Change: 0.15% Day Change: 0.07 | |
| Week Change: 0.97% Year-to-date Change: 3.2% | |
| RGR Links: Profile News Message Board | |
| Charts:- Daily , Weekly | |
| Add RGR to Watchlist: View: Get Complete RGR Trend Analysis ➞ | |
 | ALXO ALX Oncology Holdings Inc. |
| Sector: Health Care | |
| SubSector: Biotechnology | |
| MarketCap: 41787 Millions | |
| Recent Price: 15.36 Smart Investing & Trading Score: 63 | |
| Day Percent Change: -7.58% Day Change: -1.26 | |
| Week Change: -8.9% Year-to-date Change: 3.2% | |
| ALXO Links: Profile News Message Board | |
| Charts:- Daily , Weekly | |
| Add ALXO to Watchlist: View: Get Complete ALXO Trend Analysis ➞ | |
 | BCO The Brink s Company |
| Sector: Services & Goods | |
| SubSector: Security & Protection Services | |
| MarketCap: 2544.73 Millions | |
| Recent Price: 90.58 Smart Investing & Trading Score: 95 | |
| Day Percent Change: 1.91% Day Change: 1.70 | |
| Week Change: 2.08% Year-to-date Change: 3.0% | |
| BCO Links: Profile News Message Board | |
| Charts:- Daily , Weekly | |
| Add BCO to Watchlist: View: Get Complete BCO Trend Analysis ➞ | |
 | CYRX Cryoport, Inc. |
| Sector: Consumer Staples | |
| SubSector: Packaging & Containers | |
| MarketCap: 576.653 Millions | |
| Recent Price: 15.95 Smart Investing & Trading Score: 17 | |
| Day Percent Change: -7.05% Day Change: -1.21 | |
| Week Change: -2.63% Year-to-date Change: 3.0% | |
| CYRX Links: Profile News Message Board | |
| Charts:- Daily , Weekly | |
| Add CYRX to Watchlist: View: Get Complete CYRX Trend Analysis ➞ | |
 | PRK Park National Corporation |
| Sector: Financials | |
| SubSector: Regional - Midwest Banks | |
| MarketCap: 1416.6 Millions | |
| Recent Price: 136.79 Smart Investing & Trading Score: 100 | |
| Day Percent Change: 0.29% Day Change: 0.39 | |
| Week Change: 1.83% Year-to-date Change: 3.0% | |
| PRK Links: Profile News Message Board | |
| Charts:- Daily , Weekly | |
| Add PRK to Watchlist: View: Get Complete PRK Trend Analysis ➞ | |
 | GLUE Monte Rosa Therapeutics, Inc. |
| Sector: Health Care | |
| SubSector: Biotechnology | |
| MarketCap: 346 Millions | |
| Recent Price: 5.79 Smart Investing & Trading Score: 30 | |
| Day Percent Change: 4.51% Day Change: 0.25 | |
| Week Change: 8.63% Year-to-date Change: 2.8% | |
| GLUE Links: Profile News Message Board | |
| Charts:- Daily , Weekly | |
| Add GLUE to Watchlist: View: Get Complete GLUE Trend Analysis ➞ | |
| Too many stocks? View smallcap stocks filtered by marketcap & sector |
| Marketcap: All SmallCap Stocks (default-no microcap), Large, Mid-Range, Small & MicroCap |
| Sector: Tech, Finance, Energy, Staples, Retail, Industrial, Materials, Utilities & Medical |
|
Best Stocks Today 12Stocks.com |
© 2024 12Stocks.com Terms & Conditions Privacy Contact Us
All Information Provided Only For Education And Not To Be Used For Investing or Trading. See Terms & Conditions


One More Thing ... Get Best Stocks Delivered Daily!
Never Ever Miss A Move With Our Top Ten Stocks Lists
Find Best Stocks In Any Market - Bull or Bear Market
Take A Peek At Our Top Ten Stocks Lists: Daily, Weekly, Year-to-Date & Top Trends
Find Best Stocks In Any Market - Bull or Bear Market
Take A Peek At Our Top Ten Stocks Lists: Daily, Weekly, Year-to-Date & Top Trends
Smallcap Stocks With Best Up Trends [0-bearish to 100-bullish]: Twist Bioscience[100], WideOpenWest [100], Joint [100], FTC Solar[100], Origin Materials[100], Alignment Healthcare[100], Clarus [100], IES [100], Emergent BioSolutions[100], Enovix [100], El Pollo[100]
Best Smallcap Stocks Year-to-Date:
Janux [482.74%], Viking [313.59%], Longboard [272.5%], Alpine Immune[239.29%], Bakkt [199.55%], Avidity Biosciences[192.48%], Vera [189.47%], Cullinan Oncology[176.9%], Super Micro[175.35%], Y-mAbs [151.47%], Sana [149.33%] Best Smallcap Stocks This Week:
Emergent BioSolutions[102.6%], Deciphera [73.24%], Origin Materials[66.52%], Eyenovia [60.78%], Cue Biopharma[56.04%], Aspen Aerogels[55.96%], Enovix [54.02%], Luna Innovations[53.77%], Codexis [47.37%], Carvana Co[44.31%], Office Properties[42.79%] Best Smallcap Stocks Daily:
Luna Innovations[36.00%], Twist Bioscience[28.74%], Ardelyx [28.42%], WideOpenWest [28.23%], 2U [26.63%], Joint [25.35%], FTC Solar[25.09%], Origin Materials[22.23%], Alignment Healthcare[21.97%], Clarus [18.67%], Aurora Innovation[18.09%]