
 Login Sign Up


| |||||
 |  | ||||

| 12Stocks.com Market Intelligence |
Best SmallCap Stocks
|
| In a hurry? Small Cap Stock Lists: Performance Trends Table, Stock Charts
Sort Small Cap stocks: Daily, Weekly, Year-to-Date, Market Cap & Trends. Filter Small Cap stocks list by sector: Show all, Tech, Finance, Energy, Staples, Retail, Industrial, Materials, Utilities and HealthCare Filter Small Cap stocks list by size: All Large Medium Small and MicroCap |
| 12Stocks.com Small Cap Stocks Performances & Trends Daily | |||||||||
|
|  The overall Smart Investing & Trading Score is 26 (0-bearish to 100-bullish) which puts Small Cap index in short term bearish to neutral trend. The Smart Investing & Trading Score from previous trading session is 31 and a deterioration of trend continues.
| ||||||||
Here are the Smart Investing & Trading Scores of the most requested small cap stocks at 12Stocks.com (click stock name for detailed review):
|


| 12Stocks.com: Investing in Smallcap Index with Stocks | |
|
The following table helps investors and traders sort through current performance and trends (as measured by Smart Investing & Trading Score) of various
stocks in the Smallcap Index. Quick View: Move mouse or cursor over stock symbol (ticker) to view short-term technical chart and over stock name to view long term chart. Click on  to add stock symbol to your watchlist and to add stock symbol to your watchlist and  to view watchlist. Click on any ticker or stock name for detailed market intelligence report for that stock. to view watchlist. Click on any ticker or stock name for detailed market intelligence report for that stock. |
12Stocks.com Performance of Stocks in Smallcap Index
| Ticker | Stock Name | Watchlist | Category | Recent Price | Smart Investing & Trading Score | Change % | YTD Change% |
| NN | NextNav |   | Technology | 8.01 | 88 | 13.54% | 80.00% |
| OCUL | Ocular Therapeutix | | Health Care | 7.80 | 41 | 0.00% | 74.89% |
| FIP | FTAI Infrastructure | | Industrials | 6.76 | 51 | -0.81% | 73.91% |
| MAX | MediaAlpha | | Technology | 19.28 | 41 | 0.26% | 73.38% |
| MGNX | MacroGenics | | Health Care | 16.67 | 46 | -1.59% | 73.28% |
| HRTX | Heron | | Health Care | 2.94 | 65 | -0.51% | 72.65% |
| TARS | Tarsus | | Health Care | 34.95 | 36 | 0.01% | 72.31% |
| OSCR | Oscar Health | | Health Care | 15.68 | 95 | 5.95% | 72.21% |
| GERN | Geron | | Health Care | 3.60 | 63 | 4.35% | 70.62% |
| CGEM | Cullinan Oncology | | Health Care | 17.33 | 53 | 4.71% | 69.99% |
| ARIS | Aris Water | | Utilities | 13.95 | 36 | -0.85% | 66.27% |
| ENTA | Enanta | | Health Care | 15.38 | 36 | -4.77% | 63.44% |
| EVER | EverQuote | | Financials | 19.86 | 83 | 3.55% | 62.25% |
| SPRY | ARS | | Health Care | 9.21 | 46 | -0.27% | 62.09% |
| MRSN | Mersana | | Health Care | 3.75 | 68 | -1.06% | 61.64% |
| VITL | Vital Farms | | Consumer Staples | 25.18 | 61 | 1.21% | 60.38% |
| SIGA | SIGA | | Health Care | 8.93 | 51 | 0.56% | 59.46% |
| PROK | ProKidney | | Health Care | 2.73 | 100 | 30.62% | 56.45% |
| XFOR | X4 | | Health Care | 1.31 | 46 | 4.80% | 56.23% |
| DXPE | DXP Enterprises | | Services & Goods | 52.49 | 36 | -0.90% | 55.77% |
| FTAI | Fortress Transportation | | Transports | 71.72 | 65 | 0.99% | 54.58% |
| DOOR | Masonite | | Industrials | 130.68 | 61 | 0.25% | 54.36% |
| PAYS | PaySign | | Services & Goods | 4.32 | 51 | 6.40% | 54.29% |
| SMR | NuScale Power | | Industrials | 4.97 | 46 | 2.47% | 54.11% |
| PRM | Perimeter Solutions | | Materials | 7.06 | 36 | -0.70% | 53.65% |


| Too many stocks? View smallcap stocks filtered by marketcap & sector |
| Marketcap: All SmallCap Stocks (default-no microcap), Large, Mid-Range, Small |
| Smallcap Sector: Tech, Finance, Energy, Staples, Retail, Industrial, Materials, & Medical |
|
Get the most comprehensive stock market coverage daily at 12Stocks.com ➞ Best Stocks Today ➞ Best Stocks Weekly ➞ Best Stocks Year-to-Date ➞ Best Stocks Trends ➞  Best Stocks Today 12Stocks.com Best Nasdaq Stocks ➞ Best S&P 500 Stocks ➞ Best Tech Stocks ➞ Best Biotech Stocks ➞ |
| Detailed Overview of SmallCap Stocks |
| SmallCap Technical Overview, Leaders & Laggards, Top SmallCap ETF Funds & Detailed SmallCap Stocks List, Charts, Trends & More |
| Smallcap: Technical Analysis, Trends & YTD Performance | |
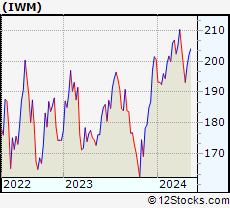
| SmallCap segment as represented by
IWM, an exchange-traded fund [ETF], holds basket of thousands of smallcap stocks from across all major sectors of the US stock market. The smallcap index (contains stocks like Riverbed & Sotheby's) is down by -2.82% and is currently underperforming the overall market by -7.84% year-to-date. Below is a quick view of technical charts and trends: | |
 IWM Weekly Chart |
|
| Long Term Trend: Good | |
| Medium Term Trend: Not Good | |
 IWM Daily Chart |
|
| Short Term Trend: Not Good | |
| Overall Trend Score: 26 | |
| YTD Performance: -2.82% | |
| **Trend Scores & Views Are Only For Educational Purposes And Not For Investing | |
| 12Stocks.com: Top Performing Small Cap Index Stocks | ||||||||||||||||||||||||||||||||||||||||||||||||
 The top performing Small Cap Index stocks year to date are
Now, more recently, over last week, the top performing Small Cap Index stocks on the move are


|
||||||||||||||||||||||||||||||||||||||||||||||||
| 12Stocks.com: Investing in Smallcap Index using Exchange Traded Funds | |
|
The following table shows list of key exchange traded funds (ETF) that
help investors track Smallcap index. The following list also includes leveraged ETF funds that track twice or thrice the daily returns of Smallcap indices. Short or inverse ETF funds move in the opposite direction to the index they track and are useful during market pullbacks or during bear markets. Quick View: Move mouse or cursor over ETF symbol (ticker) to view short-term technical chart and over ETF name to view long term chart. Click on ticker or stock name for detailed view. Click on to add stock symbol to your watchlist and to view watchlist. |
12Stocks.com List of ETFs that track Smallcap Index
| Ticker | ETF Name | Watchlist | Recent Price | Smart Investing & Trading Score | Change % | Week % | Year-to-date % |
| IWM | iShares Russell 2000 | | 195.06 | 26 | -0.37 | -1.83 | -2.82% |
| IJR | iShares Core S&P Small-Cap | | 102.72 | 0 | -0.79 | -1.71 | -5.1% |
| VTWO | Vanguard Russell 2000 ETF | | 78.70 | 26 | -0.67 | -2.02 | -2.96% |
| IWN | iShares Russell 2000 Value | | 147.16 | 13 | -0.97 | -2.14 | -5.26% |
| IWO | iShares Russell 2000 Growth | | 250.26 | 26 | -0.31 | -2 | -0.78% |
| IJS | iShares S&P Small-Cap 600 Value | | 94.41 | 0 | -0.83 | -1.83 | -8.4% |
| IJT | iShares S&P Small-Cap 600 Growth | | 122.23 | 13 | -1.04 | -2.04 | -2.33% |
| SBB | ProShares Short SmallCap600 | | 16.84 | 100 | 2.62 | 1.77 | 5.71% |
| SDD | ProShares UltraShort SmallCap600 | | 20.23 | 100 | 0.00 | 2.01 | 9.79% |
| SAA | ProShares Ultra SmallCap600 | | 21.81 | 0 | -2.76 | -3.33 | -12.59% |
| SMLV | SPDR SSGA US Small Cap Low Volatil ETF | | 103.84 | 0 | -0.85 | -1.12 | -7.71% |
| XSLV | PowerShares S&P SmallCap Low Volatil ETF | | 41.62 | 0 | -0.63 | -1.13 | -5.74% |
| 12Stocks.com: Charts, Trends, Fundamental Data and Performances of SmallCap Stocks | |
|
We now take in-depth look at all SmallCap stocks including charts, multi-period performances and overall trends (as measured by Smart Investing & Trading Score). One can sort SmallCap stocks (click link to choose) by Daily, Weekly and by Year-to-Date performances. Also, one can sort by size of the company or by market capitalization. |
| Select Your Default Chart Type: | |||||
| |||||
| Click on stock symbol or name for detailed view. Click on to add stock symbol to your watchlist and to view watchlist. Quick View: Move mouse or cursor over "Daily" to quickly view daily technical stock chart and over "Weekly" to view weekly technical stock chart. | |||||

 | NN NextNav Inc. |
| Sector: Technology | |
| SubSector: Software - Infrastructure | |
| MarketCap: 314 Millions | |
| Recent Price: 8.01 Smart Investing & Trading Score: 88 | |
| Day Percent Change: 13.54% Day Change: 0.96 | |
| Week Change: 8.1% Year-to-date Change: 80.0% | |
| NN Links: Profile News Message Board | |
| Charts:- Daily , Weekly | |
| Add NN to Watchlist: View: Get Complete NN Trend Analysis ➞ | |
 | OCUL Ocular Therapeutix, Inc. |
| Sector: Health Care | |
| SubSector: Biotechnology | |
| MarketCap: 249.985 Millions | |
| Recent Price: 7.80 Smart Investing & Trading Score: 41 | |
| Day Percent Change: 0.00% Day Change: 0.00 | |
| Week Change: -2.38% Year-to-date Change: 74.9% | |
| OCUL Links: Profile News Message Board | |
| Charts:- Daily , Weekly | |
| Add OCUL to Watchlist: View: Get Complete OCUL Trend Analysis ➞ | |
 | FIP FTAI Infrastructure Inc. |
| Sector: Industrials | |
| SubSector: Industrials | |
| MarketCap: 368 Millions | |
| Recent Price: 6.76 Smart Investing & Trading Score: 51 | |
| Day Percent Change: -0.81% Day Change: -0.06 | |
| Week Change: 5.21% Year-to-date Change: 73.9% | |
| FIP Links: Profile News Message Board | |
| Charts:- Daily , Weekly | |
| Add FIP to Watchlist: View: Get Complete FIP Trend Analysis ➞ | |
 | MAX MediaAlpha, Inc. |
| Sector: Technology | |
| SubSector: Internet Content & Information | |
| MarketCap: 22537 Millions | |
| Recent Price: 19.28 Smart Investing & Trading Score: 41 | |
| Day Percent Change: 0.26% Day Change: 0.05 | |
| Week Change: -3.89% Year-to-date Change: 73.4% | |
| MAX Links: Profile News Message Board | |
| Charts:- Daily , Weekly | |
| Add MAX to Watchlist: View: Get Complete MAX Trend Analysis ➞ | |
 | MGNX MacroGenics, Inc. |
| Sector: Health Care | |
| SubSector: Biotechnology | |
| MarketCap: 262.785 Millions | |
| Recent Price: 16.67 Smart Investing & Trading Score: 46 | |
| Day Percent Change: -1.59% Day Change: -0.27 | |
| Week Change: -4.96% Year-to-date Change: 73.3% | |
| MGNX Links: Profile News Message Board | |
| Charts:- Daily , Weekly | |
| Add MGNX to Watchlist: View: Get Complete MGNX Trend Analysis ➞ | |
 | HRTX Heron Therapeutics, Inc. |
| Sector: Health Care | |
| SubSector: Biotechnology | |
| MarketCap: 1172.75 Millions | |
| Recent Price: 2.94 Smart Investing & Trading Score: 65 | |
| Day Percent Change: -0.51% Day Change: -0.02 | |
| Week Change: 0.86% Year-to-date Change: 72.7% | |
| HRTX Links: Profile News Message Board | |
| Charts:- Daily , Weekly | |
| Add HRTX to Watchlist: View: Get Complete HRTX Trend Analysis ➞ | |
 | TARS Tarsus Pharmaceuticals, Inc. |
| Sector: Health Care | |
| SubSector: Biotechnology | |
| MarketCap: 74487 Millions | |
| Recent Price: 34.95 Smart Investing & Trading Score: 36 | |
| Day Percent Change: 0.01% Day Change: 0.01 | |
| Week Change: -3.39% Year-to-date Change: 72.3% | |
| TARS Links: Profile News Message Board | |
| Charts:- Daily , Weekly | |
| Add TARS to Watchlist: View: Get Complete TARS Trend Analysis ➞ | |
 | OSCR Oscar Health, Inc. |
| Sector: Health Care | |
| SubSector: Healthcare Plans | |
| MarketCap: 1790 Millions | |
| Recent Price: 15.68 Smart Investing & Trading Score: 95 | |
| Day Percent Change: 5.95% Day Change: 0.88 | |
| Week Change: 6.38% Year-to-date Change: 72.2% | |
| OSCR Links: Profile News Message Board | |
| Charts:- Daily , Weekly | |
| Add OSCR to Watchlist: View: Get Complete OSCR Trend Analysis ➞ | |
 | GERN Geron Corporation |
| Sector: Health Care | |
| SubSector: Biotechnology | |
| MarketCap: 228.685 Millions | |
| Recent Price: 3.60 Smart Investing & Trading Score: 63 | |
| Day Percent Change: 4.35% Day Change: 0.15 | |
| Week Change: -4.51% Year-to-date Change: 70.6% | |
| GERN Links: Profile News Message Board | |
| Charts:- Daily , Weekly | |
| Add GERN to Watchlist: View: Get Complete GERN Trend Analysis ➞ | |
 | CGEM Cullinan Oncology, Inc. |
| Sector: Health Care | |
| SubSector: Biotechnology | |
| MarketCap: 433 Millions | |
| Recent Price: 17.33 Smart Investing & Trading Score: 53 | |
| Day Percent Change: 4.71% Day Change: 0.78 | |
| Week Change: 3.96% Year-to-date Change: 70.0% | |
| CGEM Links: Profile News Message Board | |
| Charts:- Daily , Weekly | |
| Add CGEM to Watchlist: View: Get Complete CGEM Trend Analysis ➞ | |
 | ARIS Aris Water Solutions, Inc. |
| Sector: Utilities | |
| SubSector: Utilities - Regulated Water | |
| MarketCap: 575 Millions | |
| Recent Price: 13.95 Smart Investing & Trading Score: 36 | |
| Day Percent Change: -0.85% Day Change: -0.12 | |
| Week Change: -2.31% Year-to-date Change: 66.3% | |
| ARIS Links: Profile News Message Board | |
| Charts:- Daily , Weekly | |
| Add ARIS to Watchlist: View: Get Complete ARIS Trend Analysis ➞ | |
 | ENTA Enanta Pharmaceuticals, Inc. |
| Sector: Health Care | |
| SubSector: Biotechnology | |
| MarketCap: 998.385 Millions | |
| Recent Price: 15.38 Smart Investing & Trading Score: 36 | |
| Day Percent Change: -4.77% Day Change: -0.77 | |
| Week Change: -6.5% Year-to-date Change: 63.4% | |
| ENTA Links: Profile News Message Board | |
| Charts:- Daily , Weekly | |
| Add ENTA to Watchlist: View: Get Complete ENTA Trend Analysis ➞ | |
 | EVER EverQuote, Inc. |
| Sector: Financials | |
| SubSector: Regional - Southeast Banks | |
| MarketCap: 767.135 Millions | |
| Recent Price: 19.86 Smart Investing & Trading Score: 83 | |
| Day Percent Change: 3.55% Day Change: 0.68 | |
| Week Change: 2.58% Year-to-date Change: 62.3% | |
| EVER Links: Profile News Message Board | |
| Charts:- Daily , Weekly | |
| Add EVER to Watchlist: View: Get Complete EVER Trend Analysis ➞ | |
 | SPRY ARS Pharmaceuticals, Inc. |
| Sector: Health Care | |
| SubSector: Biotechnology | |
| MarketCap: 632 Millions | |
| Recent Price: 9.21 Smart Investing & Trading Score: 46 | |
| Day Percent Change: -0.27% Day Change: -0.03 | |
| Week Change: 2.16% Year-to-date Change: 62.1% | |
| SPRY Links: Profile News Message Board | |
| Charts:- Daily , Weekly | |
| Add SPRY to Watchlist: View: Get Complete SPRY Trend Analysis ➞ | |
 | MRSN Mersana Therapeutics, Inc. |
| Sector: Health Care | |
| SubSector: Biotechnology | |
| MarketCap: 224.385 Millions | |
| Recent Price: 3.75 Smart Investing & Trading Score: 68 | |
| Day Percent Change: -1.06% Day Change: -0.04 | |
| Week Change: -1.57% Year-to-date Change: 61.6% | |
| MRSN Links: Profile News Message Board | |
| Charts:- Daily , Weekly | |
| Add MRSN to Watchlist: View: Get Complete MRSN Trend Analysis ➞ | |
 | VITL Vital Farms, Inc. |
| Sector: Consumer Staples | |
| SubSector: Farm Products | |
| MarketCap: 10347 Millions | |
| Recent Price: 25.18 Smart Investing & Trading Score: 61 | |
| Day Percent Change: 1.21% Day Change: 0.30 | |
| Week Change: 0.44% Year-to-date Change: 60.4% | |
| VITL Links: Profile News Message Board | |
| Charts:- Daily , Weekly | |
| Add VITL to Watchlist: View: Get Complete VITL Trend Analysis ➞ | |
 | SIGA SIGA Technologies, Inc. |
| Sector: Health Care | |
| SubSector: Biotechnology | |
| MarketCap: 424.285 Millions | |
| Recent Price: 8.93 Smart Investing & Trading Score: 51 | |
| Day Percent Change: 0.56% Day Change: 0.05 | |
| Week Change: 1.36% Year-to-date Change: 59.5% | |
| SIGA Links: Profile News Message Board | |
| Charts:- Daily , Weekly | |
| Add SIGA to Watchlist: View: Get Complete SIGA Trend Analysis ➞ | |
 | PROK ProKidney Corp. |
| Sector: Health Care | |
| SubSector: Biotechnology | |
| MarketCap: 2470 Millions | |
| Recent Price: 2.73 Smart Investing & Trading Score: 100 | |
| Day Percent Change: 30.62% Day Change: 0.64 | |
| Week Change: 56% Year-to-date Change: 56.5% | |
| PROK Links: Profile News Message Board | |
| Charts:- Daily , Weekly | |
| Add PROK to Watchlist: View: Get Complete PROK Trend Analysis ➞ | |
 | XFOR X4 Pharmaceuticals, Inc. |
| Sector: Health Care | |
| SubSector: Biotechnology | |
| MarketCap: 143.385 Millions | |
| Recent Price: 1.31 Smart Investing & Trading Score: 46 | |
| Day Percent Change: 4.80% Day Change: 0.06 | |
| Week Change: -2.24% Year-to-date Change: 56.2% | |
| XFOR Links: Profile News Message Board | |
| Charts:- Daily , Weekly | |
| Add XFOR to Watchlist: View: Get Complete XFOR Trend Analysis ➞ | |
 | DXPE DXP Enterprises, Inc. |
| Sector: Services & Goods | |
| SubSector: Industrial Equipment Wholesale | |
| MarketCap: 243.758 Millions | |
| Recent Price: 52.49 Smart Investing & Trading Score: 36 | |
| Day Percent Change: -0.90% Day Change: -0.48 | |
| Week Change: -2.82% Year-to-date Change: 55.8% | |
| DXPE Links: Profile News Message Board | |
| Charts:- Daily , Weekly | |
| Add DXPE to Watchlist: View: Get Complete DXPE Trend Analysis ➞ | |
 | FTAI Fortress Transportation and Infrastructure Investors LLC |
| Sector: Transports | |
| SubSector: Rental & Leasing Services | |
| MarketCap: 758.344 Millions | |
| Recent Price: 71.72 Smart Investing & Trading Score: 65 | |
| Day Percent Change: 0.99% Day Change: 0.70 | |
| Week Change: -0.03% Year-to-date Change: 54.6% | |
| FTAI Links: Profile News Message Board | |
| Charts:- Daily , Weekly | |
| Add FTAI to Watchlist: View: Get Complete FTAI Trend Analysis ➞ | |
 | DOOR Masonite International Corporation |
| Sector: Industrials | |
| SubSector: General Building Materials | |
| MarketCap: 1220.53 Millions | |
| Recent Price: 130.68 Smart Investing & Trading Score: 61 | |
| Day Percent Change: 0.25% Day Change: 0.32 | |
| Week Change: -0.17% Year-to-date Change: 54.4% | |
| DOOR Links: Profile News Message Board | |
| Charts:- Daily , Weekly | |
| Add DOOR to Watchlist: View: Get Complete DOOR Trend Analysis ➞ | |
 | PAYS PaySign, Inc. |
| Sector: Services & Goods | |
| SubSector: Business Services | |
| MarketCap: 213.882 Millions | |
| Recent Price: 4.32 Smart Investing & Trading Score: 51 | |
| Day Percent Change: 6.40% Day Change: 0.26 | |
| Week Change: -0.92% Year-to-date Change: 54.3% | |
| PAYS Links: Profile News Message Board | |
| Charts:- Daily , Weekly | |
| Add PAYS to Watchlist: View: Get Complete PAYS Trend Analysis ➞ | |
 | SMR NuScale Power Corporation |
| Sector: Industrials | |
| SubSector: Specialty Industrial Machinery | |
| MarketCap: 1510 Millions | |
| Recent Price: 4.97 Smart Investing & Trading Score: 46 | |
| Day Percent Change: 2.47% Day Change: 0.12 | |
| Week Change: -5.69% Year-to-date Change: 54.1% | |
| SMR Links: Profile News Message Board | |
| Charts:- Daily , Weekly | |
| Add SMR to Watchlist: View: Get Complete SMR Trend Analysis ➞ | |
 | PRM Perimeter Solutions, SA |
| Sector: Materials | |
| SubSector: Specialty Chemicals | |
| MarketCap: 930 Millions | |
| Recent Price: 7.06 Smart Investing & Trading Score: 36 | |
| Day Percent Change: -0.70% Day Change: -0.05 | |
| Week Change: -2.62% Year-to-date Change: 53.7% | |
| PRM Links: Profile News Message Board | |
| Charts:- Daily , Weekly | |
| Add PRM to Watchlist: View: Get Complete PRM Trend Analysis ➞ | |
| Too many stocks? View smallcap stocks filtered by marketcap & sector |
| Marketcap: All SmallCap Stocks (default-no microcap), Large, Mid-Range, Small & MicroCap |
| Sector: Tech, Finance, Energy, Staples, Retail, Industrial, Materials, Utilities & Medical |
|
Best Stocks Today 12Stocks.com |
© 2024 12Stocks.com Terms & Conditions Privacy Contact Us
All Information Provided Only For Education And Not To Be Used For Investing or Trading. See Terms & Conditions


One More Thing ... Get Best Stocks Delivered Daily!
Never Ever Miss A Move With Our Top Ten Stocks Lists
Find Best Stocks In Any Market - Bull or Bear Market
Take A Peek At Our Top Ten Stocks Lists: Daily, Weekly, Year-to-Date & Top Trends
Find Best Stocks In Any Market - Bull or Bear Market
Take A Peek At Our Top Ten Stocks Lists: Daily, Weekly, Year-to-Date & Top Trends
Smallcap Stocks With Best Up Trends [0-bearish to 100-bullish]: Macatawa Bank[100], ProKidney [100], Intra-Cellular Therapies[100], Warrior Met[100], IMAX [100], Boot Barn[100], Argan [100], Encore Wire[100], Core Molding[100], Oscar Health[95], Mercury General[95]
Best Smallcap Stocks Year-to-Date:
CareMax [506.19%], Janux [369.99%], Viking [259.22%], Super Micro[243.41%], Alpine Immune[238.71%], Arcutis Bio[212.38%], Longboard [198.85%], Vera [174.87%], Avidity Biosciences[164.49%], Veritone [140.11%], Stoke [136.88%] Best Smallcap Stocks This Week:
ProKidney [56%], Macatawa Bank[42.54%], Snap One[29.3%], Intra-Cellular Therapies[21.21%], Escalade [15.03%], ALX Oncology[11.51%], Encore Wire[11.12%], Warrior Met[9.13%], Super Micro[8.65%], NextNav [8.1%], Envestnet [7.85%] Best Smallcap Stocks Daily:
Macatawa Bank[37.66%], ProKidney [30.62%], Intra-Cellular Therapies[23.30%], System1 [21.93%], Escalade [16.11%], NextNav [13.54%], ALX Oncology[12.72%], Allbirds [10.78%], Super Micro[10.58%], Mondee [9.57%], Nuvectis Pharma[9.44%]