
![]()
| Terms & Conditions | Follow @DozenStocks | 12Stocks.com - Best Performing Stocks |
|
 Login Sign Up


| |||||
 |  | ||||
| 12Stocks.com Market Intelligence |
12Stocks.com Smart Investing Center
|
|
| What is Smart Investing & Trading Score (AKA Market Intelligence Score )? | ||||||
| 12Stocks.com Smart Investing & Trading Score (SITS) measures the stock uptrend using our advanced anaysis. It has two components: | ||||||
Our rating display is similar to an elevator display in a building which shows the floor number (e.g., seventh floor in a ten storied buiding) and the direction ( or or  ) the elevator is moving. ) the elevator is moving.Smart Investing & Trading Score is on a scale of 0 (bearish) to 100 (bullish). The or arrows show if the uptrend is getting better or worse (in comparison to previous trading sessions). | ||||||
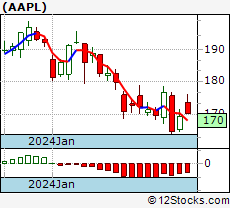
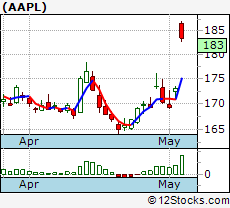
For example, a stock with Smart Investing & Trading Score of 90 and means the stock is in bullish zone and uptrend is getting stronger. A stock with Smart Investing & Trading Score of 10 and means although the stock is in a bearish zone, the uptrend is getting better and there might be a bounce ahead. Similarly, a stock with Smart Investing & Trading Score of 90 and means although the stock is in a bullish zone, the short term uptrend might be weakening but long term trend is intact. A stock with Smart Investing & Trading Score of 20 and means the stock is in a bearish zone and the short term downtrend might be getting stronger.So does stock in bullish zone means buy? NO! Our trends are basically opinions (let's say educated opinion of our analytic algorithms). Just like a magnetic compass is useful when exploring real world, our trends are just an indicator in exploring the stock markets. It is not advice to buy or sell any stock. Discover Best Stocks Every thing is relative. Smart Investing & Trading Trend Score not only indicates the current trend of the stock as estimated by our algorithms but also help in finding stocks that are working now. On every page at 12Stocks.com, you will find stocks along with their trend scores. This helps you to compare and find which stocks are trending better currently. For example, our S&P 500 stocks page shows comparision table of S&P 500 stocks. Here one can view the trend scores and observe which stocks from the 500 stocks have good trends compared to the rest. Trends and Time Periods Stocks have different trends over different time periods and 12Stocks.com Smart Investing & Trading Trend Score reflects that. For example, a stock with excellent long term uptrend might be having temporary short term pullback or downtrend. Investors and traders have different time horizons for their investments or trades. A short term trader might be interested to trade the ups & downs as stocks twists and turns daily. Active traders might be interested in short term trends. A long term investor might be interested in long term trends (over months) and ignore the short term noise. Our Smart Investing & Trading Score reflects the overall trend over near term but it also incorporates the long term trend of the stock. After all the trends are like the Russian egg where overall trend contains the long term trend which contains mid term (weekly) trend and which in turn contains short term trend. To visualize the trends, the following three charts of Apple shows the long term, mid term and short term trends.
Although we use automated scientific computer programs to estimate stock trends, we think trends are more of an art than science. Look at the AAPL charts above. Stare at them. Try to figure out for yourself by just using your eyes what the short term, mid term and long term trends are. What are the support (floor) and resistance (ceiling) levels? Believe and trust your eyes. We provide daily, weekly & monthly charts for all stocks here at 12Stocks.com and you can look at them and glean trends by yourself. How do I get stocks with best Smart Investing & Trading Scores? (Warning: Sales Pitch Follows) 12Stocks.com provides wealth of stock market information daily. To further help investor education, we now offer subscriptions to our market intelligence newsletters. Bull market or bear market, using our advanced math and technical analysis algorithms, we identify best trending stocks in various stock market segments. Power your investing with 12Stocks.com Market Intelligence technical reports. Subscribers will get daily report of best of the best stock trends within the subscribed market segment. For example, S&P 500 market intelligence subscribers can view best of the best stock trends for the 500 stocks within S&P 500 index market segment. |

| So what do you get when you subscribe to our market
intelligence reports? 12Stocks.com Market Intelligence Reports are the most definitive and comprehensive you will ever find. All our Market Intelligence Reports discusses the technical trends, momentum, long term trends, related bullish & short ETF funds & performances of all stocks contained within the market segment. Ultimate edge in any kind of market. For instance, S&P 500 Market Intelligence report includes: | ||
| ||
| The following Market Intelligence subscriptions are currently available: | |
| Dow Intelligence Report | $49.99 per month |
| Nasdaq 100 Intelligence Report | $99.99 per month |
| S&P 100 Intelligence Report | $99.99 per month |
| S&P 500 Intelligence Report | $149.99 per month |
| All The Above Intelligence Reports | $199.99 per month (More Than 33% Off!) |
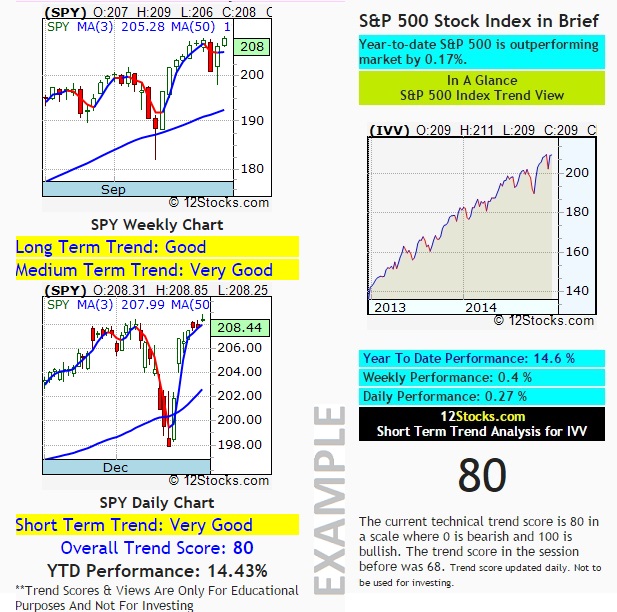
| Index Overview: Follow The Leader |
| As first step, an in depth overview of the index as trends & technicals of the index reflects on the stocks contained within it. It is difficult for stocks to outperform against headwinds of overall index down trends. A rising index tends to lift stocks within it. |
| Snapshot below from market intelligence report shows quick overview of overall index - short & long term trends, performances and technicals |
 |
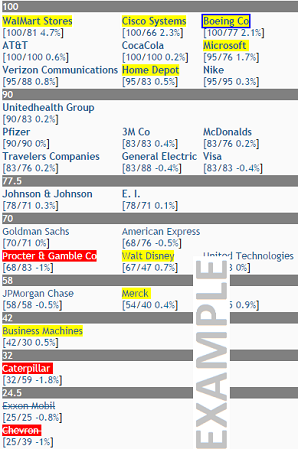
| Markets In A Glance: Good, Bad & Ugly |
| Our analytics technologies might be very complex but our reports are simple and easy to use for our subscribers. For instance, in one glance, one can view in the sample report below which
shows stocks within Dow 30 Index that are working best and which Dow stocks are lagging. Not only that, which stocks trends are starting to improve and which stocks are starting to trend down. |
| Snapshot below shows single screen review from Dow Daily Market Intelligence Report. One can easily view the best stocks and the laggards within Dow 30 Index. With falling and rising technical scores, one can spot great trading opportunities. Delivered daily**. |
 |
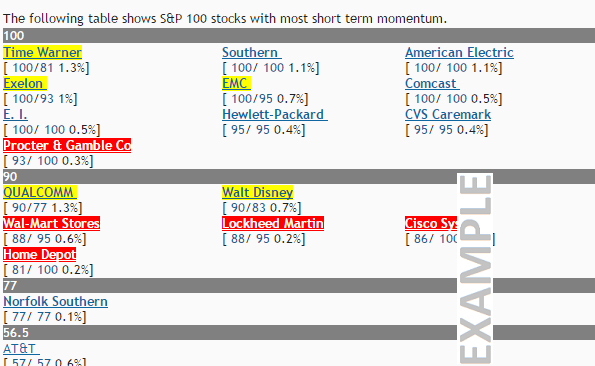
| Momentum - Fast & Furious Stocks |
| All our market intelligence technical reports filter the stocks with most momentum. Not only that, with a unique combination of multi-period trends, we can get indications when the momentum is stalling or beginning to falter. |
| Snapshot below shows stocks with strong momentum within S&P 100 index (contains largecap hundred US stocks across all sectors). Stocks make their moves up and down in bursts and our momentum measures velocity of stocks. Our momentum S&P 100 list filters the stocks with strong short term momentum. Everyday. |
 |
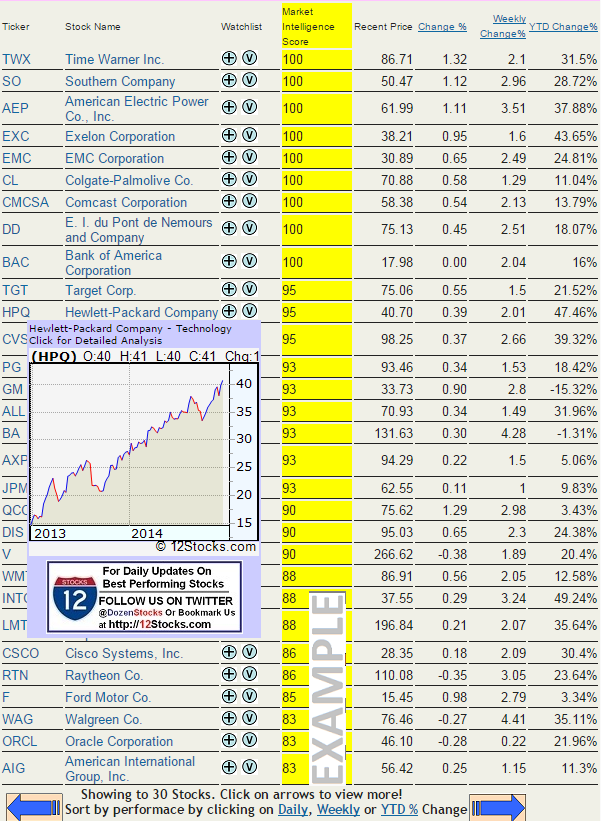
| Sort & Filter Top Stocks - Flying High |
| 12Stocks.com market intelligence reports allows users to browse through hundreds of stocks by sorting and filtering by Smart Investing & Trading Scores & performances and view along with charts - helping users identify possible investing opportunities quickly and easily. |
| Example snapshot (below) from S&P 100 market intelligence report shows sorting from bullish to bearish helping users easily identify stocks that are working now. Users can easily sort stocks by their Smart Investing & Trading Score - from bullish to bearish. |
 |
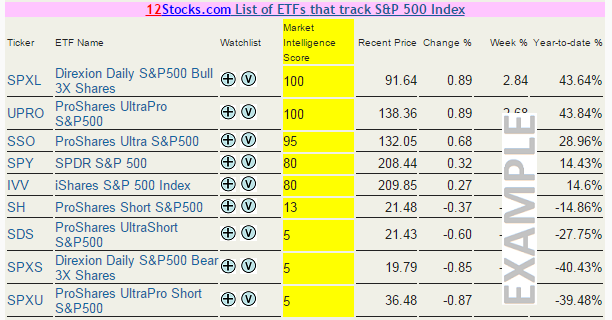
| Tracking ETF Funds: Rising Tide Lifts All Boats |
| Stocks within an index usually moves along with index. Hence, it is critical to know the trends and momentum of the overall index. |
| The table below shows, for instance, ETF Funds that track the S&P 500 index. There are leveraged ETF funds that track twice or thrice the daily performance of underlying index. Inverse funds move proportionally in the opposite direction of the index. 12Stocks.com Smart Investing & Trading Scores of the index and its tracking ETF funds help users in determining overall trend direction and use leveraged funds to hedge or multiply returns. |
 |
| Market Intelligence Mission Possible Can You Afford Not To Get It? |
12Stocks.com provides most comprehensive coverage of stock markets and indepth view of every market segment - all for free. Now we provide most definitive market intelligence technical reports subscription services at very affordable prices in order to make it available to all our readers. Why invest or trade in the dark without our market intelligence reports especially when our reports are fraction of the cost of commissions that you might be paying for your trades?
We offer several levels of subscriptions for various stock market segments. All our subscriptions come with daily 360o stock market review email updates (examples: Daily Market Review, Weekly Market Review & Year-to-Date Daily Review) for FREE as bonus. We have different subscriptions for Dow, Nasdaq 100, S&P 100 and S&P 500 stocks (ranging from just $49.99 to $149.99 per month). You can get all reports for just $199.99 per month.
| Select Your Subscriptions |
 | 12Stocks.com Dow Industrial 30 Technical Report |
This report contains trend of overall Dow Index along with rankings of all the thirty stocks contained within it. The report identifies best trending Dow stocks for both the short and long term helping investors and traders. For instance, although both Microsoft & IBM belong to Dow index, one is up 35% and the other is down 10% in 2014. Having the right Dow stocks can thus make or break one's stock portfolio.
This report costs just $49.99 a month (along with Free overall 12Stocks.com 360o market daily updates as mentioned above)
 | 12Stocks.com Nasdaq 100 Technical Report |
This report contains trend of overall Nasdaq 100 Index along with rankings of all the hundred stocks contained within it. The report identifies best trending Nasdaq 100 stocks for both the short and long term helping investors and traders. For instance, although both Apple & Mattel belong to Nasdaq 100 index, one is up 45% and the other is down 35% in 2014. Having the right Nasdaq 100 stocks can thus power or break one's stock portfolio.
This report costs just at $99.99 a month (along with Free overall 12Stocks.com 360o market daily reviews as mentioned above)
 | 12Stocks.com S&P 100 Technical Report |
This report contains trend of overall S&P 100 Index along with rankings of all the hundred stocks contained within it. The report identifies best trending S&P 100 stocks for both the short and long term helping investors and traders. For instance, although both Apple & GM belong to S&P 100 index, one is up 45% and the other is down 20% in 2014. Having the right S&P 100 stocks can thus power or break one's stock portfolio.
This report costs just at $99.99 a month (along with Free overall 12Stocks.com 360o market daily reviews as mentioned above)
| 12Stocks.com S&P 500 Technical Report |
This report contains trend of overall S&P 500 Index along with rankings of all five hundred stocks contained within it. The report identifies best trending S&P 500 stocks for both the short and long term helping investors and traders. For instance, although both Apple & GM belong to S&P 500 index, one is up 45% and the other is down 20% in 2014. Having the right S&P 500 stocks can thus power or break one's stock portfolio.
This report costs just at $149.99 a month (along with Free overall 12Stocks.com 360o market daily reviews as mentioned above)
| | | Get All Three Technical Reports |
DISCLAIMER: Our technical reports are NOT stock picks and in NO WAY is it investment advice. We are NOT investment advisors and only thing we can advise is for you to consult a certified investment advisor before you make any investment decision. All our subscriptions is for our readers to educate and understand stock markets and investing/trading process better. Past performance of any stock or ETF fund is not an indicator of future performance or results. All information is provided as is and is only for educational and entertainment purposes. Despite our best efforts, information and data in our newsletters, market intelligence technical reports and on our website, http://12Stocks.com, might be inaccurate or outdated and hence should never be used for investing or trading. We are not responsible for any losses suffered - financial or otherwise. You assume all risk associated with investing or trading decisions made on the basis of content found in our subscription newsletters or on our http://12Stocks.com & its network of websites. Please review our terms & agreement and privacy policies at http://12Stocks.com for complete information.
**Although we strive to deliver market intelligence reports daily, there might be days when no market intelligence reports might be issued due hardware or software problems.
| For further information or queries: |  |
© 2024 12Stocks.com Terms & Conditions Privacy Contact Us
All Information Provided Only For Education And Not To Be Used For Investing or Trading. See Terms & Conditions


Get Best Performing Stocks, Daily Market Trends & Insight
Take A Peek At Our Top Ten Stocks Lists: Daily, Weekly, Year-to-Date & Top Trends
NVIDIA [77.16%], Constellation Energy[60.86%], NRG Energy[40.83%], Chipotle Mexican[39.35%], Western Digital[36.26%], Eaton [34.66%], Micron [34.57%], Targa Resources[34.52%], Diamondback Energy[33.97%], Marathon [33.72%] Best Nasdaq 100 Stocks Weekly Update:
MongoDB [17.26%], NVIDIA [15.14%], Microchip [14.59%], Tesla [14.44%], Pinduoduo [13.94%], NXP Semiconductors[12.82%], KLA [12.43%], ON Semiconductor[12.11%], Marvell [12.06%], UltraPro[11.72%] Today's Stock Market In A Nutshell:China [1.7%], Emerging Markets [1.2%], US Small Cap [1%], US Large Cap [1%], Europe [0.9%], US Dollar [0.5%], Gold [0.3%], US Mid Cap [0.3%], Bonds [0.2%], Oil [-0.1%], Euro [-0.2%],