
![]()
Stocks with best trends & most momentum Starts at $49.99/Mo Subscribe ➞
| Terms & Conditions | Follow @DozenStocks | 12Stocks.com - Best Performing Stocks |
|
 Login Sign Up


| |||||
 |  | ||||
| 12Stocks.com Market Intelligence |
12Stocks.com : Most Comprehensive Stock Education & Analysis Website
All Information Provided As-Is : Not To Be Used For Investing Decisions
All Information Provided As-Is : Not To Be Used For Investing Decisions
| ||||||||||||||||||
| Quick Read: Most Popular ETFs List For Major Market Segments Table View, Chart View, Slide Show View | ||||||||||||||||||
| Quickly Browse, Sort & Filter Top ETF Lists: Daily, Weekly, Year-to-date & Trends | ||||||||||||||||||

 Prev
Prev Next
Next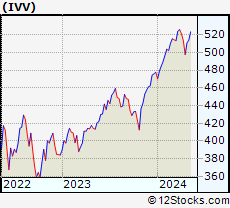
| US Total Stock Index in Brief | |
| Year-to-date Large Cap segment is underperforming market by 0%. | |
| In A Glance US Total Stock Market Trend View | |
 |
|
| Year To Date Performance: 6.14 % | |
| Weekly Performance: 2.67 % | |
| Daily Performance: 0.93 % | |
| 12Stocks.com Short Term Trend Analysis for | |
| 63 | |
| The current technical trend score is 63 in a scale where 0 is bearish and 100 is bullish. The trend score in the session before was 44. Trend score updated daily. Not to be used for investing. |
| 12Stocks.com: Investing With Popular ETFs | |
|
The following table helps investors and traders sort through current performance of various
popular exchange traded finds (ETFs) from literally every major asset class (US Stocks, International Equities, Bonds, Commodities, ForEx, Leveraged Funds, Short/Bearish Funds). The table below gives 360o comprehensive view of global ETF list by performance over daily, weekly or year-to-date periods. One can build a diverisified portfolio of ETF funds from the ETF list below. (TIP: Placing your mouse cursor over ETF ticker and ETF name will show daily and weekly charts respectively. One can create a temporary portfolio of ETF funds from different asset classes by clicking on "+" and click on "V" to view the temporary portfolio.) |
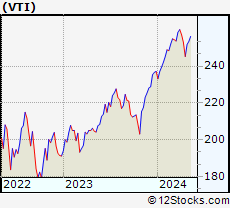
12Stocks.com Performance of Most Popular ETFs
| Ticker | ETF Name | Watchlist | Category | Recent Price | Change % | Weekly Change% | YTD Change% |
The following section shows detailed view of popular exchange traded finds (ETFs) across every major asset class (US Stocks, International Equities, Bonds, Commodities, ForEx and Volatality).
The table below shows the charts and details for each of these ETFs. You can select the type of chart below.
| Select Your Default Chart Type: | |||||
| |||||
Click on stock symbol or name for detailed view. Click on  to add stock symbol to your watchlist and to add stock symbol to your watchlist and  to view watchlist. Quick View: Move mouse or cursor over "Daily" to quickly view daily technical stock chart and over "Weekly" to view weekly technical stock chart. to view watchlist. Quick View: Move mouse or cursor over "Daily" to quickly view daily technical stock chart and over "Weekly" to view weekly technical stock chart. | |||||


| Charts, Fundamental Data and Performances of ETFs | ||
 | Click on following links to sort by: Market Cap or Company Size Performance: Year-to-date, Week and Day |  |
| To view more ETFs click on next and previous arrows | ||
© 2024 12Stocks.com Terms & Conditions Privacy Contact Us
All Information Provided Only For Education And Not To Be Used For Investing or Trading. See Terms & Conditions


One More Thing ... Get Best Stocks Delivered Daily!
Never Ever Miss A Move With Our Top Ten Stocks Lists
Get Best Performing Stocks, Daily Market Trends & Insight
Take A Peek At Our Top Ten Stocks Lists: Daily, Weekly, Year-to-Date & Top Trends
Get Best Performing Stocks, Daily Market Trends & Insight
Take A Peek At Our Top Ten Stocks Lists: Daily, Weekly, Year-to-Date & Top Trends
Dow Stocks With Best Current Trends [0-bearish to 100-bullish]: Goldman Sachs[100], Chevron [100], Merck [100], Coca-Cola [93], UltraShort[76], Procter & Gamble[76], Walmart [71], JPMorgan Chase[70], Dow [68], American Express[68] Best S&P 500 Stocks Year-to-Date Update:
NVIDIA [77.16%], Constellation Energy[60.86%], NRG Energy[40.83%], Chipotle Mexican[39.35%], Western Digital[36.26%], Eaton [34.66%], Micron [34.57%], Targa Resources[34.52%], Diamondback Energy[33.97%], Marathon [33.72%] Best Nasdaq 100 Stocks Weekly Update:
MongoDB [17.26%], NVIDIA [15.14%], Microchip [14.59%], Tesla [14.44%], Pinduoduo [13.94%], NXP Semiconductors[12.82%], KLA [12.43%], ON Semiconductor[12.11%], Marvell [12.06%], UltraPro[11.72%] Today's Stock Market In A Nutshell:China [1.7%], Emerging Markets [1.2%], US Small Cap [1%], US Large Cap [1%], Europe [0.9%], US Dollar [0.5%], Gold [0.3%], US Mid Cap [0.3%], Bonds [0.2%], Oil [-0.1%], Euro [-0.2%],