
 Login Sign Up


| |||||
 |  | ||||

| 12Stocks.com Market Intelligence |
Best S&P 100 Stocks
| In a hurry? S&P 100 Stocks Lists: Performance Trends Table, Stock Charts
Sort S&P 100 stocks: Daily, Weekly, Year-to-Date, Market Cap & Trends. |
| 12Stocks.com S&P 100 Stocks Performances & Trends Daily | |||||||||
|
|  The overall Smart Investing & Trading Score is 63 (0-bearish to 100-bullish) which puts S&P 100 index in short term neutral to bullish trend. The Smart Investing & Trading Score from previous trading session is 44 and hence an improvement of trend.
| ||||||||
Here are the Smart Investing & Trading Scores of the most requested S&P 100 stocks at 12Stocks.com (click stock name for detailed review):
|


| 12Stocks.com: Top Performing S&P 100 Index Stocks | ||||||||||||||||||||||||||||||||||||||||||||||||
 The top performing S&P 100 Index stocks year to date are
Now, more recently, over last week, the top performing S&P 100 Index stocks on the move are


|
||||||||||||||||||||||||||||||||||||||||||||||||
| 12Stocks.com: Investing in S&P 100 Index with Stocks | |
|
The following table helps investors and traders sort through current performance and trends (as measured by Smart Investing & Trading Score) of various
stocks in the S&P 100 Index. Quick View: Move mouse or cursor over stock symbol (ticker) to view short-term technical chart and over stock name to view long term chart. Click on  to add stock symbol to your watchlist and to add stock symbol to your watchlist and  to view watchlist. Click on any ticker or stock name for detailed market intelligence report for that stock. to view watchlist. Click on any ticker or stock name for detailed market intelligence report for that stock. |
12Stocks.com Performance of Stocks in S&P 100 Index
| Ticker | Stock Name | Watchlist | Category | Recent Price | Smart Investing & Trading Score | Change % | YTD Change% |
| MSFT | Microsoft |   | Technology | 406.32 | 51 | 1.82% | 8.05% |
| AAPL | Apple | | Technology | 169.30 | 50 | -0.35% | -12.07% |
| AMZN | Amazon.com | | Services & Goods | 179.62 | 63 | 3.43% | 18.22% |
| GOOGL | | Technology | 171.95 | 100 | 10.22% | 23.09% | |
| META | Meta Platforms | | Technology | 443.29 | 33 | 2.34% | 25.22% |
| GOOG | | Technology | 173.69 | 100 | 9.97% | 23.25% | |
| WMT | Walmart | | Services & Goods | 60.16 | 71 | -0.08% | 14.48% |
| V | Visa | | Financials | 274.52 | 45 | -0.23% | 5.44% |
| JNJ | Johnson & Johnson | | Health Care | 146.14 | 7 | -0.46% | -6.76% |
| JPM | JPMorgan Chase | | Financials | 193.49 | 70 | 0.06% | 13.75% |
| PG | Procter & Gamble | | Consumer Staples | 161.29 | 76 | -0.78% | 10.07% |
| MA | Mastercard | | Financials | 462.42 | 51 | 0.07% | 8.42% |
| VZ | Verizon | | Technology | 39.68 | 30 | 1.17% | 5.25% |
| T | AT&T | | Technology | 16.75 | 47 | 1.03% | -0.18% |
| INTC | Intel | | Technology | 31.88 | 0 | -9.20% | -36.56% |
| UNH | UnitedHealth | | Health Care | 495.35 | 59 | 0.30% | -5.91% |
| MRK | Merck | | Health Care | 131.20 | 100 | 0.37% | 20.34% |
| BAC | Bank of America | | Financials | 37.83 | 75 | -0.21% | 12.36% |
| HD | Home Depot | | Services & Goods | 335.09 | 17 | 0.94% | -3.31% |
| KO | Coca-Cola | | Consumer Staples | 61.74 | 93 | 0.00% | 4.77% |
| DIS | Walt Disney | | Services & Goods | 112.73 | 61 | -0.04% | 24.85% |
| PFE | Pfizer | | Health Care | 25.40 | 17 | 0.55% | -11.77% |
| CSCO | Cisco Systems | | Technology | 47.86 | 0 | -0.50% | -5.27% |
| CMCSA | Comcast | | Services & Goods | 38.57 | 0 | 1.85% | -12.04% |
| ORCL | Oracle | | Technology | 117.21 | 58 | 2.02% | 11.17% |
| For chart view version of above stock list: Chart View ➞ 0 - 25 , 25 - 50 , 50 - 75 , 75 - 100 , 100 - 125 | ||
 | Click To Change The Sort Order: By Market Cap or Company Size Performance: Year-to-date, Week and Day |  |
|
Get the most comprehensive stock market coverage daily at 12Stocks.com ➞ Best Stocks Today ➞ Best Stocks Weekly ➞ Best Stocks Year-to-Date ➞ Best Stocks Trends ➞  Best Stocks Today 12Stocks.com Best Nasdaq Stocks ➞ Best S&P 500 Stocks ➞ Best Tech Stocks ➞ Best Biotech Stocks ➞ |
| Detailed Overview of S&P 100 Stocks |
| S&P 100 Technical Overview, Leaders & Laggards, Top S&P 100 ETF Funds & Detailed S&P 100 Stocks List, Charts, Trends & More |
| S&P 100: Technical Analysis, Trends & YTD Performance | |
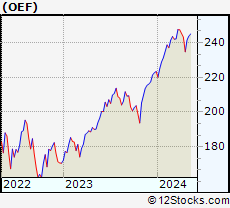
| S&P 100 index as represented by
OEF, an exchange-traded fund [ETF], holds basket of one hundred US (mostly largecap) stocks from across all major sectors of the US stock market. The S&P 100 index (contains stocks like Apple and Exxon) is up by 8.13% and is currently outperforming the overall market by 1.99% year-to-date. Below is a quick view of technical charts and trends: | |
 OEF Weekly Chart |
|
| Long Term Trend: Good | |
| Medium Term Trend: Not Good | |
 OEF Daily Chart |
|
| Short Term Trend: Very Good | |
| Overall Trend Score: 63 | |
| YTD Performance: 8.13% | |
| **Trend Scores & Views Are Only For Educational Purposes And Not For Investing | |
| 12Stocks.com: Investing in S&P 100 Index using Exchange Traded Funds | |
|
The following table shows list of key exchange traded funds (ETF) that
help investors track S&P 100 index. We have also included ETF funds that track S&P 500 index since it is market-cap weighted. The following list also includes leveraged ETF funds that track twice or thrice the daily returns of S&P 100 indices. Short or inverse ETF funds move in the opposite direction to the index they track and are useful during market pullbacks or during bear markets. Quick View: Move mouse or cursor over ETF symbol (ticker) to view short-term technical chart and over ETF name to view long term chart. Click on ticker or stock name for detailed view. Click on to add stock symbol to your watchlist and to view watchlist. |
12Stocks.com List of ETFs that track S&P 100 Index
| Ticker | ETF Name | Watchlist | Recent Price | Smart Investing & Trading Score | Change % | Week % | Year-to-date % |
| SPY | SPDR S&P 500 ETF | | 508.26 | 63 | 0.95 | 2.65 | 6.93% |
| SPXS | Direxion Daily S&P 500 Bear 3X ETF | | 9.61 | 25 | -2.73 | -7.24 | -16.8% |
| SH | ProShares Short S&P500 | | 12.28 | 42 | -0.89 | -2.46 | -5.47% |
| SDS | ProShares UltraShort S&P500 | | 26.53 | 32 | -1.89 | -4.91 | -11.33% |
| SSO | ProShares Ultra S&P500 | | 72.71 | 63 | 1.95 | 5.21 | 11.74% |
| SPXL | Direxion Daily S&P500 Bull 3X ETF | | 121.14 | 63 | 2.80 | 7.63 | 16.49% |
| SPXU | ProShares UltraPro Short S&P500 | | 35.50 | 42 | -2.79 | -7.38 | -17.44% |
| UPRO | ProShares UltraPro S&P500 | | 63.82 | 63 | 2.89 | 7.88 | 16.59% |
| VOO | Vanguard 500 ETF | | 467.21 | 63 | 1.00 | 2.66 | 6.96% |
| OEF | iShares S&P 100 | | 241.56 | 63 | 1.35 | 2.93 | 8.13% |
| 12Stocks.com: Charts, Trends, Fundamental Data and Performances of S&P 100 Stocks | |
|
We now take in-depth look at all S&P 100 stocks including charts, multi-period performances and overall trends (as measured by Smart Investing & Trading Score). One can sort S&P 100 stocks (click link to choose) by Daily, Weekly and by Year-to-Date performances. Also, one can sort by size of the company or by market capitalization. |
| Select Your Default Chart Type: | |||||
| |||||
| Click on stock symbol or name for detailed view. Click on to add stock symbol to your watchlist and to view watchlist. Quick View: Move mouse or cursor over "Daily" to quickly view daily technical stock chart and over "Weekly" to view weekly technical stock chart. | |||||

 | MSFT Microsoft Corporation |
| Sector: Technology | |
| SubSector: Business Software & Services | |
| MarketCap: 1154150 Millions | |
| Recent Price: 406.32 Smart Investing & Trading Score: 51 | |
| Day Percent Change: 1.82% Day Change: 7.28 | |
| Week Change: 1.8% Year-to-date Change: 8.1% | |
| MSFT Links: Profile News Message Board | |
| Charts:- Daily , Weekly | |
| Add MSFT to Watchlist: View: Get Complete MSFT Trend Analysis ➞ | |
 | AAPL Apple Inc. |
| Sector: Technology | |
| SubSector: Electronic Equipment | |
| MarketCap: 1112940 Millions | |
| Recent Price: 169.30 Smart Investing & Trading Score: 50 | |
| Day Percent Change: -0.35% Day Change: -0.59 | |
| Week Change: 2.61% Year-to-date Change: -12.1% | |
| AAPL Links: Profile News Message Board | |
| Charts:- Daily , Weekly | |
| Add AAPL to Watchlist: View: Get Complete AAPL Trend Analysis ➞ | |
 | AMZN Amazon.com, Inc. |
| Sector: Services & Goods | |
| SubSector: Catalog & Mail Order Houses | |
| MarketCap: 998070 Millions | |
| Recent Price: 179.62 Smart Investing & Trading Score: 63 | |
| Day Percent Change: 3.43% Day Change: 5.95 | |
| Week Change: 2.86% Year-to-date Change: 18.2% | |
| AMZN Links: Profile News Message Board | |
| Charts:- Daily , Weekly | |
| Add AMZN to Watchlist: View: Get Complete AMZN Trend Analysis ➞ | |
 | GOOGL Alphabet Inc. |
| Sector: Technology | |
| SubSector: Internet Information Providers | |
| MarketCap: 801264 Millions | |
| Recent Price: 171.95 Smart Investing & Trading Score: 100 | |
| Day Percent Change: 10.22% Day Change: 15.95 | |
| Week Change: 11.59% Year-to-date Change: 23.1% | |
| GOOGL Links: Profile News Message Board | |
| Charts:- Daily , Weekly | |
| Add GOOGL to Watchlist: View: Get Complete GOOGL Trend Analysis ➞ | |
 | META Meta Platforms, Inc. |
| Sector: Technology | |
| SubSector: Internet Content & Information | |
| MarketCap: 732990 Millions | |
| Recent Price: 443.29 Smart Investing & Trading Score: 33 | |
| Day Percent Change: 2.34% Day Change: 10.12 | |
| Week Change: -7.85% Year-to-date Change: 25.2% | |
| META Links: Profile News Message Board | |
| Charts:- Daily , Weekly | |
| Add META to Watchlist: View: Get Complete META Trend Analysis ➞ | |
 | GOOG Alphabet Inc. |
| Sector: Technology | |
| SubSector: Internet Information Providers | |
| MarketCap: 730159 Millions | |
| Recent Price: 173.69 Smart Investing & Trading Score: 100 | |
| Day Percent Change: 9.97% Day Change: 15.74 | |
| Week Change: 11.54% Year-to-date Change: 23.3% | |
| GOOG Links: Profile News Message Board | |
| Charts:- Daily , Weekly | |
| Add GOOG to Watchlist: View: Get Complete GOOG Trend Analysis ➞ | |
 | WMT Walmart Inc. |
| Sector: Services & Goods | |
| SubSector: Discount, Variety Stores | |
| MarketCap: 355610 Millions | |
| Recent Price: 60.16 Smart Investing & Trading Score: 71 | |
| Day Percent Change: -0.08% Day Change: -0.05 | |
| Week Change: 1.06% Year-to-date Change: 14.5% | |
| WMT Links: Profile News Message Board | |
| Charts:- Daily , Weekly | |
| Add WMT to Watchlist: View: Get Complete WMT Trend Analysis ➞ | |
 | V Visa Inc. |
| Sector: Financials | |
| SubSector: Credit Services | |
| MarketCap: 340798 Millions | |
| Recent Price: 274.52 Smart Investing & Trading Score: 45 | |
| Day Percent Change: -0.23% Day Change: -0.64 | |
| Week Change: 1.76% Year-to-date Change: 5.4% | |
| V Links: Profile News Message Board | |
| Charts:- Daily , Weekly | |
| Add V to Watchlist: View: Get Complete V Trend Analysis ➞ | |
 | JNJ Johnson & Johnson |
| Sector: Health Care | |
| SubSector: Drug Manufacturers - Major | |
| MarketCap: 331972 Millions | |
| Recent Price: 146.14 Smart Investing & Trading Score: 7 | |
| Day Percent Change: -0.46% Day Change: -0.68 | |
| Week Change: -1.2% Year-to-date Change: -6.8% | |
| JNJ Links: Profile News Message Board | |
| Charts:- Daily , Weekly | |
| Add JNJ to Watchlist: View: Get Complete JNJ Trend Analysis ➞ | |
 | JPM JPMorgan Chase & Co. |
| Sector: Financials | |
| SubSector: Money Center Banks | |
| MarketCap: 279736 Millions | |
| Recent Price: 193.49 Smart Investing & Trading Score: 70 | |
| Day Percent Change: 0.06% Day Change: 0.12 | |
| Week Change: 4.14% Year-to-date Change: 13.8% | |
| JPM Links: Profile News Message Board | |
| Charts:- Daily , Weekly | |
| Add JPM to Watchlist: View: Get Complete JPM Trend Analysis ➞ | |
 | PG The Procter & Gamble Company |
| Sector: Consumer Staples | |
| SubSector: Personal Products | |
| MarketCap: 277162 Millions | |
| Recent Price: 161.29 Smart Investing & Trading Score: 76 | |
| Day Percent Change: -0.78% Day Change: -1.26 | |
| Week Change: 1.99% Year-to-date Change: 10.1% | |
| PG Links: Profile News Message Board | |
| Charts:- Daily , Weekly | |
| Add PG to Watchlist: View: Get Complete PG Trend Analysis ➞ | |
 | MA Mastercard Incorporated |
| Sector: Financials | |
| SubSector: Credit Services | |
| MarketCap: 234809 Millions | |
| Recent Price: 462.42 Smart Investing & Trading Score: 51 | |
| Day Percent Change: 0.07% Day Change: 0.31 | |
| Week Change: 1.54% Year-to-date Change: 8.4% | |
| MA Links: Profile News Message Board | |
| Charts:- Daily , Weekly | |
| Add MA to Watchlist: View: Get Complete MA Trend Analysis ➞ | |
 | VZ Verizon Communications Inc. |
| Sector: Technology | |
| SubSector: Telecom Services - Domestic | |
| MarketCap: 229427 Millions | |
| Recent Price: 39.68 Smart Investing & Trading Score: 30 | |
| Day Percent Change: 1.17% Day Change: 0.46 | |
| Week Change: -2% Year-to-date Change: 5.3% | |
| VZ Links: Profile News Message Board | |
| Charts:- Daily , Weekly | |
| Add VZ to Watchlist: View: Get Complete VZ Trend Analysis ➞ | |
 | T AT&T Inc. |
| Sector: Technology | |
| SubSector: Telecom Services - Domestic | |
| MarketCap: 224847 Millions | |
| Recent Price: 16.75 Smart Investing & Trading Score: 47 | |
| Day Percent Change: 1.03% Day Change: 0.17 | |
| Week Change: 1.45% Year-to-date Change: -0.2% | |
| T Links: Profile News Message Board | |
| Charts:- Daily , Weekly | |
| Add T to Watchlist: View: Get Complete T Trend Analysis ➞ | |
 | INTC Intel Corporation |
| Sector: Technology | |
| SubSector: Semiconductor - Broad Line | |
| MarketCap: 222357 Millions | |
| Recent Price: 31.88 Smart Investing & Trading Score: 0 | |
| Day Percent Change: -9.20% Day Change: -3.23 | |
| Week Change: -6.78% Year-to-date Change: -36.6% | |
| INTC Links: Profile News Message Board | |
| Charts:- Daily , Weekly | |
| Add INTC to Watchlist: View: Get Complete INTC Trend Analysis ➞ | |
 | UNH UnitedHealth Group Incorporated |
| Sector: Health Care | |
| SubSector: Health Care Plans | |
| MarketCap: 217384 Millions | |
| Recent Price: 495.35 Smart Investing & Trading Score: 59 | |
| Day Percent Change: 0.30% Day Change: 1.49 | |
| Week Change: -1.15% Year-to-date Change: -5.9% | |
| UNH Links: Profile News Message Board | |
| Charts:- Daily , Weekly | |
| Add UNH to Watchlist: View: Get Complete UNH Trend Analysis ➞ | |
 | MRK Merck & Co., Inc. |
| Sector: Health Care | |
| SubSector: Drug Manufacturers - Major | |
| MarketCap: 192657 Millions | |
| Recent Price: 131.20 Smart Investing & Trading Score: 100 | |
| Day Percent Change: 0.37% Day Change: 0.48 | |
| Week Change: 4.31% Year-to-date Change: 20.3% | |
| MRK Links: Profile News Message Board | |
| Charts:- Daily , Weekly | |
| Add MRK to Watchlist: View: Get Complete MRK Trend Analysis ➞ | |
 | BAC Bank of America Corporation |
| Sector: Financials | |
| SubSector: Money Center Banks | |
| MarketCap: 189690 Millions | |
| Recent Price: 37.83 Smart Investing & Trading Score: 75 | |
| Day Percent Change: -0.21% Day Change: -0.08 | |
| Week Change: 2.33% Year-to-date Change: 12.4% | |
| BAC Links: Profile News Message Board | |
| Charts:- Daily , Weekly | |
| Add BAC to Watchlist: View: Get Complete BAC Trend Analysis ➞ | |
 | HD The Home Depot, Inc. |
| Sector: Services & Goods | |
| SubSector: Home Improvement Stores | |
| MarketCap: 185389 Millions | |
| Recent Price: 335.09 Smart Investing & Trading Score: 17 | |
| Day Percent Change: 0.94% Day Change: 3.11 | |
| Week Change: -0.08% Year-to-date Change: -3.3% | |
| HD Links: Profile News Message Board | |
| Charts:- Daily , Weekly | |
| Add HD to Watchlist: View: Get Complete HD Trend Analysis ➞ | |
 | KO The Coca-Cola Company |
| Sector: Consumer Staples | |
| SubSector: Beverages - Soft Drinks | |
| MarketCap: 182046 Millions | |
| Recent Price: 61.74 Smart Investing & Trading Score: 93 | |
| Day Percent Change: 0.00% Day Change: 0.00 | |
| Week Change: 2.61% Year-to-date Change: 4.8% | |
| KO Links: Profile News Message Board | |
| Charts:- Daily , Weekly | |
| Add KO to Watchlist: View: Get Complete KO Trend Analysis ➞ | |
 | DIS The Walt Disney Company |
| Sector: Services & Goods | |
| SubSector: Entertainment - Diversified | |
| MarketCap: 178396 Millions | |
| Recent Price: 112.73 Smart Investing & Trading Score: 61 | |
| Day Percent Change: -0.04% Day Change: -0.04 | |
| Week Change: 0.11% Year-to-date Change: 24.9% | |
| DIS Links: Profile News Message Board | |
| Charts:- Daily , Weekly | |
| Add DIS to Watchlist: View: Get Complete DIS Trend Analysis ➞ | |
 | PFE Pfizer Inc. |
| Sector: Health Care | |
| SubSector: Drug Manufacturers - Major | |
| MarketCap: 172467 Millions | |
| Recent Price: 25.40 Smart Investing & Trading Score: 17 | |
| Day Percent Change: 0.55% Day Change: 0.14 | |
| Week Change: -2.31% Year-to-date Change: -11.8% | |
| PFE Links: Profile News Message Board | |
| Charts:- Daily , Weekly | |
| Add PFE to Watchlist: View: Get Complete PFE Trend Analysis ➞ | |
 | CSCO Cisco Systems, Inc. |
| Sector: Technology | |
| SubSector: Communication Equipment | |
| MarketCap: 168483 Millions | |
| Recent Price: 47.86 Smart Investing & Trading Score: 0 | |
| Day Percent Change: -0.50% Day Change: -0.24 | |
| Week Change: -0.95% Year-to-date Change: -5.3% | |
| CSCO Links: Profile News Message Board | |
| Charts:- Daily , Weekly | |
| Add CSCO to Watchlist: View: Get Complete CSCO Trend Analysis ➞ | |
 | CMCSA Comcast Corporation |
| Sector: Services & Goods | |
| SubSector: Entertainment - Diversified | |
| MarketCap: 164849 Millions | |
| Recent Price: 38.57 Smart Investing & Trading Score: 0 | |
| Day Percent Change: 1.85% Day Change: 0.70 | |
| Week Change: -4.15% Year-to-date Change: -12.0% | |
| CMCSA Links: Profile News Message Board | |
| Charts:- Daily , Weekly | |
| Add CMCSA to Watchlist: View: Get Complete CMCSA Trend Analysis ➞ | |
 | ORCL Oracle Corporation |
| Sector: Technology | |
| SubSector: Application Software | |
| MarketCap: 164530 Millions | |
| Recent Price: 117.21 Smart Investing & Trading Score: 58 | |
| Day Percent Change: 2.02% Day Change: 2.32 | |
| Week Change: 2.03% Year-to-date Change: 11.2% | |
| ORCL Links: Profile News Message Board | |
| Charts:- Daily , Weekly | |
| Add ORCL to Watchlist: View: Get Complete ORCL Trend Analysis ➞ | |
| For tabular summary view of above stock list: Summary View ➞ 0 - 25 , 25 - 50 , 50 - 75 , 75 - 100 , 100 - 125 | ||
| Click To Change The Sort Order: By Market Cap or Company Size Performance: Year-to-date, Week and Day | |
| Select Chart Type: | ||
|
Best Stocks Today 12Stocks.com |
� 2024 12Stocks.com Terms & Conditions Privacy Contact Us
All Information Provided Only For Education And Not To Be Used For Investing or Trading. See Terms & Conditions


One More Thing ... Get Best Stocks Delivered Daily!
Never Ever Miss A Move With Our Top Ten Stocks Lists
Find Best Stocks In Any Market - Bull or Bear Market
Take A Peek At Our Top Ten Stocks Lists: Daily, Weekly, Year-to-Date & Top Trends
Find Best Stocks In Any Market - Bull or Bear Market
Take A Peek At Our Top Ten Stocks Lists: Daily, Weekly, Year-to-Date & Top Trends
S&P 100 Stocks With Best Up Trends [0-bearish to 100-bullish]: Google [100], Google [100], Colgate-Palmolive [100], Goldman Sachs[100], Texas Instruments[100], General Motors[100], Chevron [100], Merck [100], Altria [100], Costco Wholesale[95], Coca-Cola [93]
Best S&P 100 Stocks Year-to-Date:
NVIDIA [77.16%], General Motors[27.62%], General Electric[27.2%], Eli Lilly[25.83%], American Express[25.78%], Meta Platforms[25.22%], Walt Disney[24.85%], Google [23.25%], Google [23.09%], Citi [21.81%], Wells Fargo[21.72%] Best S&P 100 Stocks This Week:
NVIDIA [15.14%], Tesla [14.44%], Google [11.59%], Broadcom [11.57%], Google [11.54%], Texas Instruments[11.15%], General Electric[9.65%], General Motors[8.19%], Advanced Micro[7.34%], Citi [5.95%], PayPal [5.86%] Best S&P 100 Stocks Daily:
Google [10.22%], Google [9.97%], NVIDIA [6.18%], Broadcom [3.84%], Amazon.com [3.43%], PayPal [2.90%], Advanced Micro[2.37%], Meta Platforms[2.34%], Oracle [2.02%], Colgate-Palmolive [1.93%], Comcast [1.85%]